Home > Comparison > Industrials > ETN vs CMI
The strategic rivalry between Eaton Corporation plc and Cummins Inc. shapes the industrial machinery landscape. Eaton operates as a diversified power management company, integrating electrical and aerospace solutions. Cummins focuses on designing and manufacturing engines, electrified powertrains, and related components. This analysis contrasts Eaton’s broad industrial reach with Cummins’ specialized powertrain expertise to identify which growth trajectory offers a superior risk-adjusted return for a diversified portfolio.
Table of contents
Companies Overview
Eaton Corporation plc and Cummins Inc. stand as pivotal forces in the global industrial machinery landscape.
Eaton Corporation plc: Power Management Specialist
Eaton dominates the power management market, generating revenue primarily through electrical components and vehicle systems. Its 2026 strategy emphasizes expanding its eMobility segment, focusing on hybrid power systems and voltage inverters. Eaton’s broad portfolio spans aerospace, electrical, and vehicle markets, reinforcing its diversified industrial footprint.
Cummins Inc.: Engine and Powertrain Innovator
Cummins leads in engine design and manufacturing, specializing in diesel, natural gas engines, and electrified powertrains. Its strategic focus in 2026 centers on new power technologies, including fuel cells and hydrogen solutions. Cummins integrates power generation and filtration systems, targeting heavy-duty transport and industrial applications with a strong aftermarket service network.
Strategic Collision: Similarities & Divergences
Both companies compete in industrial power solutions but diverge in approach. Eaton pursues an integrated power management ecosystem, while Cummins prioritizes advanced engine technologies and electrification. Their battleground lies in hybrid and electric vehicle powertrains, with Eaton’s broad electrical systems contrasting Cummins’ engine-centric innovation. This creates distinct profiles: Eaton as a diversified industrial giant, Cummins as a powertrain technology pioneer.
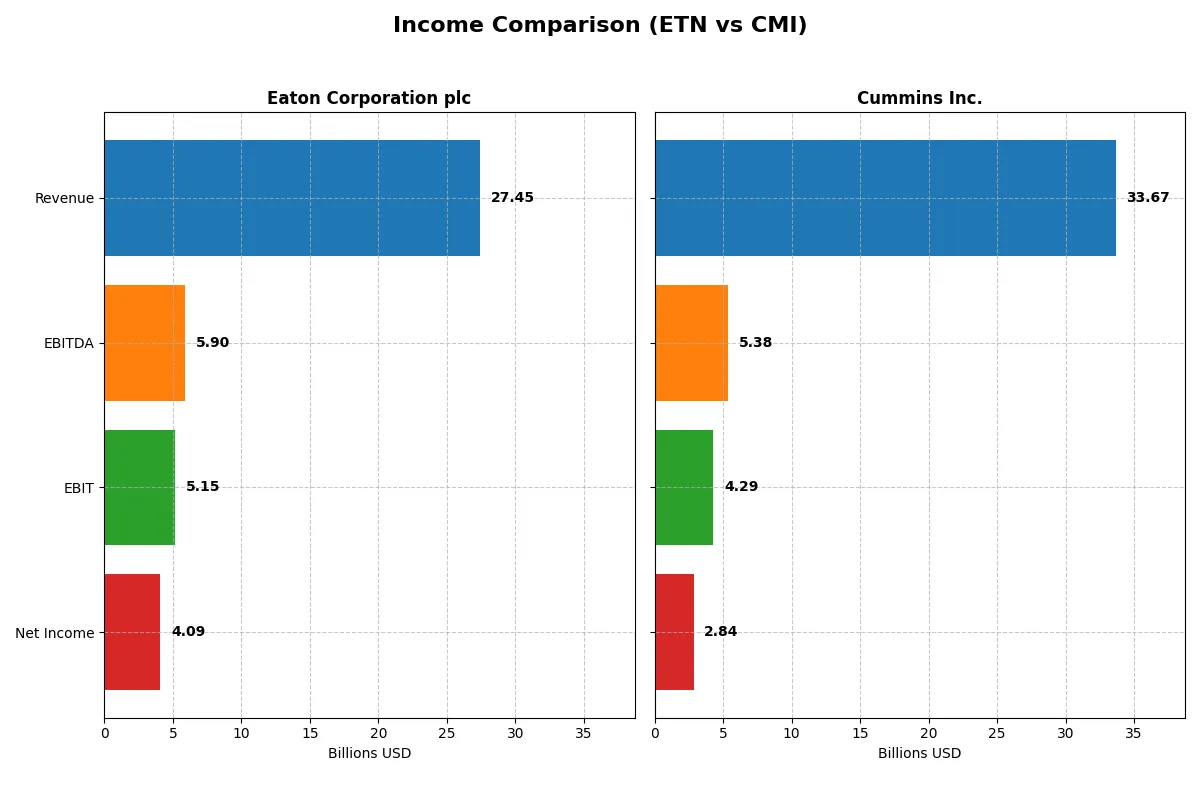
Income Statement Comparison
The following data dissects the core profitability and scalability of both corporate engines to reveal who dominates the bottom line:
| Metric | Eaton Corporation plc (ETN) | Cummins Inc. (CMI) |
|---|---|---|
| Revenue | 27.4B | 33.7B |
| Cost of Revenue | 17.1B | 25.2B |
| Operating Expenses | 5.1B | 4.5B |
| Gross Profit | 10.3B | 8.5B |
| EBITDA | 5.9B | 5.4B |
| EBIT | 5.1B | 4.3B |
| Interest Expense | 264M | 329M |
| Net Income | 4.1B | 2.8B |
| EPS | 10.49 | 20.62 |
| Fiscal Year | 2025 | 2025 |
Income Statement Analysis: The Bottom-Line Duel
This income statement comparison reveals which company drives superior profitability and operational efficiency amid shifting market conditions.
Eaton Corporation plc Analysis
Eaton’s revenue grew steadily from $19.6B in 2021 to $27.4B in 2025, with net income nearly doubling from $2.1B to $4.1B. The company maintains robust gross margins near 37.6% and net margins close to 15%, demonstrating strong cost control. In 2025, Eaton’s profitability and margin expansion reflect efficient capital allocation and resilient demand.
Cummins Inc. Analysis
Cummins’ revenue rose from $24.0B in 2021 to peak at $34.1B in 2024, then slightly declined to $33.7B in 2025. Net income surged to $3.9B in 2024 but dropped to $2.8B in 2025. Gross margin remains healthy at 25.3%, but net margin contracted to 8.4%. The recent earnings dip signals margin pressure despite scale, indicating operational headwinds.
Margin Strength vs. Revenue Scale
Eaton outperforms with superior margin expansion and consistent net income growth, nearly doubling profits over five years. Cummins boasts higher revenues but struggles with margin compression and recent profit declines. Eaton’s margin resilience makes it attractive for investors prioritizing profitability stability over sheer scale.
Financial Ratios Comparison
These vital ratios act as a diagnostic tool to expose the underlying fiscal health, valuation premiums, and capital efficiency of Eaton Corporation plc (ETN) and Cummins Inc. (CMI) for 2025:
| Ratios | Eaton Corporation plc (ETN) | Cummins Inc. (CMI) |
|---|---|---|
| ROE | 21.1% | 23.0% |
| ROIC | 13.1% | 12.0% |
| P/E | 30.2 | 24.8 |
| P/B | 6.37 | 5.70 |
| Current Ratio | 1.32 | 1.76 |
| Quick Ratio | 0.81 | 1.16 |
| D/E (Debt to Equity) | 0.54 | 0.59 |
| Debt-to-Assets | 25.5% | 21.3% |
| Interest Coverage | 19.8 | 12.1 |
| Asset Turnover | 0.67 | 0.99 |
| Fixed Asset Turnover | 5.40 | 4.84 |
| Payout Ratio | 39.5% | 37.1% |
| Dividend Yield | 1.31% | 1.50% |
| Fiscal Year | 2025 | 2025 |
Efficiency & Valuation Duel: The Vital Signs
Financial ratios act as a company’s DNA, exposing hidden risks and operational strengths that shape investor decisions.
Eaton Corporation plc
Eaton posts a robust ROE of 21.05% and a solid net margin of 14.9%, signaling strong profitability. Its P/E ratio at 30.24 appears stretched versus sector norms, reflecting a premium valuation. The firm returns value through a 1.31% dividend yield, balancing shareholder payouts with ongoing R&D investment near 3% of revenue.
Cummins Inc.
Cummins delivers an even higher ROE of 23.02%, though its net margin at 8.44% is moderate. Its P/E ratio of 24.76 looks fair, indicating a reasonable valuation. The company supports shareholders with a 1.5% dividend yield, while allocating over 4% of revenue to R&D, driving long-term growth and operational efficiency.
Premium Valuation vs. Operational Safety
Eaton’s higher profitability and margin strength come with a stretched valuation, posing valuation risk. Cummins offers a better valuation balance with slightly lower margins but stronger liquidity ratios. Investors seeking growth at a premium may lean Eaton; those prioritizing valuation and operational safety might prefer Cummins.
Which one offers the Superior Shareholder Reward?
I see Eaton Corporation plc (ETN) and Cummins Inc. (CMI) both pay dividends and execute buybacks but with distinct strategies. ETN yields about 1.3% with a payout near 40%, well covered by free cash flow, signaling sustainable income. CMI offers a higher yield around 1.5%, backed by a lower payout near 37%, but its free cash flow coverage fell sharply in 2024, raising sustainability concerns. Both run active buyback programs; however, ETN maintains steadier free cash flow generation, supporting consistent buybacks and dividends. I judge ETN’s balanced dividend and buyback approach more sustainable for long-term value. Thus, in 2026, ETN offers the more attractive total shareholder return profile.
Comparative Score Analysis: The Strategic Profile
The radar chart reveals the fundamental DNA and trade-offs of Eaton Corporation plc and Cummins Inc., highlighting their strategic financial strengths and weaknesses:
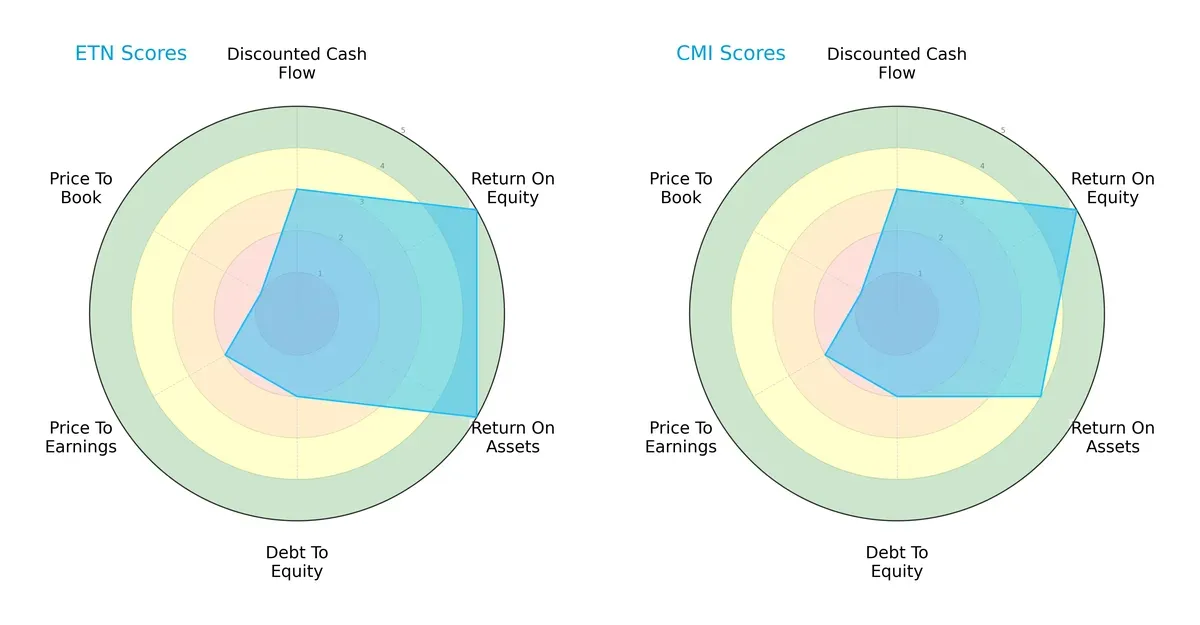
Eaton and Cummins share identical overall and discounted cash flow scores, signaling comparable valuation and cash generation. Eaton edges out with a perfect ROA score (5 vs. 4), indicating superior asset efficiency, while both tie on ROE (5). Both have weak debt-to-equity (2) and valuation scores (PE at 2, PB at 1), reflecting balance sheet leverage and market pricing concerns. Eaton’s profile is more balanced in operational efficiency; Cummins relies slightly more on equity returns.
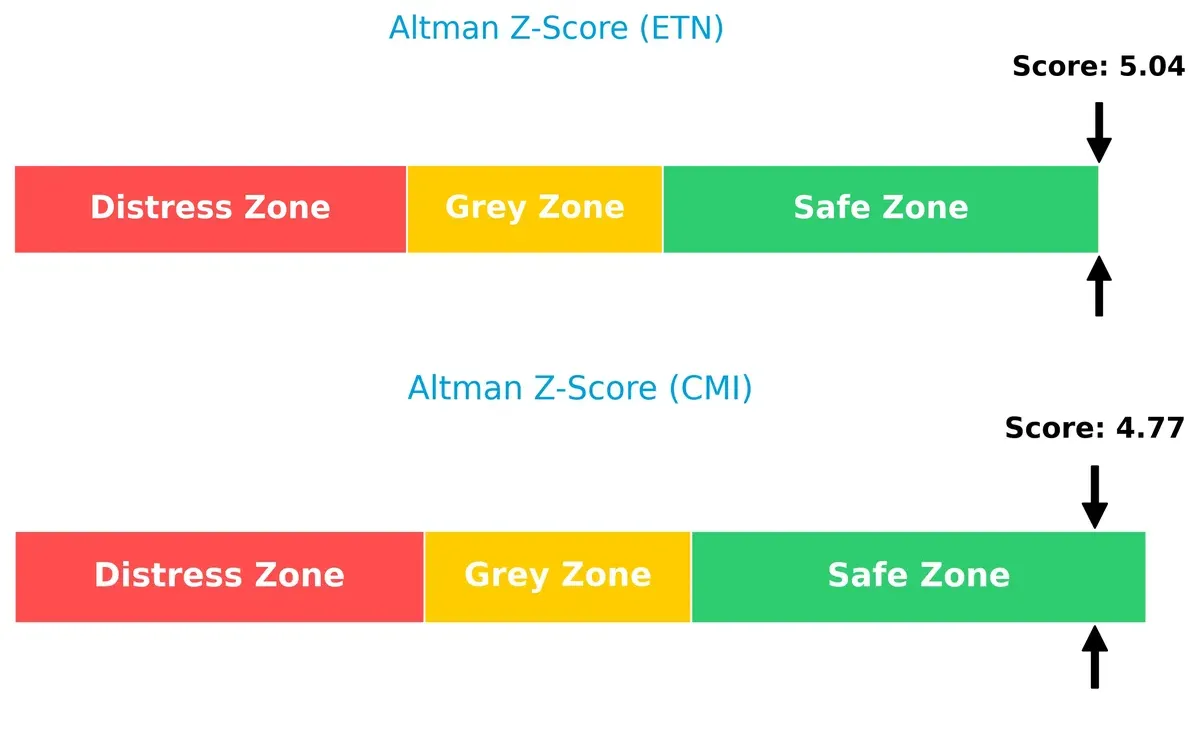
Bankruptcy Risk: Solvency Showdown
The Altman Z-Scores place both firms comfortably in the safe zone, with Eaton at 5.04 and Cummins at 4.77, signaling strong solvency and low bankruptcy risk in the current cycle:
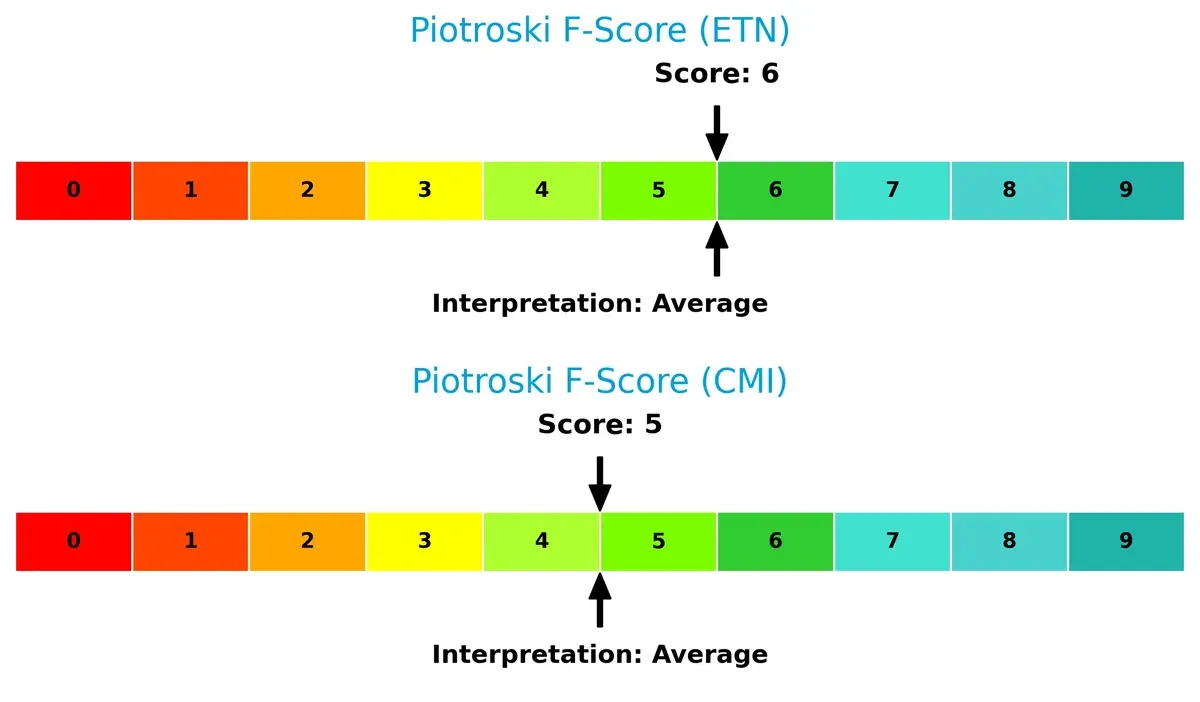
Financial Health: Quality of Operations
Eaton leads marginally with a Piotroski F-Score of 6 versus Cummins’ 5, indicating slightly stronger internal financial health. Neither shows red flags, but Eaton’s higher score suggests more reliable profitability and efficiency metrics:
How are the two companies positioned?
This section dissects Eaton and Cummins’ operational DNA by comparing revenue distribution and internal strengths and weaknesses. The goal is to confront their economic moats and reveal which model delivers the most resilient competitive advantage today.
Revenue Segmentation: The Strategic Mix
This visual comparison dissects how Eaton Corporation plc and Cummins Inc. diversify their income streams and where their primary sector bets lie:
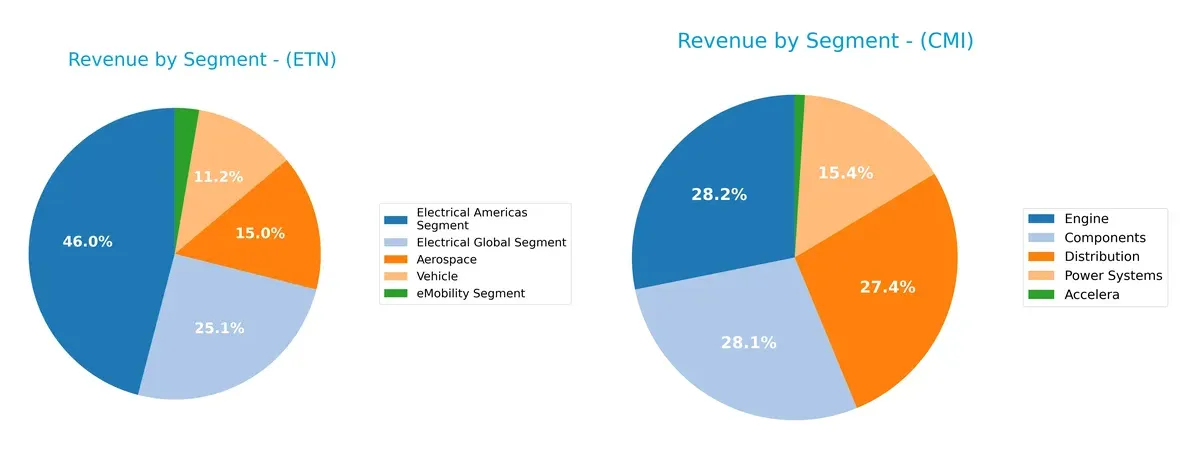
Eaton leans heavily on its Electrical Americas Segment at $11.4B, alongside strong Aerospace ($3.7B) and Electrical Global ($6.2B) divisions, showing a balanced yet electricity-focused portfolio. Cummins concentrates revenue across Components ($11.7B) and Engine ($11.7B) segments, with Distribution ($11.4B) close behind, signaling deeper reliance on powertrain and distribution infrastructure. Eaton’s diversity mitigates concentration risk, while Cummins pivots on core industrial engines, reflecting ecosystem lock-in but elevated segment dependence.
Strengths and Weaknesses Comparison
This table compares the strengths and weaknesses of Eaton Corporation plc and Cummins Inc. based on diversification, profitability, financials, innovation, global presence, and market share:
Eaton Strengths
- Diverse segments including aerospace, electrical, vehicle, and eMobility
- Strong net margin at 14.9% and ROE 21.05%
- Favorable debt to assets at 25.53% and interest coverage 19.5
Cummins Strengths
- High ROE at 23.02% and solid ROIC at 12.01%
- Favorable current and quick ratios indicate strong liquidity
- Broad US and international presence with $19.4B US revenue
Eaton Weaknesses
- Elevated P/E of 30.24 and P/B at 6.37 indicate overvaluation risks
- Neutral liquidity ratios quick ratio 0.81 may signal working capital constraints
- Asset turnover moderate at 0.67
Cummins Weaknesses
- Lower net margin at 8.44% compared to Eaton
- P/B ratio unfavorable at 5.7
- Negative total segment figures suggest complexity in segment reporting
Eaton shows strength in profitability and balanced diversification but faces valuation pressure and moderate asset efficiency. Cummins exhibits strong liquidity and profitability metrics but lower margin and some reporting complexity may impact clarity. Both companies maintain slightly favorable financial profiles with distinct operational focuses.
The Moat Duel: Analyzing Competitive Defensibility
A structural moat is the single strongest defense preserving long-term profits from relentless competitive erosion:
Eaton Corporation plc: Power Management with a Growing ROIC Moat
Eaton’s moat stems from intangible assets and broad industrial integration, reflected in a 4.26% ROIC premium over WACC. Its margin stability and rising profitability signal durable value creation. Expansion into eMobility further deepens this moat in 2026.
Cummins Inc.: Engine Innovation Facing Margin Pressure
Cummins’ moat relies on specialized engine technology and aftermarket services, but a declining ROIC trend flags shrinking profitability. Despite a 3.45% ROIC spread over WACC, weaker recent earnings growth tempers its competitive edge. New powertrain ventures offer growth but also risk disruption.
Moat Strength Showdown: Intangible Assets vs. Specialized Tech
Eaton commands a wider, more sustainable moat with growing returns and diversified industrial reach. Cummins creates value but faces margin headwinds and a contracting moat. Eaton stands better equipped to defend market share in 2026.
Which stock offers better returns?
Over the past 12 months, Eaton Corporation plc and Cummins Inc. both exhibit strong upward price momentum, with notable acceleration in gains and distinct trading volume dynamics.
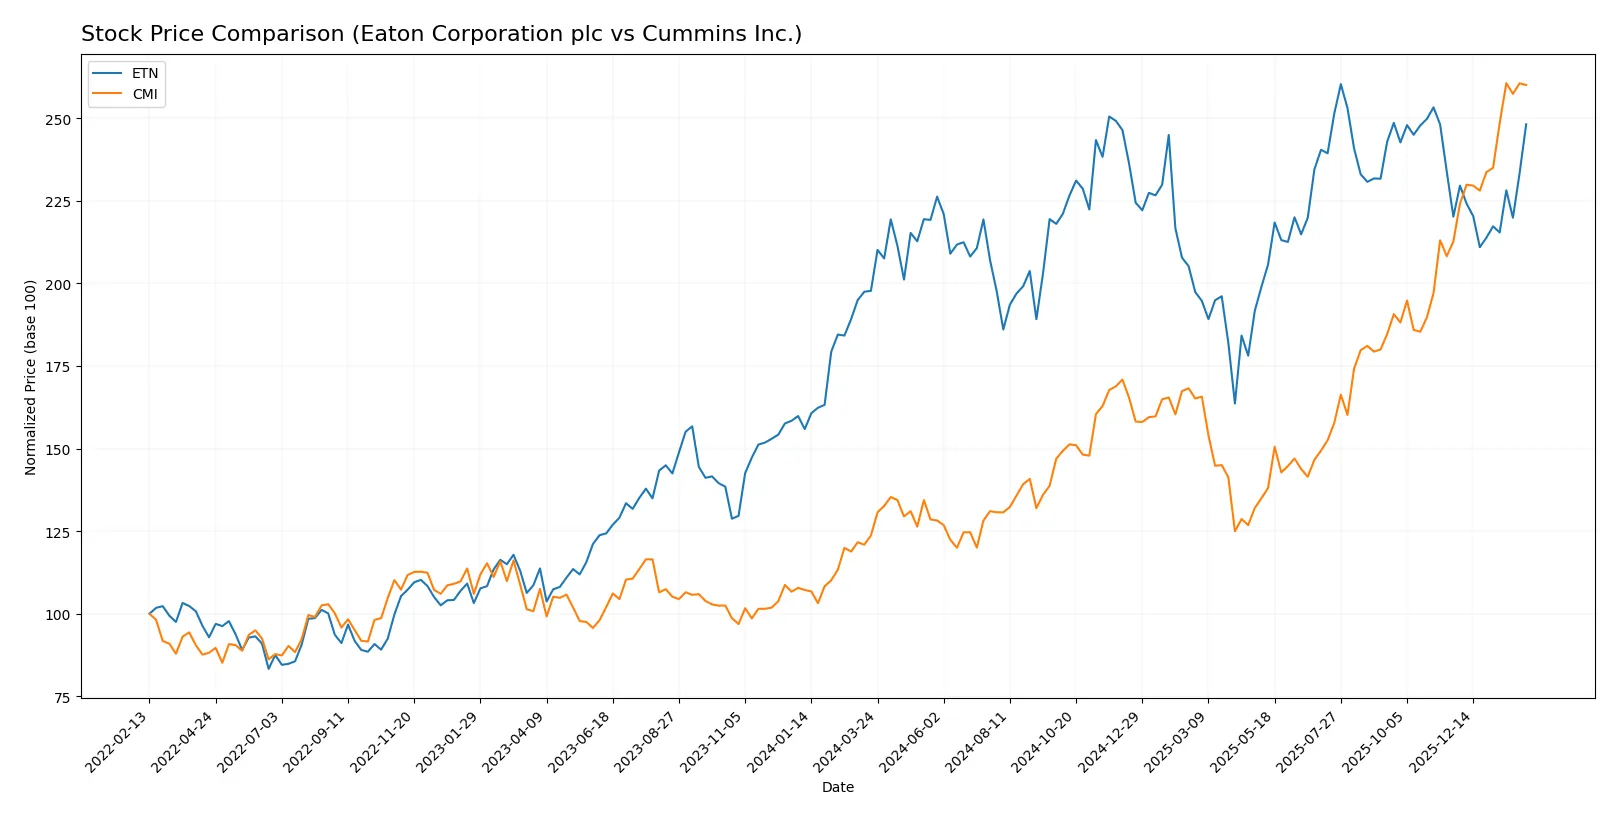
Trend Comparison
Eaton Corporation plc’s stock rose 25.49% over the past year, showing a bullish trend with accelerating gains. It reached a high of 392.17 and a low of 246.52, with moderate volatility (29.52 std deviation).
Cummins Inc.’s stock surged 110.21% in the same period, also bullish with accelerating momentum. It hit a high of 578.94 and a low of 266.48, accompanied by higher volatility (79.49 std deviation).
Cummins outperformed Eaton significantly, delivering the highest market return and stronger recent upward slope, despite Eaton’s increasing volume trend contrasting Cummins’ declining volumes.
Target Prices
Analysts present a bullish consensus for Eaton Corporation plc and Cummins Inc., indicating upside potential from current prices.
| Company | Target Low | Target High | Consensus |
|---|---|---|---|
| Eaton Corporation plc | 295 | 495 | 394 |
| Cummins Inc. | 540 | 703 | 606 |
Eaton’s target consensus at $394 suggests a modest premium to its $374 price, reflecting steady growth expectations. Cummins shows stronger upside, with a $606 consensus well above its $578 price, signaling robust confidence in its industrial positioning.

Don’t Let Luck Decide Your Entry Point
Optimize your entry points with our advanced ProRealTime indicators. You’ll get efficient buy signals with precise price targets for maximum performance. Start outperforming now!
How do institutions grade them?
This section compares the latest institutional grades for Eaton Corporation plc and Cummins Inc.:
Eaton Corporation plc Grades
Below is a summary of recent grades issued by major financial institutions for Eaton Corporation plc.
| Grading Company | Action | New Grade | Date |
|---|---|---|---|
| Wells Fargo | Maintain | Equal Weight | 2026-02-04 |
| JP Morgan | Maintain | Overweight | 2026-01-16 |
| HSBC | Upgrade | Buy | 2026-01-16 |
| Morgan Stanley | Maintain | Overweight | 2026-01-12 |
| Citigroup | Maintain | Buy | 2026-01-12 |
| Barclays | Maintain | Equal Weight | 2026-01-07 |
| UBS | Downgrade | Neutral | 2026-01-05 |
| Wells Fargo | Maintain | Equal Weight | 2025-12-18 |
| Wolfe Research | Upgrade | Outperform | 2025-12-09 |
| JP Morgan | Maintain | Overweight | 2025-11-06 |
Cummins Inc. Grades
Below is a summary of recent grades issued by major financial institutions for Cummins Inc.
| Grading Company | Action | New Grade | Date |
|---|---|---|---|
| Truist Securities | Maintain | Buy | 2026-02-06 |
| Wolfe Research | Downgrade | Peer Perform | 2026-01-26 |
| Barclays | Maintain | Overweight | 2026-01-23 |
| Wells Fargo | Maintain | Overweight | 2026-01-23 |
| JP Morgan | Maintain | Neutral | 2026-01-14 |
| Citigroup | Maintain | Buy | 2026-01-13 |
| Raymond James | Upgrade | Outperform | 2025-12-22 |
| Barclays | Upgrade | Overweight | 2025-12-19 |
| Truist Securities | Maintain | Buy | 2025-12-18 |
| Citigroup | Maintain | Buy | 2025-12-11 |
Which company has the best grades?
Both companies receive strong institutional support, but Eaton shows more upgrades to “Buy” and “Outperform.” Cummins carries some downgrades and a more mixed consensus. Investors may interpret Eaton’s grades as a signal of greater near-term confidence.
Risks specific to each company
The following categories identify the critical pressure points and systemic threats facing both Eaton Corporation plc and Cummins Inc. in the 2026 market environment:
1. Market & Competition
Eaton Corporation plc
- Faces intense competition in diversified power management and aerospace sectors, requiring constant innovation.
Cummins Inc.
- Competes in diesel, natural gas engines, and new power tech, challenged by shifts to electrification and emission standards.
2. Capital Structure & Debt
Eaton Corporation plc
- Maintains moderate debt-to-equity at 0.54, with strong interest coverage of 19.5x, signaling manageable leverage.
Cummins Inc.
- Slightly higher debt-to-equity ratio at 0.59, interest coverage at 13.05x, still within prudent limits but with less cushion.
3. Stock Volatility
Eaton Corporation plc
- Beta of 1.18 indicates moderately higher volatility than market, reflecting sensitivity to cyclical industrial demand.
Cummins Inc.
- Beta of 1.12 suggests slightly lower volatility, benefiting from diversified segments including power generation.
4. Regulatory & Legal
Eaton Corporation plc
- Subject to stringent aerospace and electrical product regulations, with compliance impacting costs and timelines.
Cummins Inc.
- Faces evolving emissions regulations impacting engine design, creating pressure to accelerate clean energy transitions.
5. Supply Chain & Operations
Eaton Corporation plc
- Global supply chain complexity in electrical and vehicle segments exposes it to component shortages and cost inflation.
Cummins Inc.
- Supply chain vulnerabilities in engine parts and new power components, with operational risks from global manufacturing footprint.
6. ESG & Climate Transition
Eaton Corporation plc
- Invests in eMobility and power quality solutions, but must accelerate climate adaptation to meet investor expectations.
Cummins Inc.
- Aggressively pursuing electrification and hydrogen technology, positioning as a clean tech leader but with high R&D costs.
7. Geopolitical Exposure
Eaton Corporation plc
- Irish-based global operations face risks from EU regulatory shifts and trade tensions affecting supply chains.
Cummins Inc.
- US-headquartered firm exposed to tariffs and geopolitical risks in key markets like China and emerging economies.
Which company shows a better risk-adjusted profile?
Eaton’s strongest risk is market competition across highly diversified segments requiring constant innovation. Cummins faces its biggest risk in regulatory pressure and the costly transition to clean energy powertrains. Eaton’s higher interest coverage and stable leverage favor its capital structure resilience. However, Cummins shows superior liquidity ratios, providing operational flexibility. Both have safe Altman Z-Scores, but Eaton’s slightly higher Piotroski score reflects steadier financial health. Recent market volatility underscores Eaton’s sensitivity, while Cummins’ commitment to electrification justifies its regulatory risks. Overall, Eaton edges ahead with a more balanced risk-adjusted profile, though investors must watch Cummins’ clean energy execution closely.
Final Verdict: Which stock to choose?
Eaton Corporation’s superpower lies in its robust and growing return on invested capital, signaling a durable competitive edge and efficient capital use. Its point of vigilance is the relatively high valuation multiples, which may temper near-term upside. Eaton suits investors seeking aggressive growth with a margin of quality.
Cummins stands out with a strategic moat rooted in its solid recurring revenue streams and strong balance sheet liquidity. Compared to Eaton, it offers better financial safety at a somewhat lower margin. Cummins fits well in a GARP portfolio focused on steady growth with reasonable risk.
If you prioritize sustained value creation and can tolerate premium valuation, Eaton outshines with clear evidence of increasing profitability and capital efficiency. However, if you seek a more conservative growth approach with enhanced balance sheet stability, Cummins offers better stability despite its slower ROIC trend. Both present viable scenarios depending on your risk appetite and growth expectations.
Disclaimer: Investment carries a risk of loss of initial capital. The past performance is not a reliable indicator of future results. Be sure to understand risks before making an investment decision.
Go Further
I encourage you to read the complete analyses of Eaton Corporation plc and Cummins Inc. to enhance your investment decisions: