Home > Comparison > Industrials > CMI vs DOV
The strategic rivalry between Cummins Inc. and Dover Corporation shapes the Industrials sector’s machinery landscape. Cummins, a global engine manufacturer, focuses on powertrain innovation and emission solutions. Dover operates as a diversified machinery provider with strengths in engineered products and clean energy components. This analysis contrasts their operational models and growth trajectories to identify which offers a superior risk-adjusted return for diversified investors navigating industrial market cycles.

Table of contents
Companies Overview
Cummins Inc. and Dover Corporation stand as key industrial machinery players shaping global markets with diverse industrial solutions.
Cummins Inc.: Powertrain and Engine Innovator
Cummins Inc. dominates the diesel and natural gas engine market through designing, manufacturing, and servicing engines and powertrains globally. Its revenue stems from engines, power systems, and components catering to multiple heavy industries. In 2026, Cummins focuses strategically on electrified power systems and emission solutions, signaling a pivot toward sustainable energy technologies.
Dover Corporation: Industrial Equipment and Solutions Provider
Dover Corporation specializes in diversified industrial equipment and aftermarket services across sectors like fuel transport, automation, and climate technologies. Its revenue engine relies on components, consumables, and digital solutions supporting various end-markets. Dover’s 2026 strategy emphasizes expanding clean energy infrastructure and precision industrial automation to capture emerging market demands.
Strategic Collision: Similarities & Divergences
Both companies share a core in industrial machinery but diverge sharply in approach. Cummins emphasizes closed ecosystem powertrain technology with a push into electrification, while Dover operates an open infrastructure model spanning multiple industrial niches. Their battleground centers on clean energy and automation technologies, where Cummins targets powertrain electrification and Dover bets on modular industrial solutions. This distinction frames their unique investment profiles in 2026’s evolving industrial landscape.
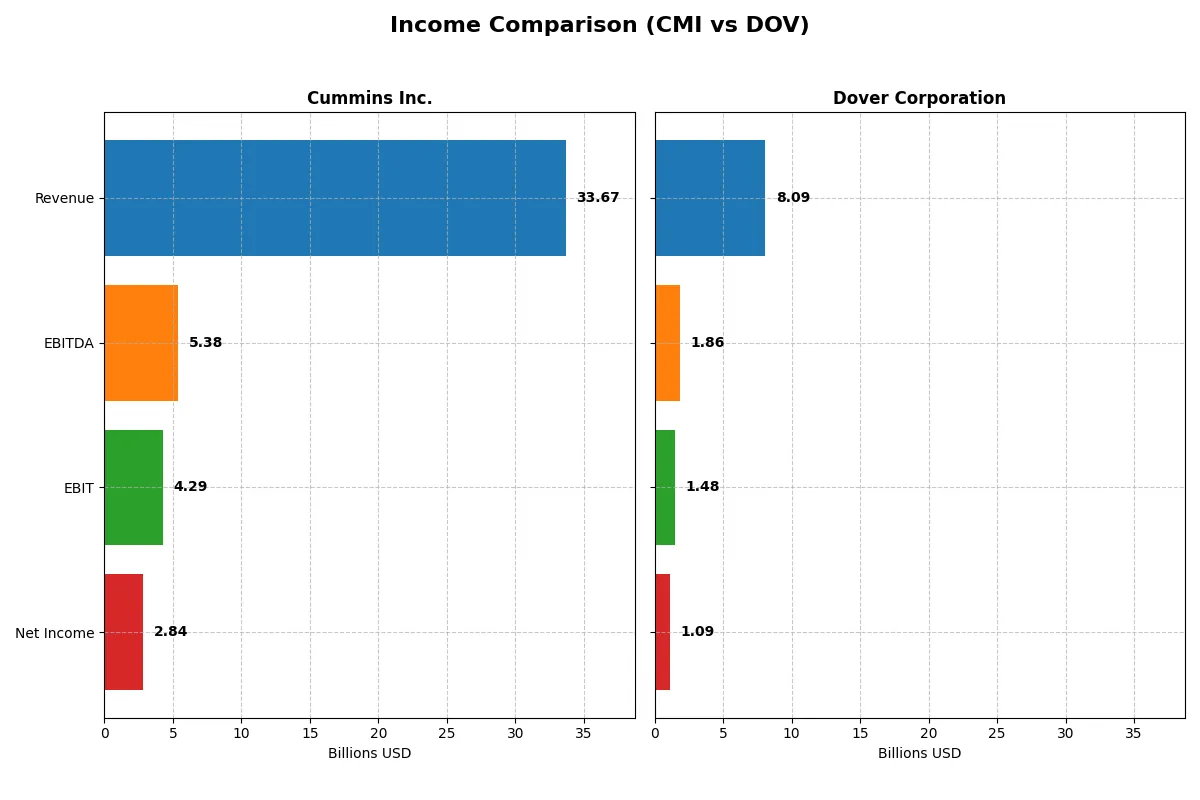
Income Statement Comparison
This data dissects the core profitability and scalability of both corporate engines to reveal who dominates the bottom line:
| Metric | Cummins Inc. (CMI) | Dover Corporation (DOV) |
|---|---|---|
| Revenue | 33.7B | 8.1B |
| Cost of Revenue | 25.2B | 4.9B |
| Operating Expenses | 4.5B | 1.8B |
| Gross Profit | 8.5B | 3.2B |
| EBITDA | 5.4B | 1.9B |
| EBIT | 4.3B | 1.5B |
| Interest Expense | 329M | 110M |
| Net Income | 2.8B | 1.1B |
| EPS | 20.62 | 7.97 |
| Fiscal Year | 2025 | 2025 |
Income Statement Analysis: The Bottom-Line Duel
This income statement comparison reveals the true efficiency and profitability of two industrial giants over recent years.
Cummins Inc. Analysis
Cummins shows a 40% revenue growth from 2021 to 2025, with net income up 33%. Its gross margin remains steady around 25%, while net margin holds a favorable 8.4%. Despite a slight revenue dip in 2025, Cummins sustains operational efficiency, reflected in solid EBITDA and EBIT margins, though net income dipped by 27% in the last year, signaling some short-term pressure.
Dover Corporation Analysis
Dover posts a modest 2.4% revenue gain over five years, with net income declining by 2.7%. It boasts a strong 39.8% gross margin and a healthy 13.5% net margin, outperforming Cummins on profitability ratios. However, Dover’s net margin contracted sharply by 61% in 2025, and EBIT fell over 20%, indicating margin compression despite revenue growth of 4.5% that year.
Verdict: Margin Strength vs. Growth Resilience
Cummins delivers robust long-term revenue and net income growth but faces recent margin pressures. Dover excels in gross and net margin levels but struggles with declining net income and volatile profits. For investors, Cummins’ growth and margin stability may offer a more attractive profile than Dover’s margin strength tempered by uneven earnings momentum.
Financial Ratios Comparison
These vital ratios act as a diagnostic tool to expose the underlying fiscal health, valuation premiums, and capital efficiency of the companies compared below:
| Ratios | Cummins Inc. (CMI) | Dover Corporation (DOV) |
|---|---|---|
| ROE | 23.0% | 14.8% |
| ROIC | 12.0% | 9.4% |
| P/E | 24.8 | 24.5 |
| P/B | 5.7 | 3.6 |
| Current Ratio | 1.76 | 1.79 |
| Quick Ratio | 1.16 | 1.28 |
| D/E | 0.59 | 0.45 |
| Debt-to-Assets | 21.3% | 24.8% |
| Interest Coverage | 12.1x | 12.5x |
| Asset Turnover | 0.99 | 0.60 |
| Fixed Asset Turnover | 4.84 | 7.23 |
| Payout Ratio | 37.1% | 25.9% |
| Dividend Yield | 1.50% | 1.06% |
| Fiscal Year | 2025 | 2025 |
Efficiency & Valuation Duel: The Vital Signs
Financial ratios act as a company’s DNA, exposing hidden risks and revealing operational excellence beneath the surface.
Cummins Inc.
Cummins delivers strong profitability with a 23.02% ROE and a solid 8.44% net margin, reflecting efficient capital use. Its P/E of 24.76 signals a fairly valued stock, though a high 5.7 PB ratio raises caution. Cummins balances shareholder returns with a modest 1.5% dividend, reinvesting heavily in R&D to fuel growth.
Dover Corporation
Dover posts a higher net margin at 13.52% but a more moderate 14.77% ROE, indicating solid profitability with less leverage. The P/E ratio of 24.49 suggests fair valuation, supported by a lower PB of 3.62. Dover maintains shareholder value through a 1.06% dividend yield, focusing on steady cash flow and operational efficiency.
Balanced Profitability vs. Valuation Discipline
Both companies show slightly favorable financial profiles with equal proportions of favorable ratios. Cummins exhibits superior return on equity and reinvestment for growth, while Dover offers higher margins and tighter valuation multiples. Investors seeking growth through capital efficiency may prefer Cummins; those favoring margin stability and valuation discipline might lean toward Dover.
Which one offers the Superior Shareholder Reward?
I compare Cummins Inc. (CMI) and Dover Corporation (DOV) on dividends and buybacks. Cummins yields 1.5% with a 37% payout ratio, distributing ~7.65/share, backed by strong free cash flow coverage (1.58x). Dover yields less at 1.06%, with a 26% payout ratio and 2.06/share dividends, but it boasts a more robust buyback program enhancing total returns. Cummins pays higher dividends but at a higher payout risk, while Dover balances modest dividends with aggressive buybacks funded by superior operating margins and free cash flow conversion. For 2026, I find Dover’s shareholder reward model more sustainable and superior due to its capital allocation discipline and total return focus.
Comparative Score Analysis: The Strategic Profile
The radar chart reveals the fundamental DNA and trade-offs of Cummins Inc. and Dover Corporation, highlighting their strategic financial positioning:
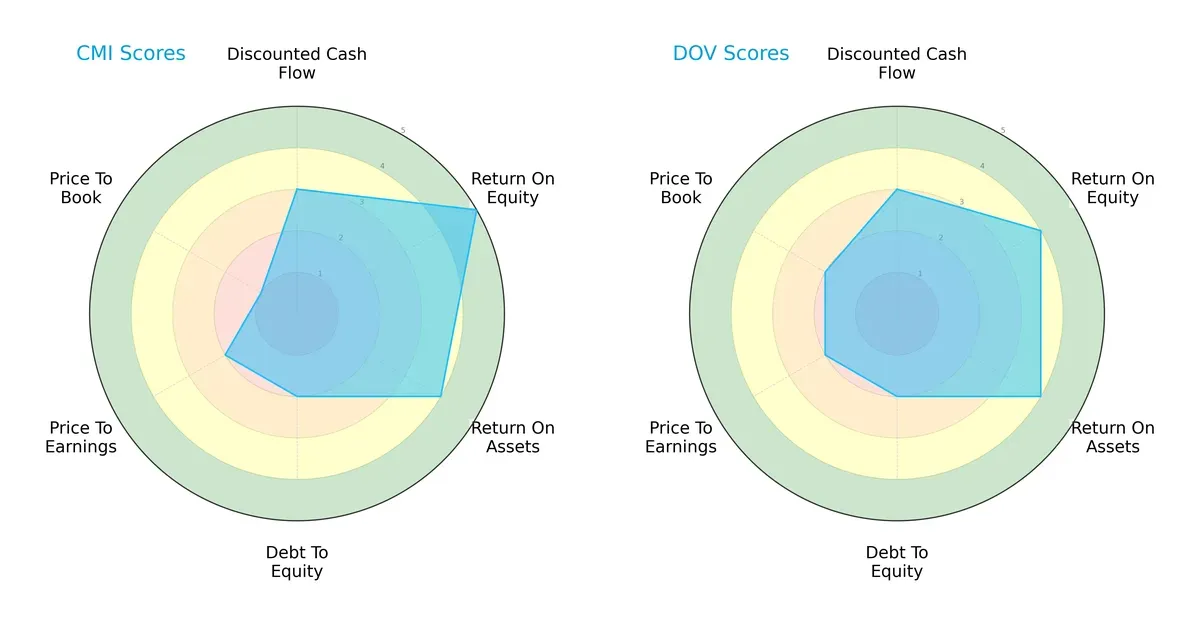
Cummins excels in Return on Equity with a top score of 5, showing superior profit generation from equity. Dover holds steady with balanced ROE and ROA scores, each at 4, indicating consistent asset utilization. Both firms share moderate DCF scores of 3 and face similar debt challenges with Debt/Equity scores of 2. Cummins’ valuation metrics lag, especially its Price-to-Book score of 1, reflecting potential market skepticism. Dover presents a more balanced valuation profile with scores closer to parity. Overall, Dover’s profile appears steadier, while Cummins leverages its profitability edge more heavily.
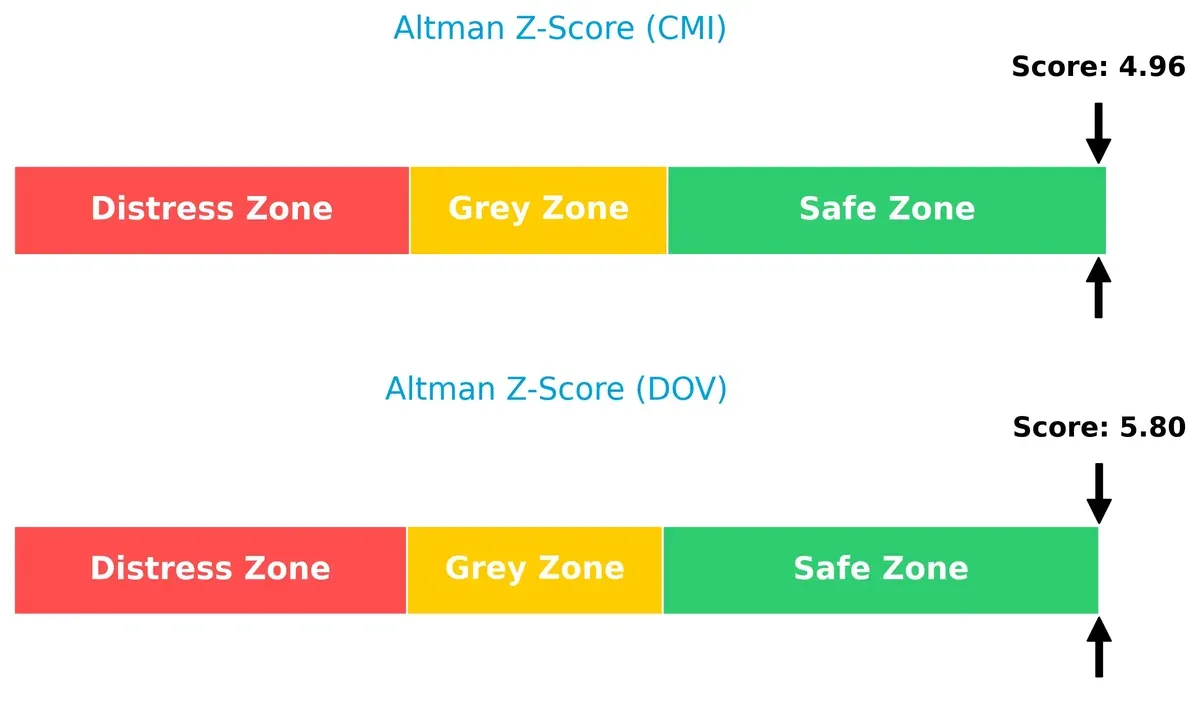
Bankruptcy Risk: Solvency Showdown
The Altman Z-Score gap favors Dover, scoring 5.8 versus Cummins’ 5.0, both comfortably in the safe zone, signaling solid long-term solvency for both companies in this cycle:
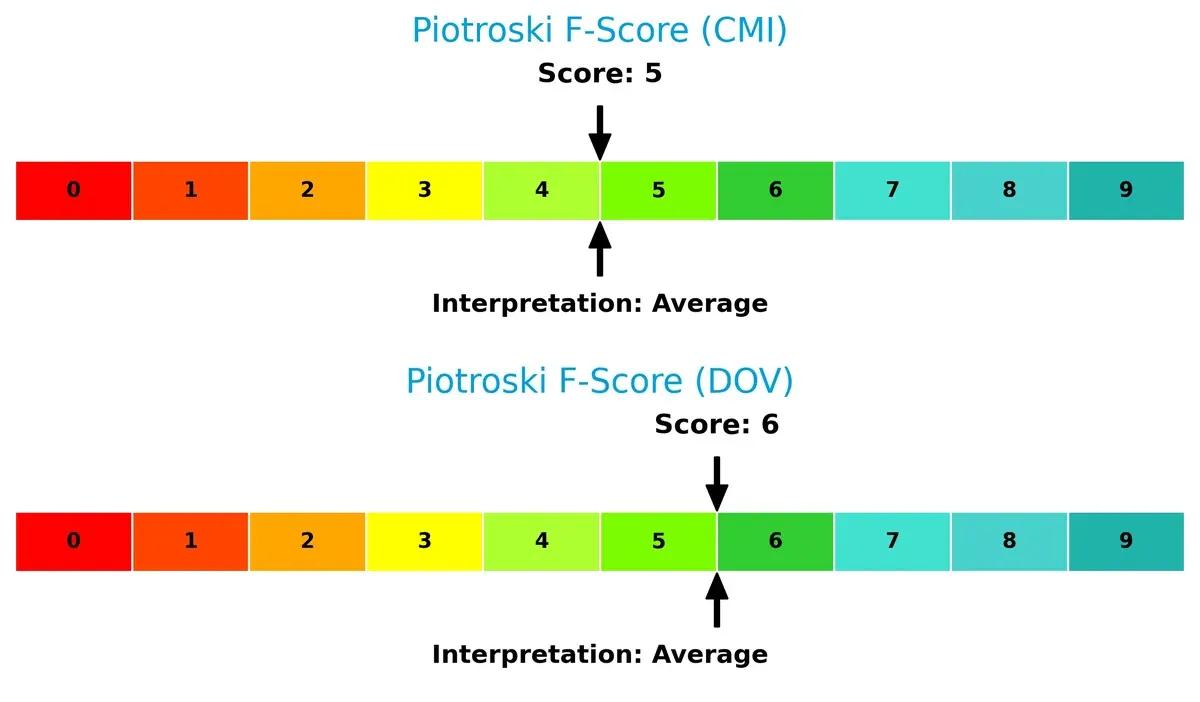
Financial Health: Quality of Operations
Piotroski F-Scores show Dover slightly ahead at 6 versus Cummins’ 5, indicating Dover’s internal metrics reflect marginally stronger operational health without red flags:
How are the two companies positioned?
This section dissects the operational DNA of Cummins and Dover by comparing their revenue distribution and internal dynamics. The goal is to confront their economic moats and identify which model offers the most resilient competitive advantage today.
Revenue Segmentation: The Strategic Mix
This comparison dissects how Cummins Inc. and Dover Corporation diversify income streams and reveals their primary sector bets:
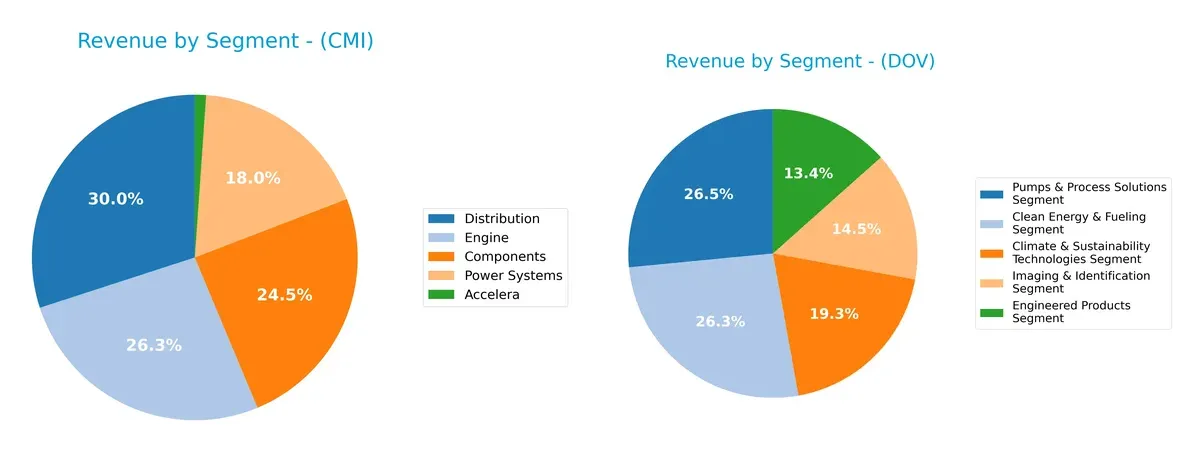
Cummins anchors revenue in Distribution ($12.4B) and Engine ($10.9B), with solid Power Systems ($7.5B), showing moderate diversification. Dover pivots evenly across five segments, each near $1.1B–2.1B, evidencing a balanced portfolio. Cummins’ reliance on heavy equipment segments signals infrastructure dominance but concentration risk. Dover’s spread reduces volatility and bets on growth in Clean Energy and Process Solutions, highlighting a strategic push toward sustainability and industrial diversification.
Strengths and Weaknesses Comparison
This table compares the strengths and weaknesses of Cummins Inc. and Dover Corporation based on key financial and operational criteria:
Cummins Inc. Strengths
- Strong ROE at 23.02% indicating superior profitability
- Favorable ROIC at 12.01% above WACC supports capital efficiency
- Solid current and quick ratios show good liquidity
- Diversified revenue streams across components, distribution, engine, and power systems
- Significant U.S. and non-U.S. revenue with strong global presence
Dover Corporation Strengths
- Higher net margin at 13.52% reflects strong profitability
- Favorable debt-to-equity and interest coverage enhance financial stability
- Diversified segments including clean energy and engineered products
- Robust fixed asset turnover at 7.23 indicates efficient asset use
- Strong U.S. revenue base complemented by growing Europe and Asia sales
Cummins Inc. Weaknesses
- High price-to-book ratio at 5.7 may indicate overvaluation
- Neutral asset turnover suggests moderate operational efficiency
- Lower net margin at 8.44% compared to peer
- Moderate debt-to-equity ratio of 0.59 limits leverage advantage
Dover Corporation Weaknesses
- Lower ROE at 14.77% and ROIC at 9.45% suggest less efficient capital use
- Price-to-book at 3.62 also unfavorable, possibly overvalued
- Asset turnover of 0.6 is relatively low, indicating weaker sales productivity
- Dividend yield slightly lower at 1.06%
Both companies display solid diversification and favorable liquidity ratios, contributing to stable operations. Cummins excels in capital returns, while Dover shows stronger net profitability and asset efficiency. Each faces valuation concerns and operational challenges that could influence their strategic approaches.
The Moat Duel: Analyzing Competitive Defensibility
A structural moat is the only thing protecting long-term profits from the erosion of competition. Let’s dissect how these two industrial giants defend their turf:
Cummins Inc.: Intangible Assets and Technological Expertise
Cummins’ moat stems from proprietary engine technologies and emission solutions. Its high ROIC above WACC signals strong value creation, despite a slight decline in profitability. New powertrain innovations in electrification could deepen this moat in 2026.
Dover Corporation: Diversification and Cost Advantage
Dover leverages broad industrial diversification and operational scale for cost advantages. However, its ROIC barely exceeds WACC and declines sharply, reflecting weakening profitability. Expansion into clean energy segments offers upside but also execution risk.
Innovation Edge vs. Scale Efficiency: The Moat Showdown
Cummins holds the deeper moat with a clear value-creating ROIC and strong intangible assets. Dover’s scale offers breadth but its shrinking returns warn of vulnerability. Cummins is better positioned to defend market share amid rising technological demands.
Which stock offers better returns?
The past year saw Cummins Inc. and Dover Corporation both advance, with Cummins doubling its share price while Dover posted solid gains amid varying trading volumes and buyer dominance.
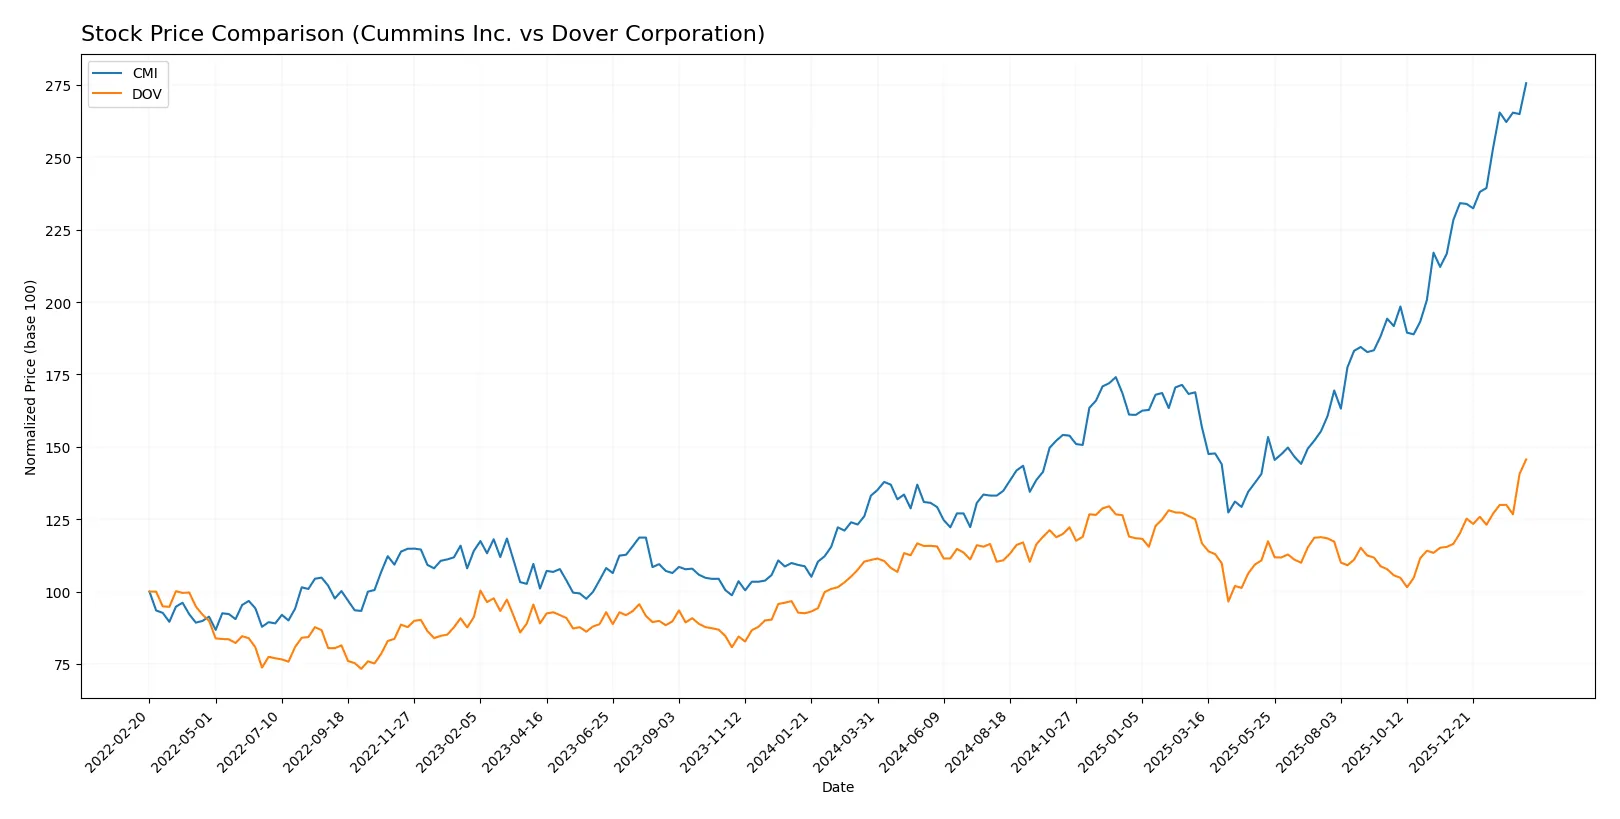
Trend Comparison
Cummins Inc. shows a strong bullish trend with a 107.0% price increase over 12 months. The trend accelerates, hitting a high of 601.01 and a low of 266.48, despite high volatility (std dev 82.55).
Dover Corporation also trends bullish with a 31.3% gain over the same period. Its acceleration is steady, with lower volatility (std dev 12.76) and prices ranging between 153.55 and 231.63.
Cummins outperformed Dover significantly, delivering the highest market returns and greater price acceleration over the past year.
Target Prices
Analysts present a moderately bullish consensus for Cummins Inc. and Dover Corporation.
| Company | Target Low | Target High | Consensus |
|---|---|---|---|
| Cummins Inc. | 540 | 703 | 618.4 |
| Dover Corporation | 195 | 256 | 223.7 |
Cummins trades near its consensus target, suggesting balanced upside potential. Dover’s target consensus implies a modest 4% increase from current levels, reflecting cautious optimism.

Don’t Let Luck Decide Your Entry Point
Optimize your entry points with our advanced ProRealTime indicators. You’ll get efficient buy signals with precise price targets for maximum performance. Start outperforming now!
How do institutions grade them?
Cummins Inc. Grades
The following table summarizes recent institutional grades for Cummins Inc.:
| Grading Company | Action | New Grade | Date |
|---|---|---|---|
| Raymond James | Maintain | Outperform | 2026-02-09 |
| Truist Securities | Maintain | Buy | 2026-02-06 |
| Wolfe Research | Downgrade | Peer Perform | 2026-01-26 |
| Barclays | Maintain | Overweight | 2026-01-23 |
| Wells Fargo | Maintain | Overweight | 2026-01-23 |
| JP Morgan | Maintain | Neutral | 2026-01-14 |
| Citigroup | Maintain | Buy | 2026-01-13 |
| Raymond James | Upgrade | Outperform | 2025-12-22 |
| Barclays | Upgrade | Overweight | 2025-12-19 |
| Truist Securities | Maintain | Buy | 2025-12-18 |
Dover Corporation Grades
The following table summarizes recent institutional grades for Dover Corporation:
| Grading Company | Action | New Grade | Date |
|---|---|---|---|
| JP Morgan | Maintain | Overweight | 2026-01-30 |
| Wells Fargo | Maintain | Equal Weight | 2026-01-30 |
| RBC Capital | Maintain | Sector Perform | 2026-01-30 |
| Oppenheimer | Maintain | Outperform | 2026-01-26 |
| JP Morgan | Maintain | Overweight | 2026-01-16 |
| Barclays | Maintain | Equal Weight | 2026-01-07 |
| Wells Fargo | Maintain | Equal Weight | 2026-01-07 |
| UBS | Upgrade | Buy | 2026-01-05 |
| Wells Fargo | Maintain | Equal Weight | 2025-12-15 |
| Oppenheimer | Maintain | Outperform | 2025-11-14 |
Which company has the best grades?
Cummins Inc. generally receives stronger grades, including multiple “Buy” and “Outperform” ratings. Dover’s grades cluster around “Equal Weight” and “Outperform.” Investors might view Cummins as having slightly more bullish institutional sentiment.
Risks specific to each company
The following categories identify critical pressure points and systemic threats facing Cummins Inc. and Dover Corporation in the 2026 market environment:
1. Market & Competition
Cummins Inc.
- Faces intense competition in diesel and electrified powertrain markets, pressured by rapid tech shifts and emission standards.
Dover Corporation
- Competes across diverse industrial segments, with exposure to niche markets but risks from evolving clean energy demands.
2. Capital Structure & Debt
Cummins Inc.
- Moderate leverage with debt-to-equity at 0.59; interest coverage strong at 13.05, signaling manageable debt risk.
Dover Corporation
- Lower leverage at 0.45 and higher interest coverage at 13.52; structurally sound but still exposed to rising rates.
3. Stock Volatility
Cummins Inc.
- Beta of 1.12 suggests slightly above-market volatility; price range wide (260–618), reflecting cyclical industrial sector swings.
Dover Corporation
- Higher beta at 1.29 indicates more sensitivity to market moves; trading range (143–238) also reveals notable price fluctuations.
4. Regulatory & Legal
Cummins Inc.
- Heavily impacted by emissions regulations and environmental policies globally, which could drive compliance costs.
Dover Corporation
- Faces regulatory scrutiny in clean energy and industrial automation sectors; legal exposures tied to product standards and safety.
5. Supply Chain & Operations
Cummins Inc.
- Large global supply chain vulnerable to disruptions; reliance on raw materials for engine components adds risk.
Dover Corporation
- Diverse operations with multiple segments may mitigate supply chain risks but increase complexity and operational challenges.
6. ESG & Climate Transition
Cummins Inc.
- Transitioning aggressively to electrified powertrains and hydrogen tech; ESG compliance crucial to maintain market access.
Dover Corporation
- Focus on refrigeration and clean energy solutions positions it well, but operational footprint and emissions remain concerns.
7. Geopolitical Exposure
Cummins Inc.
- Significant exposure to global trade tensions, especially US-China relations impacting supply and sales.
Dover Corporation
- Also exposed internationally but with less direct dependency on specific markets; geopolitical risks remain moderate.
Which company shows a better risk-adjusted profile?
Cummins faces its biggest risk from regulatory and technological disruption in engine markets. Dover’s main risk lies in managing diverse operations amid evolving clean energy regulations. Both show solid capital structures and safe financial scores. However, Dover’s higher stock volatility and broader segment complexity slightly increase its risk profile. Cummins’ focused transition to electrification and stronger interest coverage provide a marginally better risk-adjusted position. Recent data confirms Cummins’ favorable ROE of 23% versus Dover’s 15%, underlining its operational efficiency despite sector headwinds.
Final Verdict: Which stock to choose?
Cummins Inc. (CMI) stands out as a powerhouse of capital efficiency, consistently creating value with a ROIC well above its cost of capital. Its slight decline in profitability signals a need for vigilance, but it remains attractive for investors targeting aggressive growth and operational excellence in industrial engines.
Dover Corporation (DOV) leverages a strategic moat rooted in diversified industrial segments and strong asset turnover, offering a safer profile with steady cash flow stability. While its profitability lags behind Cummins, Dover suits investors seeking growth at a reasonable price with moderate risk exposure.
If you prioritize capital efficiency and value creation with growth potential, Cummins outshines as the compelling choice due to its superior ROIC and operational leverage. However, if you seek better stability and a diversified industrial play with less volatility, Dover offers a more balanced risk-return profile. Both scenarios warrant careful monitoring of their profitability trends and valuation premiums.
Disclaimer: Investment carries a risk of loss of initial capital. The past performance is not a reliable indicator of future results. Be sure to understand risks before making an investment decision.
Go Further
I encourage you to read the complete analyses of Cummins Inc. and Dover Corporation to enhance your investment decisions: