Home > Comparison > Industrials > UNP vs CSX
The strategic rivalry between Union Pacific Corporation and CSX Corporation shapes the U.S. railroads sector’s future. Union Pacific operates a vast, capital-intensive rail network spanning the western U.S., while CSX focuses on a dense, efficient eastern network with strong intermodal services. This analysis pits scale and legacy infrastructure against operational agility. I aim to identify which company offers superior risk-adjusted returns for diversified portfolios amid evolving industrial and logistics trends.
Table of contents
Companies Overview
Union Pacific and CSX stand as pivotal railroads shaping freight transport across the United States.
Union Pacific Corporation: Transcontinental Freight Powerhouse
Union Pacific dominates with a sprawling 32,452-mile rail network connecting Pacific and Gulf Coast ports to the Midwest and East. Its revenue springs from transporting diverse commodities including agricultural products, chemicals, and finished automobiles. In 2026, Union Pacific sharpens its strategic focus on sustaining network efficiency and expanding intermodal container services to capitalize on global trade flows.
CSX Corporation: Eastern U.S. Intermodal Specialist
CSX operates roughly 19,500 route miles primarily east of the Mississippi, offering rail-based freight and intermodal transportation services. It generates core revenue through moving chemicals, metals, automotive goods, and coal, supported by a strong drayage network. Its 2026 strategy centers on enhancing terminal operations and intermodal connectivity to boost service reliability and customer reach in key eastern markets.
Strategic Collision: Similarities & Divergences
Both firms leverage extensive rail networks to serve diverse industrial sectors but diverge in geographic dominance—Union Pacific’s western transcontinental scope contrasts with CSX’s eastern regional focus. They compete fiercely in intermodal freight, battling for market share in containerized goods transport. Union Pacific’s broad coast-to-coast infrastructure offers scale, while CSX’s nimble terminal operations emphasize agility, defining distinct investment profiles for growth and stability.
Income Statement Comparison
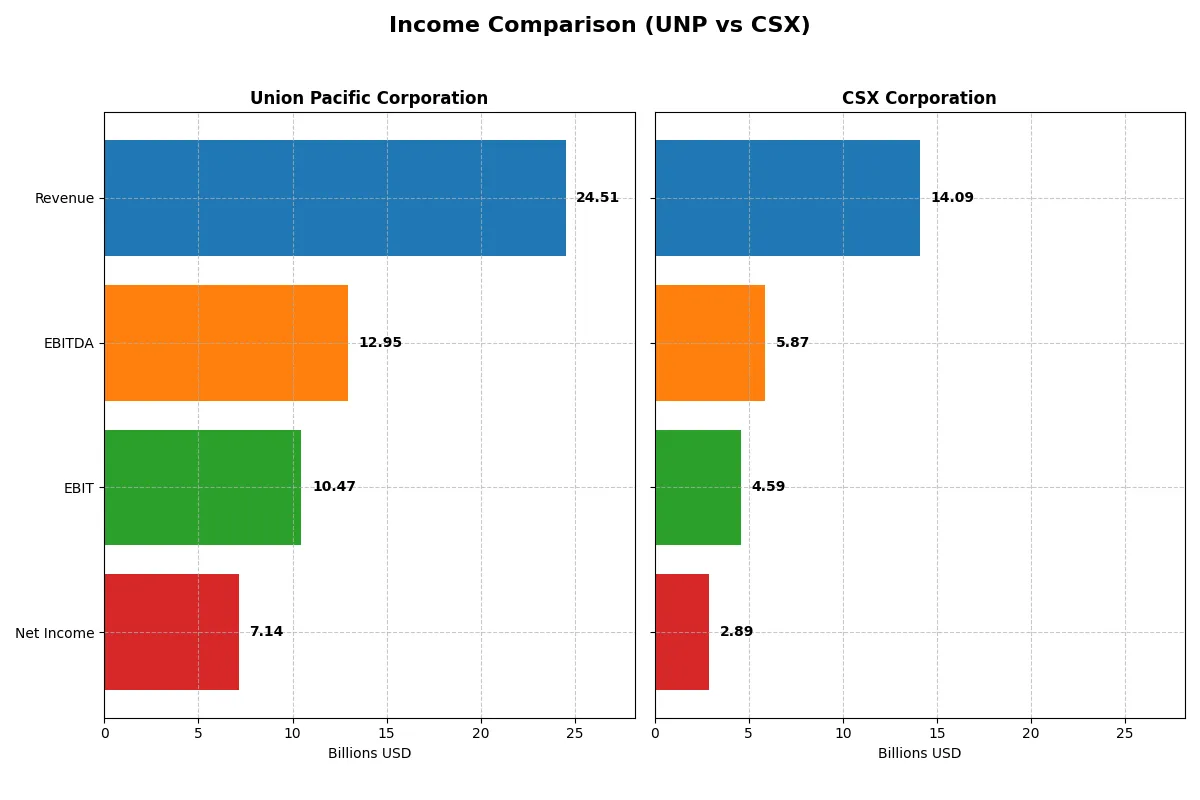
This data dissects the core profitability and scalability of both corporate engines to reveal who dominates the bottom line:
| Metric | Union Pacific Corporation (UNP) | CSX Corporation (CSX) |
|---|---|---|
| Revenue | 24.5B | 14.1B |
| Cost of Revenue | 9.96B | 9.41B |
| Operating Expenses | 4.71B | 164M |
| Gross Profit | 14.6B | 4.69B |
| EBITDA | 12.9B | 5.87B |
| EBIT | 10.5B | 4.59B |
| Interest Expense | 1.31B | 844M |
| Net Income | 7.14B | 2.89B |
| EPS | 12.01 | 1.54 |
| Fiscal Year | 2025 | 2025 |
Income Statement Analysis: The Bottom-Line Duel
This income statement comparison exposes the true efficiency and profitability engines driving each company’s financial health.
Union Pacific Corporation Analysis
Union Pacific’s revenue grew modestly to 24.5B in 2025, with net income rising to 7.1B. The firm maintains strong margins: a gross margin near 59% and a net margin exceeding 29%, signaling robust profitability. Momentum builds as EPS grows nearly 8% year-over-year, reflecting efficient cost control despite flat revenue growth.
CSX Corporation Analysis
CSX recorded declining revenue, down 3% to 14.1B in 2025, with net income contracting to 2.9B. Margins remain fair but weaker: gross margin at 33% and net margin at 20.5%. The company faces negative momentum, with all key profitability metrics including EPS showing double-digit declines year-over-year, indicating operational challenges.
Margin Strength vs. Earnings Momentum
Union Pacific delivers superior margin strength and consistent EPS growth, outperforming CSX’s shrinking revenue and deteriorating profitability. UNP’s financial efficiency and margin resilience make it the fundamental winner. Investors seeking stable earnings and margin power will find UNP’s profile more compelling in this competitive landscape.
Financial Ratios Comparison
These vital ratios act as a diagnostic tool to expose the underlying fiscal health, valuation premiums, and capital efficiency of these companies:
| Ratios | Union Pacific (UNP) | CSX Corporation (CSX) |
|---|---|---|
| ROE | 38.65% | 21.95% |
| ROIC | 11.70% | 0.39% |
| P/E | 19.20 | 23.39 |
| P/B | 7.42 | 5.13 |
| Current Ratio | 0.91 | 0.22 |
| Quick Ratio | 0.91 | 0.22 |
| D/E | 1.72 | 1.43 |
| Debt-to-Assets | 45.65% | 43.21% |
| Interest Coverage | 7.52 | 5.36 |
| Asset Turnover | 0.35 | 0.32 |
| Fixed Asset Turnover | 0.41 | 0 |
| Payout Ratio | 45.33% | 33.64% |
| Dividend Yield | 2.36% | 1.44% |
| Fiscal Year | 2025 | 2025 |
Efficiency & Valuation Duel: The Vital Signs
Financial ratios act as a company’s DNA, uncovering hidden risks and operational strengths that shape investor confidence and valuation.
Union Pacific Corporation
Union Pacific posts a robust 38.7% ROE and a strong 29.1% net margin, signaling exceptional profitability. Its P/E of 19.2 appears reasonable, though a high PB ratio of 7.42 suggests some valuation stretch. The company delivers a solid 2.36% dividend yield, rewarding shareholders steadily alongside efficient capital use.
CSX Corporation
CSX shows a respectable 21.9% ROE and 20.5% net margin, indicating solid but more moderate profitability. Its P/E at 23.4 is slightly higher, reflecting a pricier stock. Notably, CSX’s extraordinary 392% ROIC hints at unique capital efficiency, despite a low 1.44% dividend yield and weaker liquidity ratios, signaling higher risk.
Premium Valuation vs. Operational Safety
Union Pacific balances strong profitability with a reasonable valuation and reliable dividends, offering a measured risk profile. CSX’s exceptional ROIC contrasts with stretched liquidity and higher valuation, posing greater risk but potential operational upside. Investors seeking stable income and safety may prefer Union Pacific; those chasing high capital efficiency might lean toward CSX.
Which one offers the Superior Shareholder Reward?
I compare Union Pacific (UNP) and CSX’s (CSX) shareholder reward strategies through dividend yields, payout ratios, and buyback intensity. UNP offers a 2.36% dividend yield with a 45% payout ratio, well-covered by free cash flow. CSX yields 1.44% with a lighter 34% payout but retains more cash for growth. UNP’s share buybacks are aggressive and consistent, enhancing total returns. CSX’s buybacks are modest, reflecting cautious capital allocation. I see UNP’s balanced distribution, solid free cash flow coverage, and stronger buyback program as more sustainable and attractive for total returns in 2026.
Comparative Score Analysis: The Strategic Profile
The radar chart reveals the fundamental DNA and trade-offs of Union Pacific Corporation and CSX Corporation, highlighting their distinct financial strengths and weaknesses:
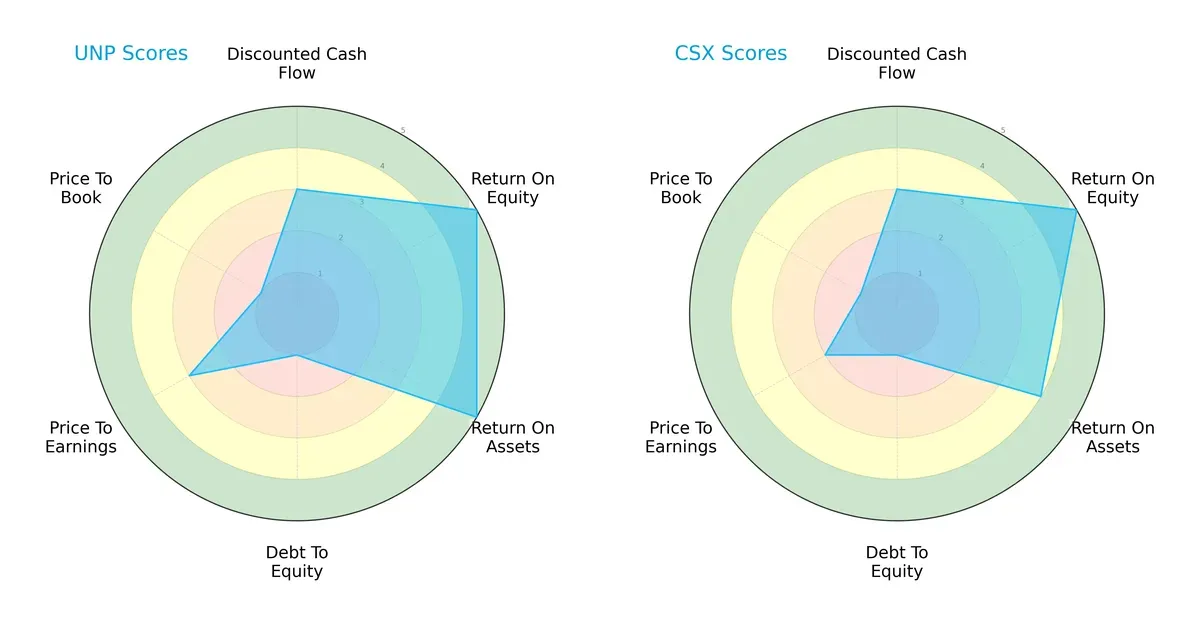
Union Pacific excels with top-tier ROE and ROA scores at 5, showing exceptional profit generation and asset utilization, whereas CSX posts a slightly lower ROA of 4. Both struggle equally with high debt levels (score 1), signaling financial risk. Union Pacific holds a moderate valuation edge with better P/E at 3, while CSX trails at 2. Overall, Union Pacific presents a more balanced and robust profile, relying on operational efficiency, while CSX depends more on valuation appeal.
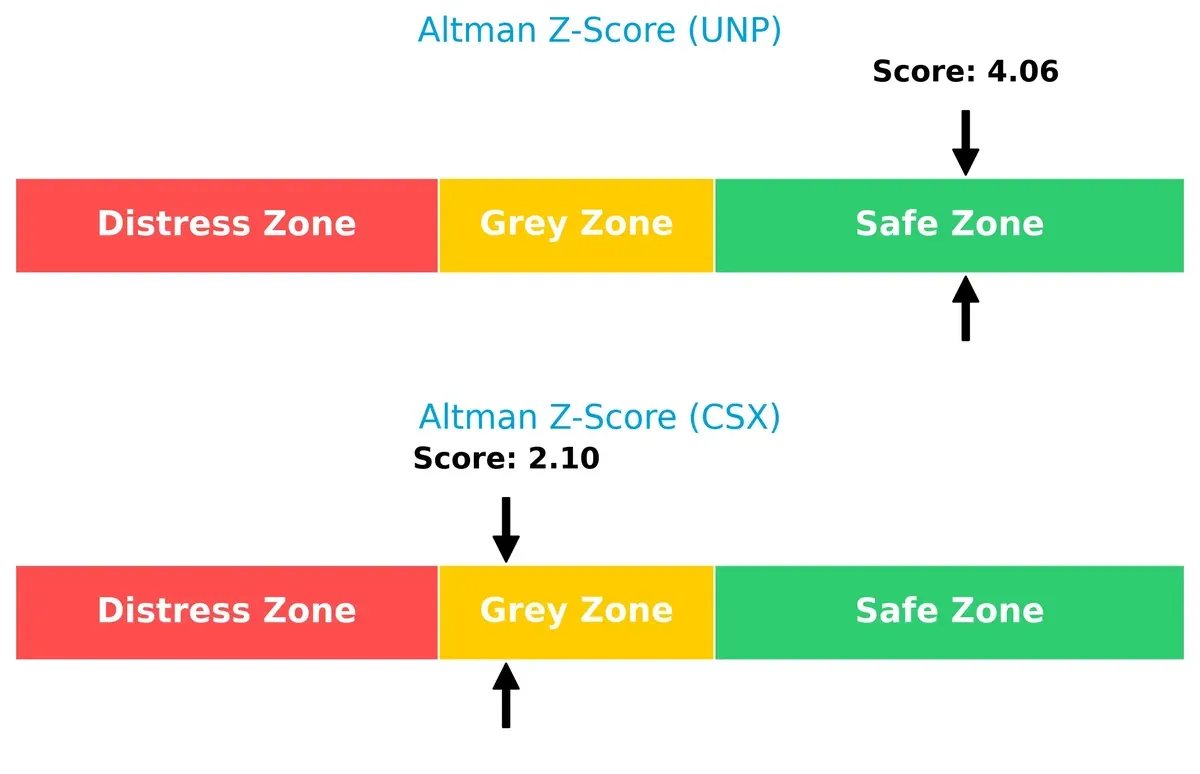
Bankruptcy Risk: Solvency Showdown
Union Pacific’s Altman Z-Score of 4.06 places it firmly in the safe zone, indicating strong financial resilience. CSX’s 2.10 score lands in the grey zone, signaling moderate bankruptcy risk in this cycle:
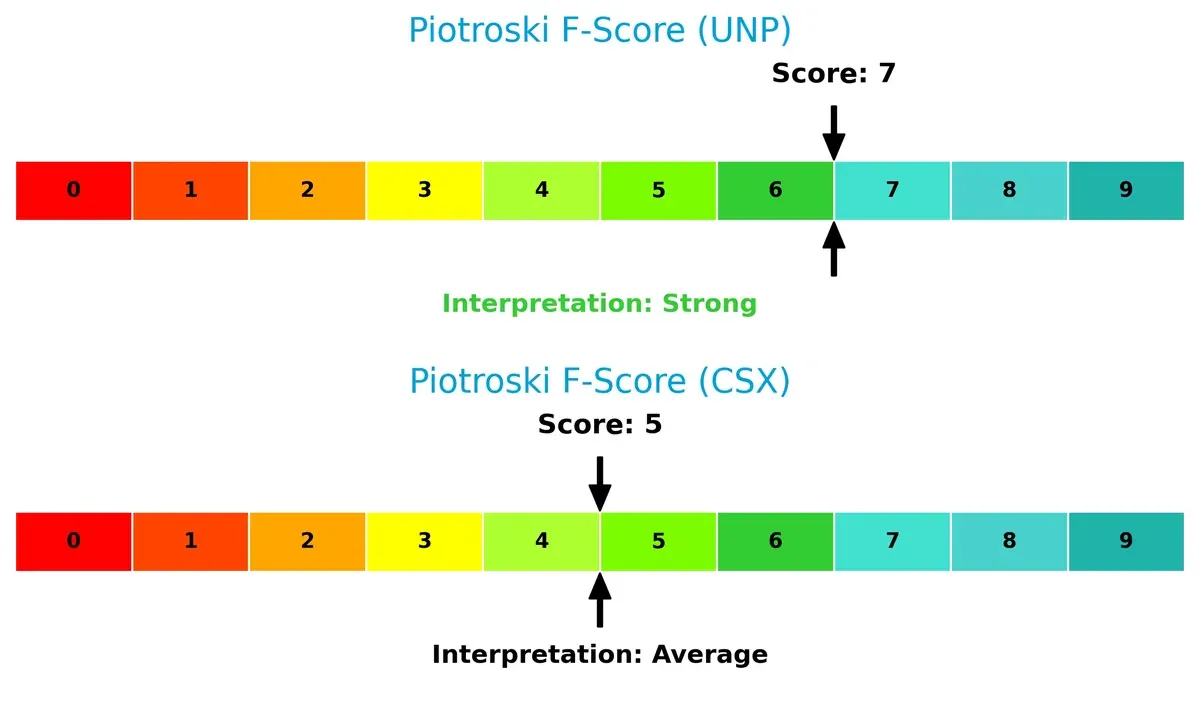
Financial Health: Quality of Operations
Union Pacific’s Piotroski F-Score of 7 indicates strong financial health and operational quality. CSX’s score of 5 suggests average strength with potential red flags in internal metrics when compared to Union Pacific:
How are the two companies positioned?
This section dissects the operational DNA of Union Pacific and CSX by comparing their revenue distribution and internal strengths and weaknesses. The goal is to confront their economic moats to reveal which model offers the most resilient competitive advantage today.
Revenue Segmentation: The Strategic Mix
This visual comparison dissects how Union Pacific Corporation and CSX Corporation diversify their income streams and where their primary sector bets lie:
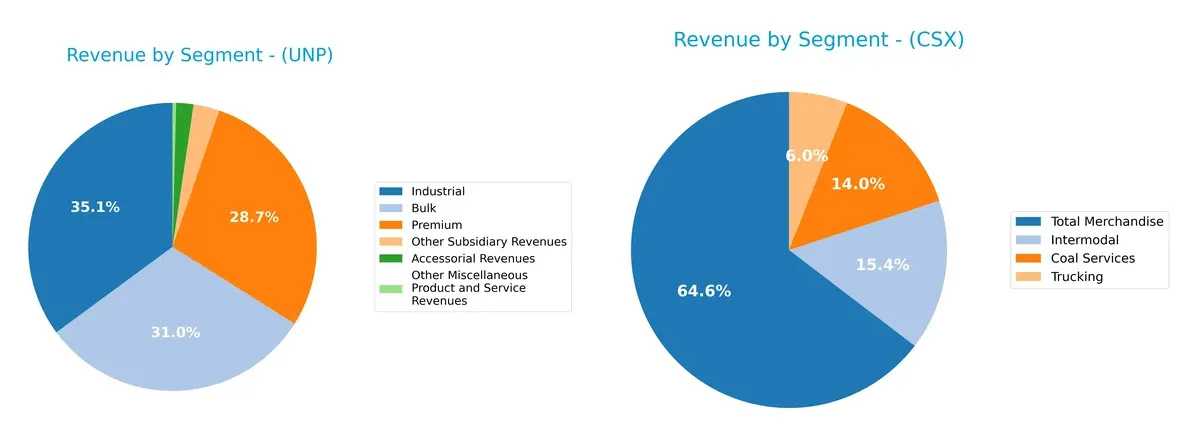
Union Pacific leans on three heavy hitters: Industrial ($8.6B), Bulk ($7.6B), and Premium ($7B), showing a balanced but concentrated portfolio. CSX pivots on Total Merchandise ($8.8B) and Coal Services ($1.9B), with Intermodal ($2.1B) adding diversification. Union Pacific’s mix suggests ecosystem lock-in across industrial and premium freight. CSX’s reliance on merchandise and coal signals exposure to commodity cycles, posing moderate concentration risk despite broader product exposure.
Strengths and Weaknesses Comparison
This table compares the strengths and weaknesses of Union Pacific Corporation and CSX Corporation based on diversification, profitability, financials, innovation, global presence, and market share:
UNP Strengths
- Strong profitability with 29.12% net margin and 38.65% ROE
- Favorable ROIC of 11.7% below WACC (7.4%) indicates value creation
- Dividend yield at 2.36% supports income investors
- Diverse revenue streams including Bulk, Industrial, and Premium products
- Presence in US and Mexico markets enhances geographic diversification
CSX Strengths
- Exceptional ROIC at 392% far exceeds WACC neutral at 8.45%, signaling efficient capital use
- Favorable net margin of 20.5% and ROE of 21.95%
- Solid revenue from diverse merchandise including Coal, Intermodal, and Trucking
- Favorable interest coverage ratio of 5.44 supports debt servicing
UNP Weaknesses
- Current ratio below 1 (0.91) signals liquidity risk
- High debt-to-equity ratio at 1.72 raises leverage concerns
- Asset turnover ratios (0.35) and fixed asset turnover (0.41) are low, indicating inefficiency
- Price-to-book ratio unfavorable at 7.42
- Global presence limited mainly to US and Mexico
CSX Weaknesses
- Very low liquidity ratios (current and quick at 0.22) present short-term risk
- Fixed asset turnover at zero flags operational inefficiency
- Price-to-book ratio unfavorable at 5.13
- Lower dividend yield at 1.44% limits income appeal
- Slightly unfavorable global ratio profile overall
Union Pacific leads in profitability and geographic diversification but faces liquidity and leverage challenges. CSX excels in capital efficiency with a stellar ROIC but struggles with liquidity and asset utilization. Both companies show areas requiring strategic focus to balance growth and financial health.
The Moat Duel: Analyzing Competitive Defensibility
A structural moat is the only true shield protecting long-term profits from relentless competitive erosion. Let’s dissect how each firm defends its turf:
Union Pacific Corporation: Network Scale and Capital Efficiency
Union Pacific’s moat stems from its vast rail network and efficient capital use, reflected in a 4.3% ROIC above WACC. Margins remain robust, but a slight ROIC decline signals emerging challenges in 2026.
CSX Corporation: Rapid ROIC Expansion and Operational Leverage
CSX’s moat contrasts with UNP’s by boasting an explosive ROIC growth, outpacing WACC by a massive margin. This signals a deepening competitive advantage fueled by operational improvements and market expansion.
Network Scale vs. Operational Dynamism: The Moat Showdown
CSX exhibits a wider, deepening moat with accelerating profitability, while Union Pacific’s network scale delivers stable but slightly eroding returns. CSX appears better poised to defend and grow its market share through superior capital efficiency.
Which stock offers better returns?
Over the past 12 months, Union Pacific and CSX showed notable upward price movements with accelerating bullish trends, reflecting strong buyer dominance and increasing trading volumes.
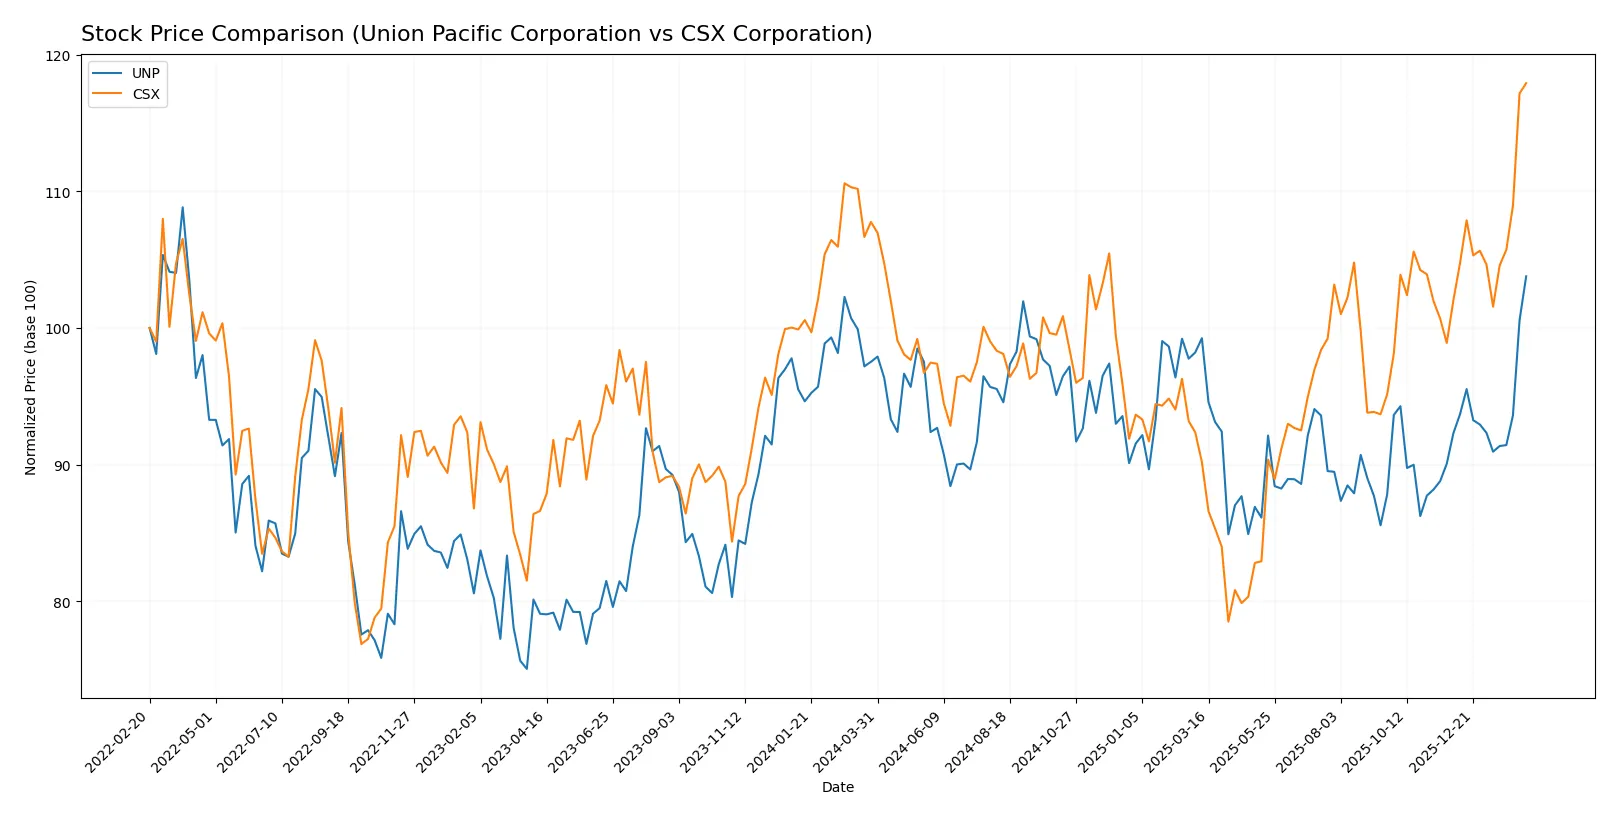
Trend Comparison
Union Pacific’s stock price rose 6.41% over the past year, confirming a bullish trend with accelerating momentum. Prices peaked at 260.68 and troughed at 213.26, showing moderate volatility (std dev 10.41).
CSX’s stock climbed 9.42% in the same period, also exhibiting a bullish trend with acceleration. The price range was 27.21 to 40.87, with lower volatility (std dev 2.44) compared to Union Pacific.
CSX outperformed Union Pacific with a higher 9.42% gain versus 6.41%, delivering superior market returns over the analyzed 12-month period.
Target Prices
Analysts present a clear consensus on target prices for Union Pacific Corporation and CSX Corporation.
| Company | Target Low | Target High | Consensus |
|---|---|---|---|
| Union Pacific Corporation | 227 | 285 | 260.5 |
| CSX Corporation | 30 | 45 | 39.11 |
The target consensus for Union Pacific aligns closely with its current price of $260.68, suggesting limited upside. CSX’s consensus target at $39.11 sits just below the current price of $40.87, indicating potential downside risk.

Don’t Let Luck Decide Your Entry Point
Optimize your entry points with our advanced ProRealTime indicators. You’ll get efficient buy signals with precise price targets for maximum performance. Start outperforming now!
How do institutions grade them?
Here is how top financial institutions have recently graded Union Pacific Corporation and CSX Corporation:
Union Pacific Corporation Grades
The following table summarizes recent grades from reputable financial institutions for Union Pacific Corporation:
| Grading Company | Action | New Grade | Date |
|---|---|---|---|
| Citigroup | Maintain | Buy | 2026-01-28 |
| JP Morgan | Maintain | Neutral | 2026-01-28 |
| JP Morgan | Maintain | Neutral | 2026-01-12 |
| BMO Capital | Downgrade | Market Perform | 2026-01-07 |
| Barclays | Maintain | Overweight | 2025-12-16 |
| Deutsche Bank | Downgrade | Hold | 2025-12-11 |
| BMO Capital | Maintain | Outperform | 2025-10-24 |
| TD Cowen | Maintain | Buy | 2025-10-24 |
| Citigroup | Maintain | Buy | 2025-10-24 |
| JP Morgan | Maintain | Neutral | 2025-10-24 |
CSX Corporation Grades
The following table summarizes recent grades from reputable financial institutions for CSX Corporation:
| Grading Company | Action | New Grade | Date |
|---|---|---|---|
| Citigroup | Maintain | Buy | 2026-01-23 |
| Bernstein | Maintain | Market Perform | 2026-01-23 |
| Evercore ISI Group | Maintain | Outperform | 2026-01-23 |
| JP Morgan | Maintain | Overweight | 2026-01-12 |
| Morgan Stanley | Maintain | Equal Weight | 2025-12-08 |
| JP Morgan | Maintain | Overweight | 2025-10-20 |
| Barclays | Maintain | Overweight | 2025-10-20 |
| Baird | Maintain | Outperform | 2025-10-20 |
| TD Cowen | Maintain | Buy | 2025-10-17 |
| UBS | Maintain | Buy | 2025-10-17 |
Which company has the best grades?
CSX Corporation generally receives stronger and more consistent positive grades such as Buy, Outperform, and Overweight. Union Pacific shows some downgrades and more Neutral or Hold ratings. Investors may interpret CSX’s stronger consensus as a signal of greater institutional confidence.
Risks specific to each company
The following categories identify the critical pressure points and systemic threats facing both firms in the 2026 market environment:
1. Market & Competition
Union Pacific Corporation
- Larger market cap provides stronger competitive positioning but faces pressure from evolving freight demands.
CSX Corporation
- Smaller scale with higher beta signals more volatility; competes intensely in eastern US markets.
2. Capital Structure & Debt
Union Pacific Corporation
- Debt-to-equity at 1.72 signals elevated leverage; interest coverage remains strong at 8.0x.
CSX Corporation
- Slightly lower debt-to-equity at 1.43 but weaker interest coverage at 5.44x increases financial risk.
3. Stock Volatility
Union Pacific Corporation
- Beta near 1 (0.987) suggests stock moves roughly with the market, less volatile.
CSX Corporation
- Beta at 1.29 indicates higher sensitivity to market swings, increasing risk.
4. Regulatory & Legal
Union Pacific Corporation
- Faces typical railroad regulatory scrutiny; no exceptional legal risks reported.
CSX Corporation
- Similar regulatory environment; exposure to multi-state and cross-border regulations adds complexity.
5. Supply Chain & Operations
Union Pacific Corporation
- Extensive network of 32,452 route miles offers operational scale but complexity risks.
CSX Corporation
- Smaller 19,500 route miles network; operational efficiency challenged by fixed asset turnover at zero.
6. ESG & Climate Transition
Union Pacific Corporation
- Increasing pressure to reduce carbon footprint; coal transport poses transition risk.
CSX Corporation
- Faces similar ESG pressures; exposure to coal and chemicals transport increases climate transition challenges.
7. Geopolitical Exposure
Union Pacific Corporation
- Primarily US-focused with limited international exposure, reducing geopolitical risk.
CSX Corporation
- Operates in US and parts of Canada, adding cross-border regulatory and geopolitical considerations.
Which company shows a better risk-adjusted profile?
Union Pacific’s greatest risk lies in its elevated leverage and operational complexity but benefits from stable market positioning and better financial health scores. CSX faces heightened stock volatility and weaker liquidity ratios, reflecting a riskier capital structure and operational inefficiencies. The recent Altman Z-Score places Union Pacific safely above distress thresholds, while CSX remains in a grey zone. This data underlines my concern about CSX’s financial resilience, making Union Pacific the safer, more risk-adjusted choice today.
Final Verdict: Which stock to choose?
Union Pacific’s superpower lies in its robust value creation and efficient capital deployment, reflected in a strong ROE and consistent free cash flow generation. Its key point of vigilance is the stretched balance sheet, which could pressure liquidity in downturns. It suits portfolios aiming for steady long-term growth with moderate risk tolerance.
CSX stands out with an exceptionally wide moat underpinned by a rapidly growing ROIC, signaling sustainable competitive advantage and operational leverage. Compared to Union Pacific, it carries a higher-risk profile due to weaker liquidity and more volatile earnings. It fits well in GARP portfolios that seek growth tempered by strategic moat strength.
If you prioritize durable value creation and a proven capital allocation track record, Union Pacific is the compelling choice due to its balanced growth and financial resilience. However, if you seek aggressive growth fueled by expanding profitability and a strong competitive moat, CSX offers superior upside potential despite higher near-term volatility.
Disclaimer: Investment carries a risk of loss of initial capital. The past performance is not a reliable indicator of future results. Be sure to understand risks before making an investment decision.
Go Further
I encourage you to read the complete analyses of Union Pacific Corporation and CSX Corporation to enhance your investment decisions: