Home > Comparison > Industrials > CSX vs NSC
The strategic rivalry between CSX Corporation and Norfolk Southern Corporation shapes the trajectory of the U.S. railroads sector. CSX operates a vast rail-based freight network focused on intermodal and bulk commodities, while Norfolk Southern emphasizes diversified raw materials and finished goods transportation. This clash highlights differing operational models within industrial railroads. This analysis will identify which company’s strategy offers the superior risk-adjusted return for a diversified portfolio in 2026.
Table of contents
Companies Overview
CSX Corporation and Norfolk Southern Corporation both command significant positions in the U.S. rail freight market, shaping transportation logistics across the eastern states.
CSX Corporation: Rail Freight Powerhouse
CSX Corporation dominates the rail-based freight transportation sector with a vast network spanning 19,500 route miles. Its core revenue comes from moving chemicals, agricultural products, automotive goods, and bulk commodities. In 2026, CSX strategically focuses on expanding intermodal services and enhancing rail-to-truck transfers to strengthen supply chain integration across 23 states and Canadian provinces.
Norfolk Southern Corporation: Diverse Rail Transport Leader
Norfolk Southern Corporation operates a 19,300-route-mile rail network, specializing in transporting raw materials, chemicals, metals, and finished goods. Its revenue engine relies heavily on a diverse cargo mix, including agriculture, automotive, and coal freight. The company’s 2026 strategy emphasizes port intermodal connectivity and commuter rail services to boost market coverage and operational flexibility across 22 states.
Strategic Collision: Similarities & Divergences
Both companies anchor their business models in extensive rail networks serving the eastern U.S., yet CSX prioritizes intermodal expansion while Norfolk Southern blends freight with commuter rail. Their competition centers on capturing intermodal container traffic and industrial shipments. Investors should note CSX’s broader geographic reach contrasts with Norfolk Southern’s focus on diversified cargo and commuter services, offering distinct risk-return profiles.
Income Statement Comparison
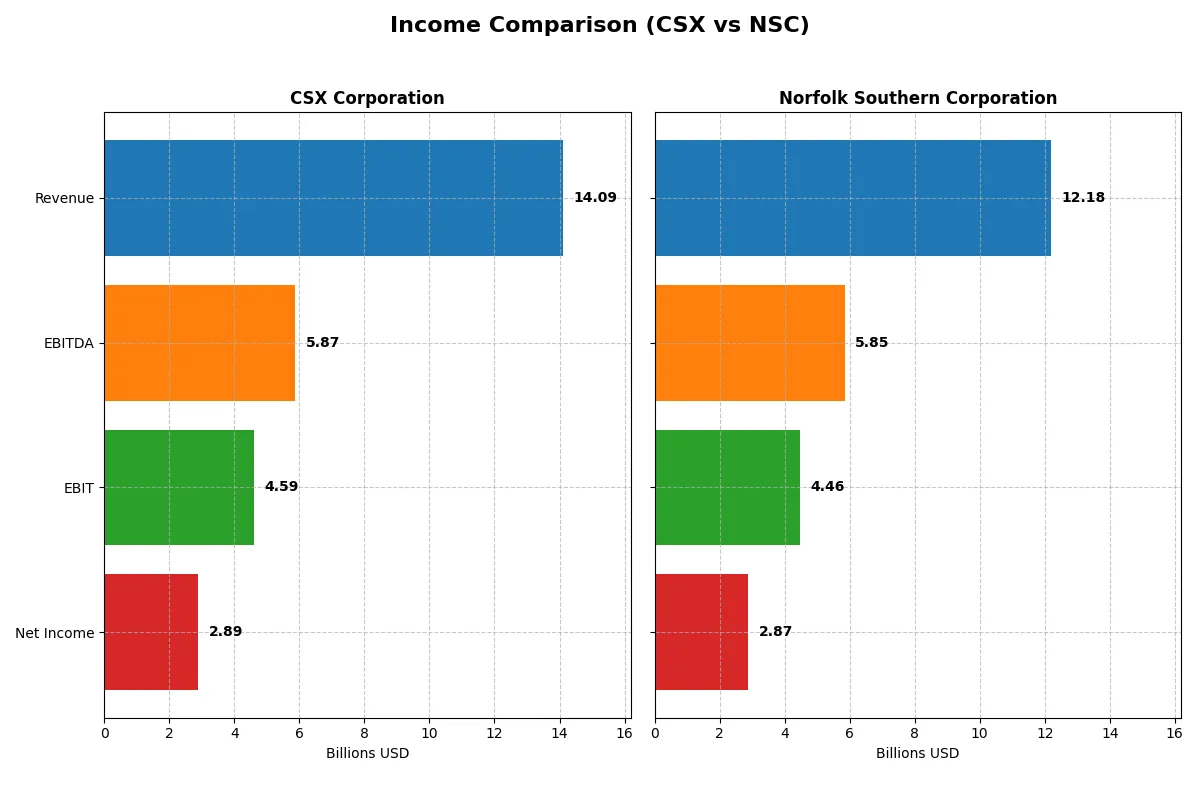
This data dissects the core profitability and scalability of both corporate engines to reveal who dominates the bottom line:
| Metric | CSX Corporation (CSX) | Norfolk Southern Corporation (NSC) |
|---|---|---|
| Revenue | 14.1B | 12.2B |
| Cost of Revenue | 9.4B | 7.0B |
| Operating Expenses | 164M | 1.16B |
| Gross Profit | 4.7B | 5.2B |
| EBITDA | 5.9B | 5.9B |
| EBIT | 4.6B | 4.5B |
| Interest Expense | 844M | 792M |
| Net Income | 2.9B | 2.9B |
| EPS | 1.54 | 12.75 |
| Fiscal Year | 2025 | 2025 |
Income Statement Analysis: The Bottom-Line Duel
This income statement comparison reveals which company operates with superior efficiency and profit generation in the current market cycle.
CSX Corporation Analysis
CSX’s revenue peaked at 14.65B in 2023 before declining slightly to 14.09B in 2025, showing a modest 12.5% growth over five years but a recent 3% drop. Net income contracted by 23.6% overall, reaching 2.89B in 2025. Gross margin remains solid at 33.25%, but net margin shrank 14.1% recently, signaling weakening profitability and margin pressures.
Norfolk Southern Corporation Analysis
Norfolk Southern’s revenue showed steady growth, hitting 12.18B in 2025, a 9.3% increase over five years with a slight 0.5% rise last year. Net income fell modestly by 4.4% over the period but improved to 2.87B in 2025. The company boasts superior gross margin at 42.4% and net margin of 23.6%, both expanding recently, reflecting robust operational leverage and improving bottom-line momentum.
Margin Power vs. Revenue Scale
Norfolk Southern outperforms CSX in margin quality and recent earnings momentum despite a smaller revenue base. CSX’s declining margins and net income contrast with Norfolk Southern’s margin expansion and stable earnings growth. For investors prioritizing profit efficiency and margin resilience, Norfolk Southern presents the more compelling profile in this cycle.
Financial Ratios Comparison
These vital ratios act as a diagnostic tool to expose the underlying fiscal health, valuation premiums, and capital efficiency of the companies compared below:
| Ratios | CSX Corporation (CSX) | Norfolk Southern Corporation (NSC) |
|---|---|---|
| ROE | 21.95% | 18.48% |
| ROIC | 3.92 | 7.47 |
| P/E | 23.39 | 22.59 |
| P/B | 5.13 | 4.17 |
| Current Ratio | 0.22 | 0.85 |
| Quick Ratio | 0.22 | 0.85 |
| D/E (Debt-to-Equity) | 1.43 | 1.10 |
| Debt-to-Assets | 43.21% | 37.77% |
| Interest Coverage | 5.36 | 5.06 |
| Asset Turnover | 0.32 | 0.27 |
| Fixed Asset Turnover | 0 | 0 |
| Payout ratio | 33.64% | 42.29% |
| Dividend yield | 1.44% | 1.87% |
| Fiscal Year | 2025 | 2025 |
Efficiency & Valuation Duel: The Vital Signs
Financial ratios act as a company’s DNA, exposing hidden risks and operational strengths that shape investor outcomes.
CSX Corporation
CSX exhibits strong profitability with a 21.95% ROE and a favorable 20.5% net margin, signaling operational efficiency. The stock trades at a neutral P/E of 23.39 but carries an unfavorable high P/B of 5.13, suggesting valuation tension. CSX returns value with a modest 1.44% dividend yield, balancing shareholder payouts and reinvestment.
Norfolk Southern Corporation
Norfolk Southern posts a solid 18.48% ROE and a slightly higher net margin at 23.59%, reflecting efficient core operations. Its P/E of 22.59 remains neutral, while the P/B of 4.17 is unfavorable but less stretched than CSX. NSC provides a 1.87% dividend yield, demonstrating a stronger income focus for shareholders.
Operational Strength vs. Valuation Stretch
CSX delivers superior profitability and a disciplined dividend but faces valuation and liquidity concerns. Norfolk Southern offers slightly higher margins and dividends with less valuation pressure. Investors seeking income may prefer NSC’s profile, while those valuing operational efficiency might lean toward CSX.
Which one offers the Superior Shareholder Reward?
I compare CSX and Norfolk Southern’s dividend yields, payout ratios, and buyback intensity. CSX yields ~1.4% with a payout ratio near 27–34%, supported by moderate FCF coverage and steady buybacks. Norfolk Southern offers a higher yield around 2.3%, but pays out over 42% of earnings, risking sustainability. NSC’s free cash flow aligns closely with dividends but capex is heavy, pressuring buybacks. CSX’s balanced distribution, lower payout, and robust cash flow coverage make its model more sustainable. I conclude CSX offers a superior total return profile for 2026 investors due to prudent capital allocation and healthier dividend sustainability.
Comparative Score Analysis: The Strategic Profile
The radar chart reveals the fundamental DNA and trade-offs of CSX Corporation and Norfolk Southern Corporation, highlighting their financial strengths and vulnerabilities:
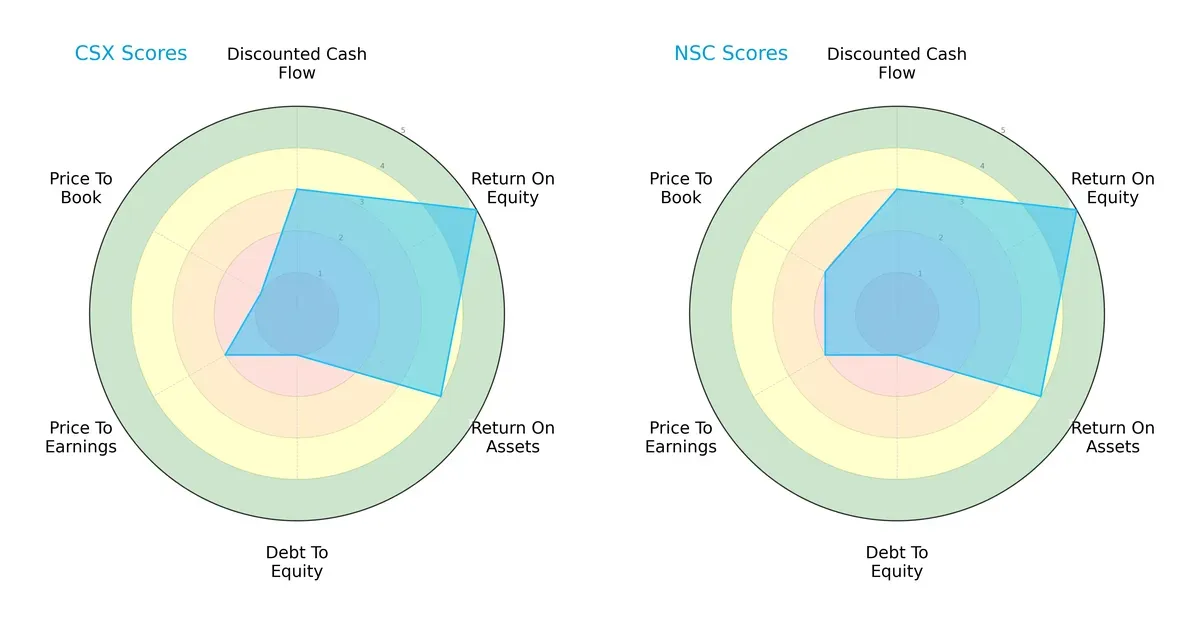
Both companies share identical overall, DCF, ROE, and ROA scores, showing similar operational efficiency and valuation perspectives. However, Norfolk Southern edges out CSX with a slightly better price-to-book score, indicating marginally less overvaluation. Both firms struggle with debt-to-equity ratios, reflecting elevated leverage, but CSX fares worse in valuation metrics, pointing to higher market skepticism. Norfolk Southern presents a more balanced profile, while CSX relies heavily on operational returns amid financial risks.
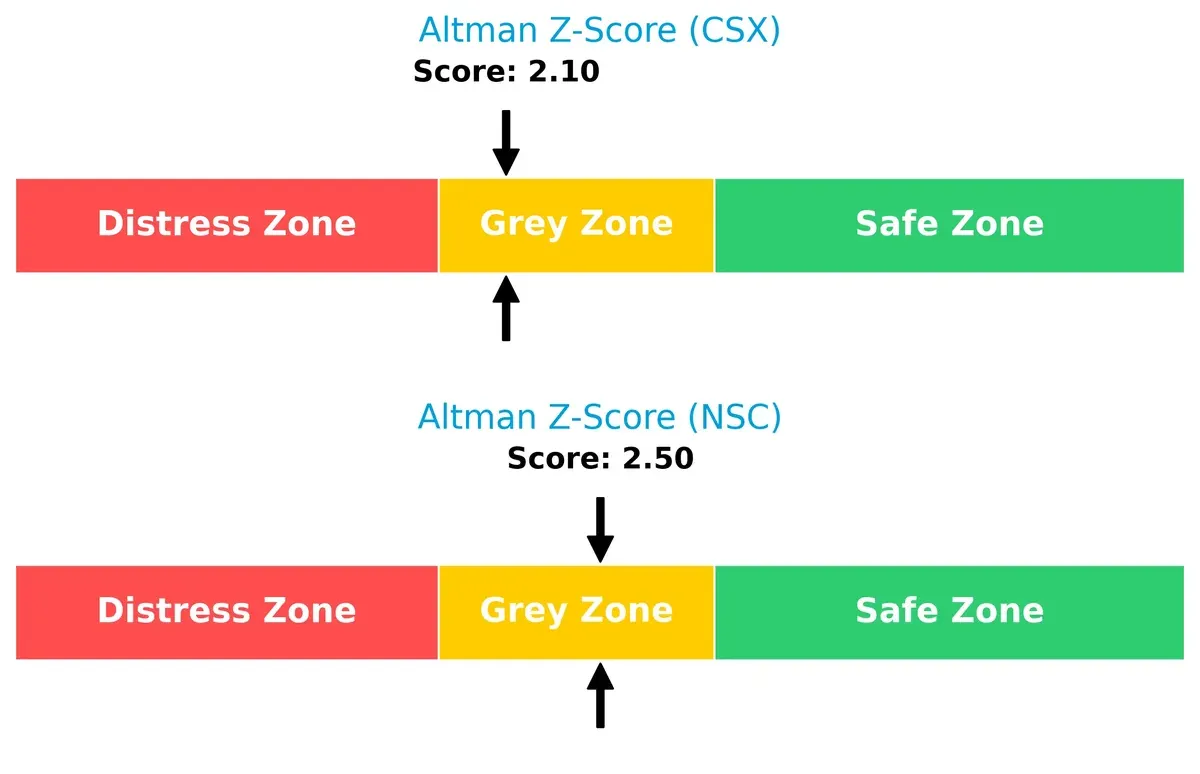
Bankruptcy Risk: Solvency Showdown
The Altman Z-Score difference indicates Norfolk Southern holds a stronger solvency position than CSX, though both remain in the grey zone, signaling moderate bankruptcy risk in this cycle:
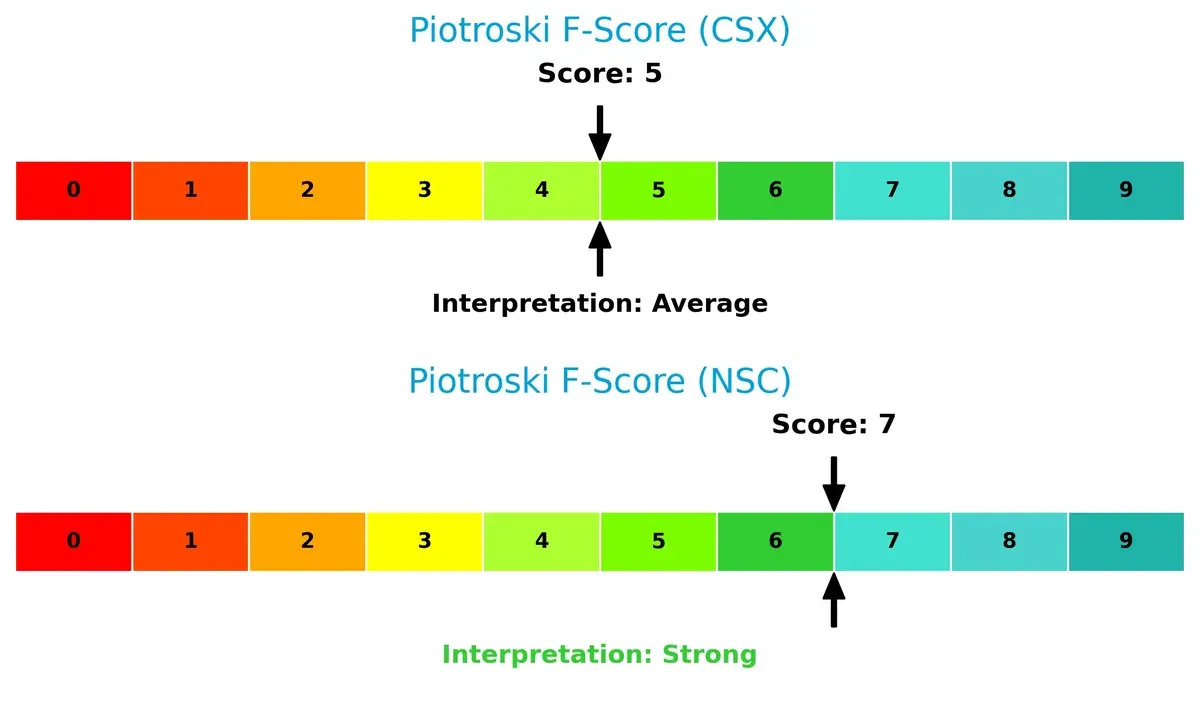
Financial Health: Quality of Operations
Norfolk Southern’s Piotroski F-Score of 7 signals robust financial health, outperforming CSX’s average score of 5, which raises caution due to weaker internal metrics:
How are the two companies positioned?
This section dissects CSX and NSC’s operational DNA by comparing their revenue distribution and internal strengths and weaknesses. The goal is to confront their economic moats to reveal which model delivers the most resilient, sustainable advantage today.
Revenue Segmentation: The Strategic Mix
This visual comparison dissects how CSX Corporation and Norfolk Southern Corporation diversify their income streams and where their primary sector bets lie:
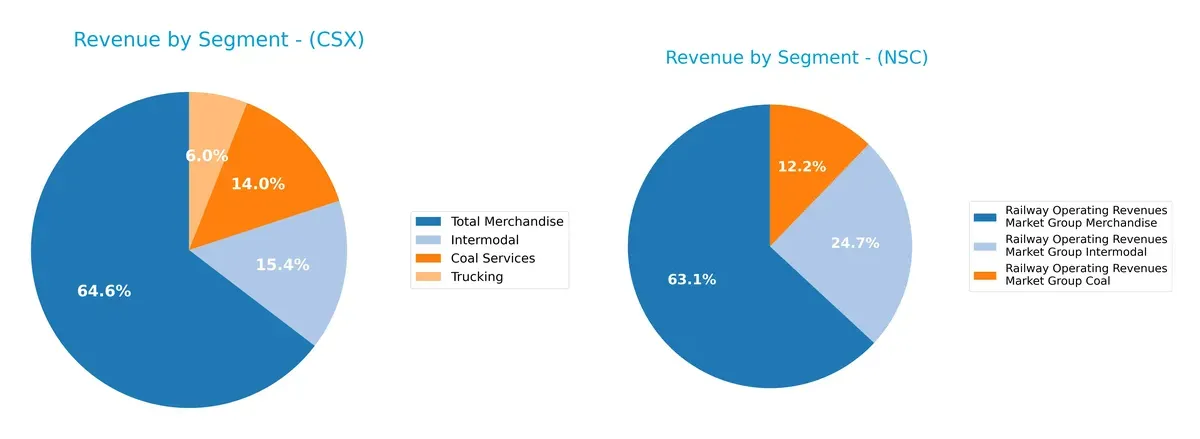
CSX anchors its revenue heavily in Total Merchandise at $8.8B for 2025, supplemented by Coal Services at $1.9B and Intermodal at $2.1B, reflecting a moderately diversified portfolio. Norfolk Southern, however, exhibits a more balanced segmentation with Merchandise at $7.7B, Intermodal commanding $3B, and Coal at $1.5B. Norfolk Southern’s broader intermodal stake signals strategic infrastructure dominance, while CSX’s reliance on merchandise heightens concentration risk despite solid segment depth.
Strengths and Weaknesses Comparison
This table compares the Strengths and Weaknesses of CSX and Norfolk Southern Corporation (NSC):
CSX Strengths
- Higher ROIC of 392% indicating efficient capital use
- Favorable net margin at 20.5%
- Strong ROE at 21.95%
- Interest coverage ratio at 5.44
- Broad merchandise revenue streams, including chemicals and automotive
NSC Strengths
- Higher net margin at 23.59%
- Favorable interest coverage at 5.63
- Diversified revenue with strong intermodal segment at $3B
- Lower debt-to-assets ratio at 38%
- Neutral quick ratio suggesting moderate liquidity
CSX Weaknesses
- Low current and quick ratios at 0.22 indicate liquidity risk
- High debt-to-equity at 1.43 raises leverage concerns
- Unfavorable asset turnover metrics
- Price-to-book ratio is high at 5.13
- Slightly unfavorable global ratio opinion
NSC Weaknesses
- Current ratio below 1 at 0.85 signals liquidity constraints
- Debt-to-equity at 1.1 poses leverage risk
- Lower ROIC at 7.47%
- Unfavorable asset turnover
- Slightly unfavorable global ratio opinion
Both companies exhibit slightly unfavorable overall financial ratio profiles. CSX excels in capital efficiency but faces liquidity and leverage challenges. NSC offers stronger profitability but must manage liquidity and capital returns. These contrasts highlight differing strategic focuses in operational and financial management.
The Moat Duel: Analyzing Competitive Defensibility
A structural moat is the only true shield protecting long-term profits from relentless competition and market disruption:
CSX Corporation: Efficient Capital Allocation Moat
CSX boasts a strong moat driven by superior capital efficiency, evidenced by a ROIC vastly exceeding WACC. Its growing profitability signals durable competitive advantage. Expansion in intermodal services may deepen this edge in 2026.
Norfolk Southern Corporation: Eroding Profitability Moat
Norfolk Southern’s moat contrasts sharply, with declining ROIC below WACC indicating value destruction. While it maintains strong margins, weakening capital returns threaten its competitive standing amid evolving logistics demands.
Capital Efficiency vs. Profit Erosion: The Moat Showdown
CSX’s widening moat through exceptional capital returns outpaces Norfolk Southern’s shrinking advantage. CSX stands better poised to defend and grow its market share in a competitive railroad sector.
Which stock offers better returns?
The past year shows strong bullish trends for both CSX Corporation and Norfolk Southern Corporation, with notable price accelerations and distinct trading volumes shaping their market dynamics.
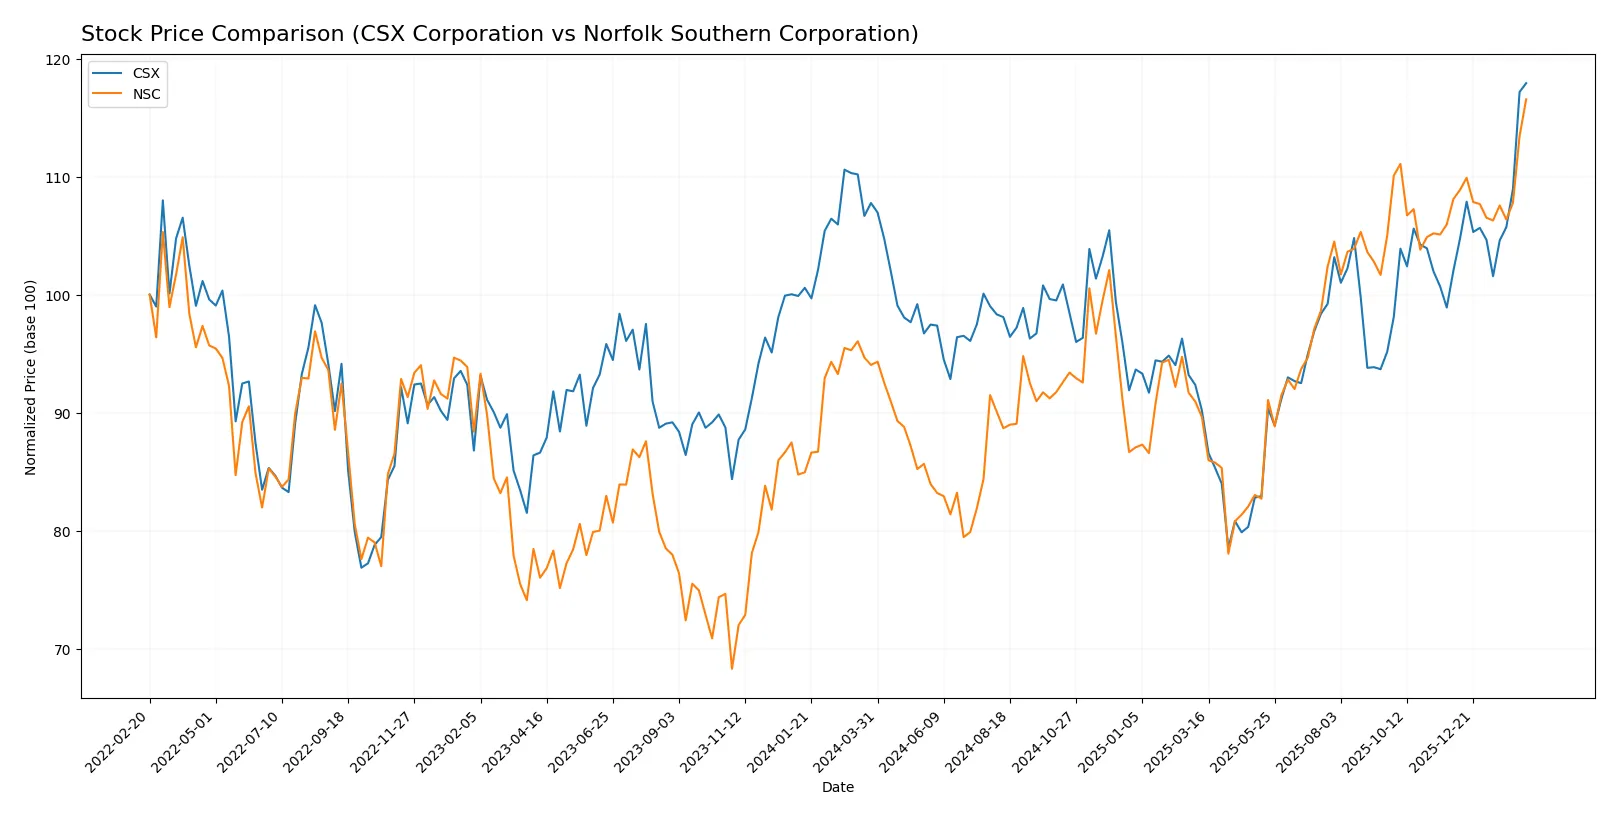
Trend Comparison
CSX Corporation’s stock price rose 9.42% over the past 12 months, showing an accelerating bullish trend with a 2.44 standard deviation and a high of 40.87.
Norfolk Southern Corporation gained 23.93% over the same period, also accelerating bullishly but with higher volatility, as reflected by a 24.82 standard deviation and a peak price of 314.94.
Norfolk Southern outperformed CSX, delivering the highest market return despite elevated volatility compared to CSX’s steadier rise.
Target Prices
Analyst consensus presents a clear range of target prices for CSX Corporation and Norfolk Southern Corporation.
| Company | Target Low | Target High | Consensus |
|---|---|---|---|
| CSX Corporation | 30 | 45 | 39.11 |
| Norfolk Southern Corporation | 288 | 342 | 312.43 |
The target consensus for CSX sits slightly below its current price of $40.87, signaling modest upside potential. Norfolk Southern’s target consensus at $312.43 aligns closely with its current price of $314.94, suggesting a balanced risk-reward profile.

Don’t Let Luck Decide Your Entry Point
Optimize your entry points with our advanced ProRealTime indicators. You’ll get efficient buy signals with precise price targets for maximum performance. Start outperforming now!
How do institutions grade them?
Here is a summary of recent institutional grades for both companies:
CSX Corporation Grades
The following table shows CSX Corporation’s recent grades from major financial firms.
| Grading Company | Action | New Grade | Date |
|---|---|---|---|
| Citigroup | Maintain | Buy | 2026-01-23 |
| Bernstein | Maintain | Market Perform | 2026-01-23 |
| Evercore ISI Group | Maintain | Outperform | 2026-01-23 |
| JP Morgan | Maintain | Overweight | 2026-01-12 |
| Morgan Stanley | Maintain | Equal Weight | 2025-12-08 |
| JP Morgan | Maintain | Overweight | 2025-10-20 |
| Barclays | Maintain | Overweight | 2025-10-20 |
| Baird | Maintain | Outperform | 2025-10-20 |
| TD Cowen | Maintain | Buy | 2025-10-17 |
| UBS | Maintain | Buy | 2025-10-17 |
Norfolk Southern Corporation Grades
Below is the table summarizing Norfolk Southern Corporation’s latest institutional grades.
| Grading Company | Action | New Grade | Date |
|---|---|---|---|
| Baird | Maintain | Neutral | 2026-02-02 |
| Citigroup | Maintain | Neutral | 2026-01-30 |
| JP Morgan | Maintain | Neutral | 2026-01-30 |
| Barclays | Maintain | Overweight | 2026-01-30 |
| RBC Capital | Maintain | Sector Perform | 2026-01-30 |
| JP Morgan | Maintain | Neutral | 2026-01-12 |
| Citigroup | Maintain | Neutral | 2026-01-08 |
| Barclays | Maintain | Overweight | 2025-12-16 |
| Deutsche Bank | Downgrade | Hold | 2025-12-11 |
| TD Cowen | Maintain | Buy | 2025-10-24 |
Which company has the best grades?
CSX Corporation consistently receives stronger grades, including multiple “Buy” and “Outperform” ratings. Norfolk Southern mostly holds “Neutral” or “Overweight” ratings with a recent downgrade. This difference may influence investor confidence and portfolio positioning.
Risks specific to each company
The following categories identify the critical pressure points and systemic threats facing both firms in the 2026 market environment:
1. Market & Competition
CSX Corporation
- Faces intense competition in the eastern U.S. rail sector with pressures on pricing and volume growth.
Norfolk Southern Corporation
- Competes heavily in overlapping regions, leveraging a slightly smaller network but strong intermodal services.
2. Capital Structure & Debt
CSX Corporation
- Debt-to-equity ratio at 1.43 signals higher leverage, raising financial risk despite favorable interest coverage.
Norfolk Southern Corporation
- Lower debt-to-equity ratio of 1.1 suggests more prudent leverage but still elevated for the sector’s standards.
3. Stock Volatility
CSX Corporation
- Beta of 1.29 indicates moderately higher volatility than the market, typical for railroad stocks.
Norfolk Southern Corporation
- Slightly higher beta at 1.324 reflects marginally greater stock price fluctuations relative to the market.
4. Regulatory & Legal
CSX Corporation
- Subject to stringent U.S. rail safety and environmental regulations, with ongoing compliance costs.
Norfolk Southern Corporation
- Faces similar regulatory risks with added exposure to commuter rail services increasing legal complexities.
5. Supply Chain & Operations
CSX Corporation
- Extensive 19,500-route-mile network with operational challenges in managing intermodal and bulk freight flows.
Norfolk Southern Corporation
- Operates 19,300 miles with operational efficiencies but vulnerable to labor disruptions and infrastructure aging.
6. ESG & Climate Transition
CSX Corporation
- Under pressure to reduce emissions; rail’s efficiency is a moat but transition investments are capital intensive.
Norfolk Southern Corporation
- Also exposed to climate transition costs; benefits from strong ESG reporting but faces risks from coal transport decline.
7. Geopolitical Exposure
CSX Corporation
- Limited international exposure, primarily U.S. and Canada, reducing geopolitical risk but dependent on cross-border trade flows.
Norfolk Southern Corporation
- Similar geographic footprint with modest port exposure, sensitive to trade tariffs and border delays.
Which company shows a better risk-adjusted profile?
NSC’s lower leverage and stronger Piotroski score suggest a more stable financial footing. However, CSX’s superior profitability metrics offset its higher debt risks. Both firms hover in the Altman Z-score grey zone, signaling moderate bankruptcy risk. I remain cautious given CSX’s weak liquidity ratios and NSC’s operational vulnerabilities amid regulatory complexity.
Final Verdict: Which stock to choose?
CSX Corporation stands out as a powerhouse of capital efficiency with a very favorable moat driven by its strong and growing ROIC. Its superpower lies in creating sustained value through operational excellence. A point of vigilance remains its weak liquidity ratios, signaling potential short-term balance sheet stress. CSX suits an aggressive growth portfolio focused on value creation.
Norfolk Southern Corporation’s strategic moat is rooted in its solid margin profile and steady cash flow generation, underpinned by a strong income statement and a favorable Piotroski score. It appears safer than CSX in liquidity terms, offering comparatively better stability. NSC fits well within a GARP (Growth at a Reasonable Price) portfolio seeking balanced growth with risk control.
If you prioritize aggressive value creation with a proven track record of outperforming capital costs, CSX is the compelling choice due to its very favorable moat and operational strength. However, if you seek steadier income quality and better short-term liquidity, Norfolk Southern offers better stability and a more balanced risk profile. Both present analytical scenarios worthy of consideration based on individual risk tolerance and investment horizon.
Disclaimer: Investment carries a risk of loss of initial capital. The past performance is not a reliable indicator of future results. Be sure to understand risks before making an investment decision.
Go Further
I encourage you to read the complete analyses of CSX Corporation and Norfolk Southern Corporation to enhance your investment decisions: