Home > Comparison > Real Estate > CCI vs IRM
The strategic rivalry between Crown Castle Inc. and Iron Mountain Incorporated shapes the real estate specialty REIT sector’s future. Crown Castle operates a capital-intensive, nationwide communications infrastructure network, while Iron Mountain focuses on diversified information management and secure storage services globally. This contrast highlights a battle between infrastructure scale and service diversification. This analysis aims to identify which trajectory presents superior risk-adjusted returns for a diversified portfolio in 2026.
Table of contents
Companies Overview
Crown Castle Inc. and Iron Mountain Incorporated stand as pivotal players in the specialty REIT sector, each commanding critical infrastructure markets.
Crown Castle Inc.: Communications Infrastructure Powerhouse
Crown Castle dominates the U.S. market with its 40,000+ cell towers and 80,000 route miles of fiber. It generates revenue by leasing these essential assets to wireless carriers and enterprises. In 2026, the company focuses on expanding its fiber solutions and small cell networks, reinforcing its competitive moat in the evolving 5G landscape.
Iron Mountain Incorporated: Global Information Management Leader
Iron Mountain leads globally in storage and information management services, managing over 90M square feet of real estate in 50 countries. Its core revenue comes from secure storage, digital transformation, and data center services. The firm’s 2026 strategy centers on enhancing digital solutions while maintaining leadership in physical records and asset protection.
Strategic Collision: Similarities & Divergences
Both firms operate in specialty REITs but diverge sharply in focus: Crown Castle invests heavily in wireless infrastructure, while Iron Mountain specializes in data and record storage. Their primary battleground is infrastructure services supporting digital economies. Crown Castle offers a growth-centric profile tied to 5G, whereas Iron Mountain presents a more diversified, defensive investment anchored in secure information management.
Income Statement Comparison
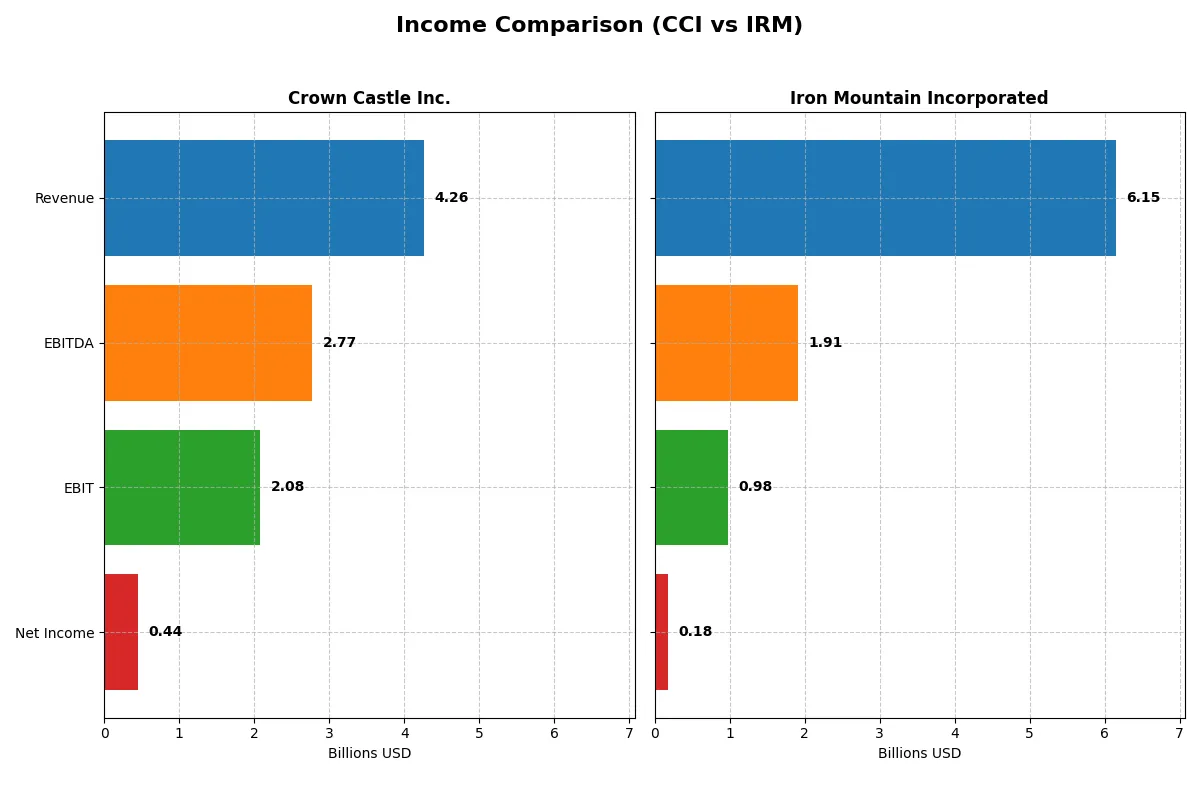
This data dissects the core profitability and scalability of both corporate engines to reveal who dominates the bottom line:
| Metric | Crown Castle Inc. (CCI) | Iron Mountain Incorporated (IRM) |
|---|---|---|
| Revenue | 4.27B | 6.15B |
| Cost of Revenue | 1.45B | 2.70B |
| Operating Expenses | 739M | 2.44B |
| Gross Profit | 2.82B | 3.45B |
| EBITDA | 2.77B | 1.91B |
| EBIT | 2.08B | 981M |
| Interest Expense | 959M | 736M |
| Net Income | 444M | 180M |
| EPS | 1.02 | 0.61 |
| Fiscal Year | 2025 | 2024 |
Income Statement Analysis: The Bottom-Line Duel
This income statement comparison reveals which company drives profitability and efficiency more effectively through their core operations.
Crown Castle Inc. Analysis
Crown Castle’s revenue declined sharply by 35% in 2025, falling to $4.27B from $6.57B in 2024. Despite this, net income rebounded to $444M, up from a significant loss the prior year. Its gross margin remains robust at 66%, and the EBIT margin surged to nearly 49%, signaling strong operational leverage and improved cost control despite unfavorable interest expenses.
Iron Mountain Incorporated Analysis
Iron Mountain posted steady revenue growth of 12% to $6.15B in 2024, supported by expanding gross profit and a solid gross margin of 56%. EBIT margin stands at a modest 16%, reflecting higher operating expenses relative to revenue. Net income held at $180M, with net margin near 3%, showing positive momentum but limited bottom-line scalability.
Margin Strength vs. Revenue Growth
Crown Castle demonstrates superior margin efficiency and a sharp EBIT recovery despite a revenue slump. Iron Mountain, meanwhile, delivers consistent top-line growth but struggles to convert revenue into substantial net profits. For investors, Crown Castle’s profile suggests stronger operational resilience, while Iron Mountain offers steadier revenue expansion but with thinner earnings.
Financial Ratios Comparison
These vital ratios act as a diagnostic tool to expose the underlying fiscal health, valuation premiums, and capital efficiency of the companies compared below:
| Ratios | Crown Castle Inc. (CCI) | Iron Mountain Inc. (IRM) |
|---|---|---|
| ROE | 29.35% | -35.81% |
| ROIC | -9.34% | 4.55% |
| P/E | -10.09 | 171.16 |
| P/B | -296.16 | -61.29 |
| Current Ratio | 0.50 | 0.55 |
| Quick Ratio | 0.50 | 0.55 |
| D/E (Debt-to-Equity) | -222.65 | -32.54 |
| Debt-to-Assets | 90.46% | 87.46% |
| Interest Coverage | -3.26 | 1.37 |
| Asset Turnover | 0.20 | 0.33 |
| Fixed Asset Turnover | 0.31 | 0.61 |
| Payout ratio | -69.92% | 438.25% |
| Dividend yield | 6.93% | 2.56% |
| Fiscal Year | 2024 | 2024 |
Efficiency & Valuation Duel: The Vital Signs
Financial ratios serve as a company’s DNA, exposing hidden risks and operational strengths that shape investment decisions.
Crown Castle Inc.
Crown Castle posts an impressive 29.3% ROE despite a steep negative net margin, signaling operational challenges yet strong equity returns. Its P/E ratio is favorable at -10.1, implying undervaluation or accounting anomalies. The company maintains a healthy 6.9% dividend yield, returning capital to shareholders amid mixed efficiency signals, notably a weak current ratio of 0.5.
Iron Mountain Incorporated
Iron Mountain struggles with a negative 35.8% ROE and a slim 2.9% net margin, indicating profitability issues. The stock’s P/E ratio of 171.2 signals a stretched valuation, raising risk concerns. Despite poor returns, it offers a modest 2.6% dividend yield. Operational efficiency is weak, reflected in a low current ratio of 0.55 and underwhelming asset turnover metrics.
Premium Valuation vs. Operational Safety
Crown Castle balances high shareholder returns with undervalued multiples, though operational risks persist. Iron Mountain exhibits stretched valuation alongside weaker profitability and efficiency. Investors seeking yield and value might favor Crown Castle, while those prioritizing growth at a premium valuation should weigh Iron Mountain’s risk profile carefully.
Which one offers the Superior Shareholder Reward?
I compare Crown Castle Inc. (CCI) and Iron Mountain Incorporated (IRM) on their shareholder reward strategies. CCI yields a strong 6.9% dividend with negative payout ratio signaling recent earnings challenges but supported by solid FCF of 3.97B per share. It pairs dividends with moderate buybacks, sustaining distributions through a robust free cash flow model. IRM yields 2.6%, with a high payout ratio above 400%, but negative free cash flow per share (-2.24B) raises sustainability concerns. IRM relies more on dividends than buybacks, which are limited by weaker operating cash flow coverage. Historically, I’ve seen that CCI’s balanced dividend and buyback approach offers more durable shareholder value versus IRM’s strained payout. Thus, I view CCI as the superior total return candidate in 2026.
Comparative Score Analysis: The Strategic Profile
The radar chart reveals the fundamental DNA and trade-offs defining Crown Castle Inc. and Iron Mountain Incorporated’s strategic profiles:
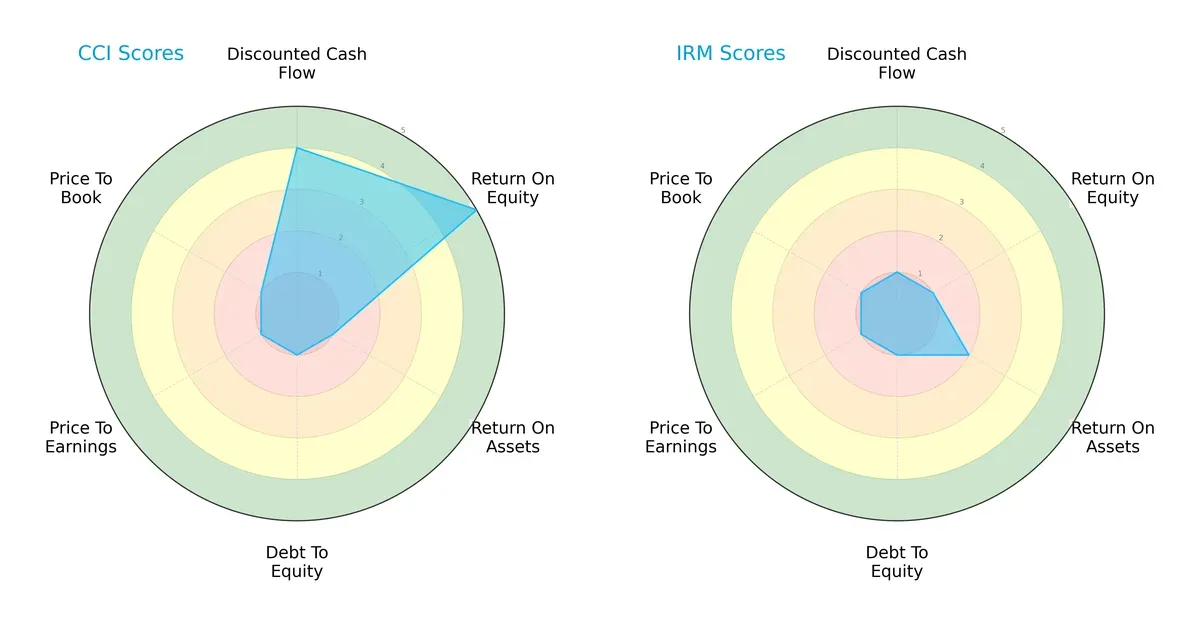
Crown Castle shows strength in discounted cash flow (4) and return on equity (5), but weak asset utilization (1) and balance sheet metrics (debt-to-equity 1). Iron Mountain lags overall with uniformly low scores, offering no clear competitive edge. Crown Castle’s profile is unbalanced yet leverages equity efficiency, while Iron Mountain relies on no particular metric, reflecting a more uniformly challenged position.
Bankruptcy Risk: Solvency Showdown
The Altman Z-Score gap indicates both companies face distress zone risks, with Crown Castle at -0.5 and Iron Mountain slightly better at 0.8:
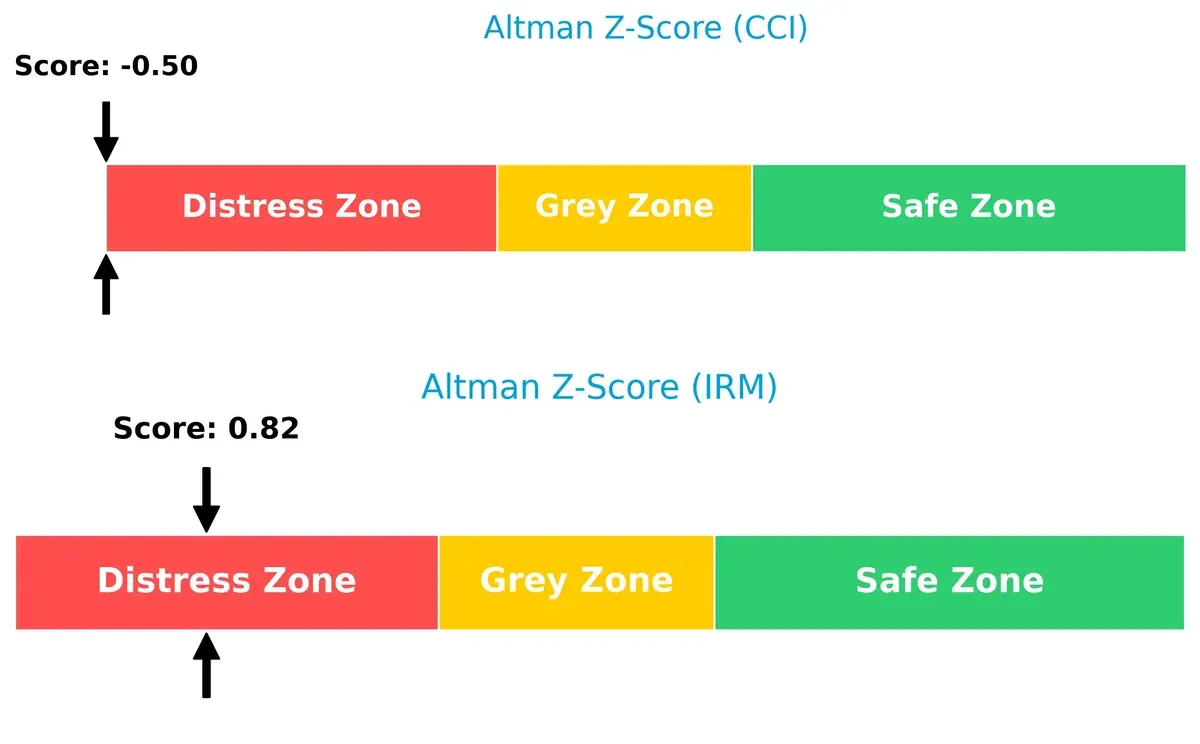
Both firms signal elevated bankruptcy risk amid current market volatility. Iron Mountain’s marginally higher score suggests a slightly better buffer against insolvency, but neither company commands strong financial safety in this cycle.
Financial Health: Quality of Operations
Piotroski F-Scores of 5 for both Crown Castle and Iron Mountain indicate average financial health without clear red flags:
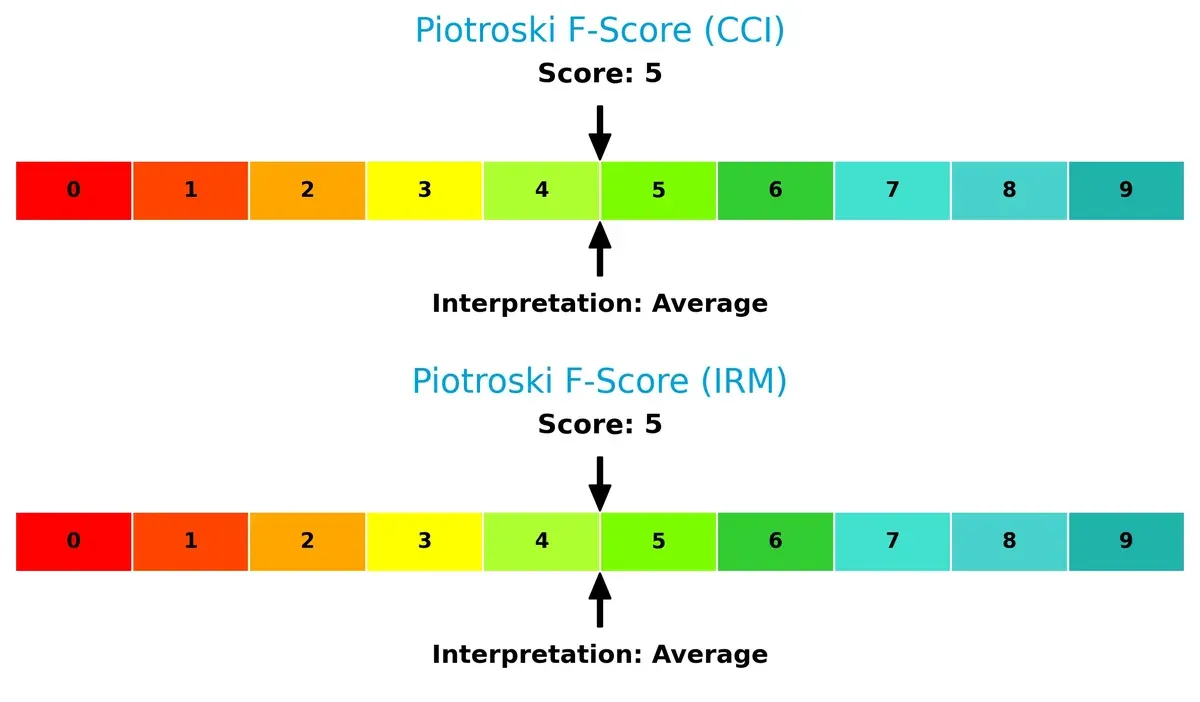
Neither firm demonstrates peak operational quality. The identical middling scores reflect moderate profitability and efficiency, with no firm showing decisive superiority in internal financial strength. Investors should remain cautious given these neutral signals.
How are the two companies positioned?
This section dissects CCI and IRM’s operational DNA by comparing revenue distribution and internal dynamics—strengths and weaknesses. The goal is to confront their economic moats to reveal which model delivers the most resilient competitive advantage today.
Revenue Segmentation: The Strategic Mix
The following visual comparison dissects how Crown Castle Inc. and Iron Mountain Incorporated diversify their income streams and where their primary sector bets lie:
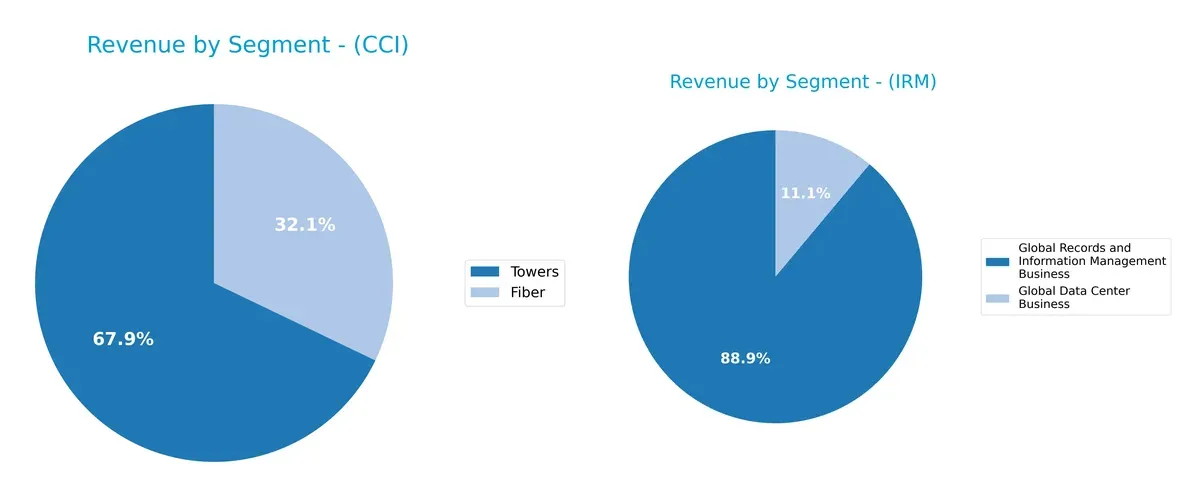
Crown Castle Inc. anchors its revenue heavily on Towers, generating $4.46B in 2024, with Fiber trailing at $2.11B, signaling a strong infrastructure dominance. Iron Mountain leans more on its Global Records and Information Management Business with $5.0B, while its Data Center segment remains smaller at $620M. Crown Castle’s concentrated tower revenue suggests ecosystem lock-in, whereas Iron Mountain’s split reveals moderate diversification but exposes dependence on one core segment.
Strengths and Weaknesses Comparison
This table compares the Strengths and Weaknesses of Crown Castle Inc. and Iron Mountain Incorporated:
CCI Strengths
- Diversified revenue from Fiber and Towers segments
- Strong ROE of 2934.59% indicates effective capital use
- Favorable debt to equity ratio supports leverage management
IRM Strengths
- Diversified business lines in Data Center and Records Management
- Favorable WACC of 7.25% suggests efficient capital cost control
- Favorable PB ratio indicates market confidence
CCI Weaknesses
- Negative net margin (-59.42%) signals profitability issues
- Low liquidity ratios (current and quick ratio at 0.5) pose short-term risks
- High debt to assets at 90.46% raises solvency concerns
- Unfavorable asset turnover reflects operational inefficiency
IRM Weaknesses
- Negative ROE (-35.81%) and low interest coverage (1.33) indicate financial stress
- Unfavorable net margin (2.93%) and high PE ratio (171.16) question valuation
- High debt to assets at 87.46% may limit financial flexibility
Both companies show diversification but face profitability and liquidity challenges. CCI’s strong ROE contrasts with its weak margins and liquidity, while IRM struggles with returns and interest coverage despite efficient capital costs. These factors highlight different strategic priorities in managing growth and financial stability.
The Moat Duel: Analyzing Competitive Defensibility
A structural moat shields long-term profits from relentless competition erosion. Without it, market share and margins erode swiftly:
Crown Castle Inc.: Infrastructure Scale & Network Effects
Crown Castle’s moat relies on its vast U.S. cell tower and fiber network, creating high switching costs. Its stable gross margin (66%) signals pricing power. However, declining revenue growth (-35% in 2025) threatens future moat strength unless it innovates or expands fiber offerings.
Iron Mountain Incorporated: Intangible Assets & Diversified Services
Iron Mountain’s moat stems from secure records storage and information management, backed by a vast global network. Unlike Crown Castle, IRM’s moat hinges on trust and regulatory compliance. Despite rising revenue (+12% in 2024), its shrinking margins and very unfavorable ROIC vs. WACC reveal weakening capital efficiency.
Infrastructure Scale vs. Trust & Compliance: The Moat Face-Off
Crown Castle boasts a wider moat through tangible infrastructure and network effects, while Iron Mountain’s intangible moat faces margin pressure. Crown Castle appears better positioned to defend market share amid evolving technology demands.
Which stock offers better returns?
The past year reveals contrasting trajectories: Crown Castle Inc. (CCI) faces a sustained decline with decelerating losses, while Iron Mountain Incorporated (IRM) accelerates upward, reflecting strong bullish momentum.
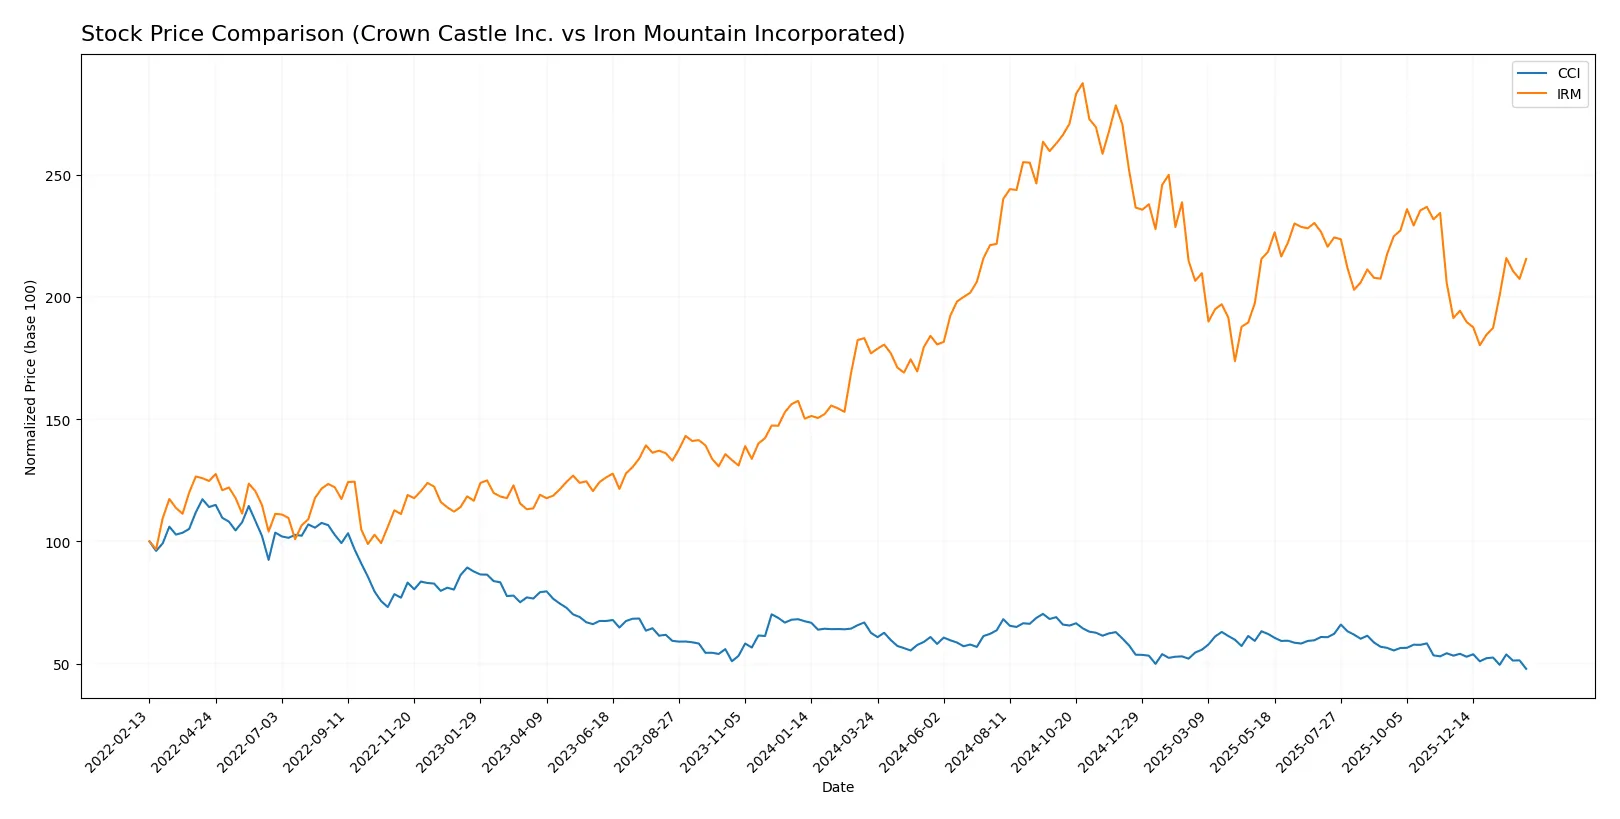
Trend Comparison
Crown Castle Inc. (CCI) shows a bearish trend over 12 months, losing 23.53% in value with decelerating decline. Its price ranged from $118.85 to $80.88, signaling prolonged weakness despite an increasing volume trend.
Iron Mountain Incorporated (IRM) posted a bullish trend over 12 months, gaining 21.84%. The upward acceleration accompanied a wider price range of $75.1 to $127.7 and higher volatility, confirming robust market interest.
Comparing both, IRM delivered significantly higher returns with a 21.84% gain versus CCI’s 23.53% loss, clearly outperforming in market performance over the period.
Target Prices
Analysts present a clear upside for Crown Castle Inc. and Iron Mountain Incorporated based on current consensus targets.
| Company | Target Low | Target High | Consensus |
|---|---|---|---|
| Crown Castle Inc. | 91 | 127 | 106.5 |
| Iron Mountain Incorporated | 120 | 126 | 123 |
Crown Castle’s consensus target of 106.5 implies a 32% upside from its current 80.88 price. Iron Mountain’s 123 target suggests a 28% gain above the current 95.78 price. Both reflect strong analyst confidence.

Don’t Let Luck Decide Your Entry Point
Optimize your entry points with our advanced ProRealTime indicators. You’ll get efficient buy signals with precise price targets for maximum performance. Start outperforming now!
How do institutions grade them?
Crown Castle Inc. Grades
The following table summarizes Crown Castle Inc.’s recent institutional grades and actions:
| Grading Company | Action | New Grade | Date |
|---|---|---|---|
| Citigroup | Maintain | Buy | 2026-02-06 |
| UBS | Maintain | Buy | 2026-02-05 |
| Scotiabank | Maintain | Sector Perform | 2026-02-05 |
| Wells Fargo | Maintain | Overweight | 2026-02-05 |
| JP Morgan | Maintain | Neutral | 2026-02-05 |
| Jefferies | Maintain | Buy | 2026-02-04 |
| Keybanc | Maintain | Overweight | 2026-01-21 |
| UBS | Maintain | Buy | 2026-01-20 |
| Goldman Sachs | Maintain | Neutral | 2026-01-20 |
| Scotiabank | Maintain | Sector Perform | 2026-01-14 |
Iron Mountain Incorporated Grades
The following table summarizes Iron Mountain Incorporated’s recent institutional grades and actions:
| Grading Company | Action | New Grade | Date |
|---|---|---|---|
| Barclays | Maintain | Overweight | 2025-11-12 |
| JP Morgan | Maintain | Overweight | 2025-11-06 |
| Barclays | Maintain | Overweight | 2025-08-20 |
| JP Morgan | Maintain | Overweight | 2025-08-07 |
| Barclays | Maintain | Overweight | 2025-05-27 |
| Barclays | Maintain | Overweight | 2025-03-20 |
| JP Morgan | Maintain | Overweight | 2025-02-18 |
| Wells Fargo | Maintain | Overweight | 2025-02-04 |
| Barclays | Maintain | Overweight | 2025-01-28 |
| RBC Capital | Maintain | Outperform | 2024-11-27 |
Which company has the best grades?
Crown Castle shows a mix of Buy and Sector Perform ratings, while Iron Mountain consistently receives Overweight and Outperform grades. Iron Mountain’s stronger consensus could suggest more bullish institutional sentiment.
Risks specific to each company
The following categories identify critical pressure points and systemic threats facing both firms in the 2026 market environment:
1. Market & Competition
Crown Castle Inc.
- Operates in a growing telecom infrastructure market with rising demand for fiber, but faces intense competition from new entrants and tech alternatives.
Iron Mountain Incorporated
- Faces digital transformation pressures reducing demand for physical storage; competes with cloud providers and data management startups.
2. Capital Structure & Debt
Crown Castle Inc.
- High debt-to-assets ratio at 90.46% signals leverage risk despite favorable debt-to-equity score; interest coverage is moderate at 2.17x.
Iron Mountain Incorporated
- Also highly leveraged with 87.46% debt-to-assets; weaker interest coverage at 1.33x raises concerns about debt servicing capacity.
3. Stock Volatility
Crown Castle Inc.
- Beta near 1 (0.984) indicates stock moves closely with market, suggesting moderate volatility.
Iron Mountain Incorporated
- Higher beta of 1.179 signals greater sensitivity to market swings and increased stock volatility risk.
4. Regulatory & Legal
Crown Castle Inc.
- Subject to telecom infrastructure regulations; risks from zoning, environmental, and privacy laws but typically stable regulatory environment.
Iron Mountain Incorporated
- Faces stringent data privacy and security regulations globally; compliance costs and legal risks are material and increasing.
5. Supply Chain & Operations
Crown Castle Inc.
- Relies on technology and construction supply chains; potential disruption risks but benefits from scale and long-term leases.
Iron Mountain Incorporated
- Operations dependent on physical facilities and logistics; supply chain disruptions or facility closures could impact service delivery.
6. ESG & Climate Transition
Crown Castle Inc.
- Infrastructure carbon footprint under scrutiny; opportunities in green energy-powered networks but transition costs remain.
Iron Mountain Incorporated
- Data centers and storage facilities face energy intensity challenges; ESG pressures to reduce environmental impact and improve sustainability.
7. Geopolitical Exposure
Crown Castle Inc.
- Primarily U.S.-focused, limiting geopolitical risks but exposed to domestic political shifts affecting telecom policy.
Iron Mountain Incorporated
- Global footprint across 50 countries increases geopolitical risk, including trade tensions, regulatory variance, and regional instability.
Which company shows a better risk-adjusted profile?
Crown Castle’s greatest risk is its high leverage paired with moderate interest coverage, risking financial strain if market conditions worsen. Iron Mountain faces critical risks from regulatory complexity and weaker debt servicing ability. Despite both in distress zone for Altman Z-score, Crown Castle shows a slightly better risk-adjusted profile due to lower stock volatility and more stable regulatory environment. The recent surge in Iron Mountain’s stock volatility and weak interest coverage justify heightened concern over its financial resilience.
Final Verdict: Which stock to choose?
Crown Castle Inc. (CCI) excels as a cash-generating infrastructure giant with a robust return on equity, signaling strong capital deployment. Its point of vigilance lies in the stretched balance sheet and liquidity ratios, which may pressure financial flexibility. CCI suits investors targeting aggressive growth backed by asset-heavy operations.
Iron Mountain Incorporated (IRM) commands a strategic moat through its data storage and information management services, offering recurring revenue that cushions volatility. Although its profitability metrics lag CCI’s, IRM provides a safer profile with steadier cash flow stability. This makes it a fit for GARP investors seeking moderate growth with income.
If you prioritize dynamic capital efficiency and aggressive expansion, CCI is the compelling choice due to its superior equity returns despite leverage concerns. However, if you seek stable cash flows and defensive positioning in a specialized sector, IRM offers better stability and strategic resilience, albeit at a valuation premium. Both stocks carry risks, requiring careful portfolio alignment.
Disclaimer: Investment carries a risk of loss of initial capital. The past performance is not a reliable indicator of future results. Be sure to understand risks before making an investment decision.
Go Further
I encourage you to read the complete analyses of Crown Castle Inc. and Iron Mountain Incorporated to enhance your investment decisions: