Home > Comparison > Real Estate > EQIX vs CCI
The strategic rivalry between Equinix, Inc. and Crown Castle Inc. defines the current trajectory of the specialty REIT sector. Equinix operates a global digital infrastructure platform, capitalizing on data center interconnections. Crown Castle, by contrast, focuses on communication towers and fiber networks, emphasizing nationwide wireless infrastructure. This analysis explores their distinct operational models and competitive positioning to identify which offers superior risk-adjusted returns for a diversified portfolio in 2026.
Table of contents
Companies Overview
Equinix and Crown Castle stand as pillars in the U.S. specialty REIT sector, driving critical digital and communications infrastructure.
Equinix, Inc.: The Digital Infrastructure Powerhouse
Equinix leads as a global digital infrastructure company, generating revenue by enabling businesses to interconnect at its extensive data center platform. In 2026, the firm strategically focuses on expanding its ecosystem, allowing clients to scale digital services rapidly and unlock network effects essential to the digital economy.
Crown Castle Inc.: The Communications Backbone
Crown Castle operates as a major owner and operator of cell towers and fiber networks across the U.S., monetizing its vast communications infrastructure. The company’s 2026 strategy emphasizes enhancing fiber solutions and small cell deployments to meet surging wireless data demand in urban and suburban markets.
Strategic Collision: Similarities & Divergences
Both companies invest heavily in specialty REIT infrastructure but diverge in approach: Equinix builds a tightly integrated digital ecosystem, while Crown Castle focuses on expansive, open communications networks. Their competitive front centers on serving digital and wireless data needs, but their distinct assets create unique risk and return profiles for investors.
Income Statement Comparison
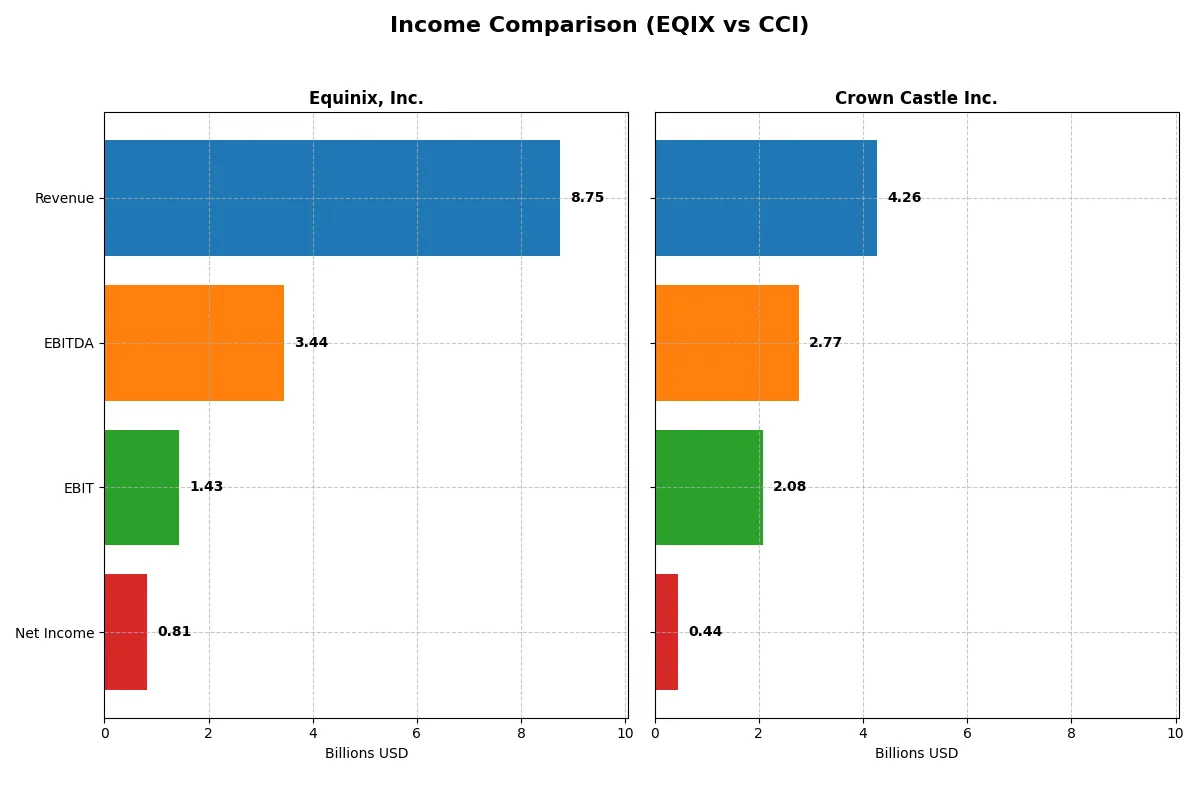
This data dissects the core profitability and scalability of both corporate engines to reveal who dominates the bottom line:
| Metric | Equinix, Inc. (EQIX) | Crown Castle Inc. (CCI) |
|---|---|---|
| Revenue | 8.75B | 4.27B |
| Cost of Revenue | 4.47B | 1.45B |
| Operating Expenses | 2.95B | 739M |
| Gross Profit | 4.28B | 2.82B |
| EBITDA | 3.44B | 2.77B |
| EBIT | 1.43B | 2.08B |
| Interest Expense | 457M | 959M |
| Net Income | 815M | 444M |
| EPS | 8.54 | 1.02 |
| Fiscal Year | 2024 | 2025 |
Income Statement Analysis: The Bottom-Line Duel
This income statement comparison reveals the true efficiency and profitability of Equinix and Crown Castle’s corporate engines over recent years.
Equinix, Inc. Analysis
Equinix’s revenue climbed steadily from 6B in 2020 to 8.7B in 2024, with net income rising 120% over five years to 815M in 2024. Gross margin holds firm near 49%, while net margin slipped to 9.3% in 2024 amid higher operating expenses. Despite a modest 7% revenue growth in 2024, net income and EPS declined, signaling pressure on profitability.
Crown Castle Inc. Analysis
Crown Castle’s revenue peaked above 6.9B in 2023 before plunging 35% to 4.3B in 2025, dragging gross profit down 40%. Yet, EBIT margin surged to nearly 49% in 2025, bolstered by leaner operating expenses. Net income swung from a -3.9B loss in 2024 to a positive 444M in 2025, reflecting sharp margin recovery despite heavy interest costs.
Margin Power vs. Revenue Scale
Equinix shows consistent revenue expansion and solid margin stability, although recent profit momentum weakened. Crown Castle reveals volatile top-line but impressive margin rebound and net income turnaround in 2025. Fundamentally, Equinix’s growth profile offers steadier earnings, while Crown Castle’s recent efficiency gains highlight turnaround potential. Investors must weigh steady growth against high-margin recovery risk.
Financial Ratios Comparison
These vital ratios act as a diagnostic tool to expose the underlying fiscal health, valuation premiums, and capital efficiency of the companies:
| Ratios | Equinix, Inc. (EQIX) | Crown Castle Inc. (CCI) |
|---|---|---|
| ROE | 6.0% | 29.3% |
| ROIC | 3.3% | -9.3% |
| P/E | 110.4 | -10.1 |
| P/B | 6.7 | -296.2 |
| Current Ratio | 1.63 | 0.50 |
| Quick Ratio | 1.63 | 0.50 |
| D/E | 1.40 | -222.7 |
| Debt-to-Assets | 54.0% | 90.5% |
| Interest Coverage | 2.91 | -3.26 |
| Asset Turnover | 0.25 | 0.20 |
| Fixed Asset Turnover | 0.42 | 0.31 |
| Payout Ratio | 201.6% | -69.9% |
| Dividend Yield | 1.83% | 6.93% |
| Fiscal Year | 2024 | 2024 |
Efficiency & Valuation Duel: The Vital Signs
Ratios act as a company’s DNA, unveiling hidden risks and operational excellence beyond surface-level financials.
Equinix, Inc.
Equinix shows moderate profitability with a 6.02% ROE and 9.32% net margin, yet valuation appears stretched, with a P/E of 110.44 and P/B of 6.65. The company maintains a solid current ratio at 1.63, supporting liquidity. Shareholders receive a modest 1.83% dividend yield, reflecting a balanced capital allocation approach.
Crown Castle Inc.
Crown Castle displays volatile profitability with an extreme 2934.59% ROE but a deeply negative net margin of -59.42%, signaling financial instability. Valuation metrics like P/E and P/B are negative but marked favorable due to accounting distortions. The current ratio of 0.5 flags liquidity concerns, yet a 6.93% dividend yield offers strong shareholder returns amid operational risks.
Premium Valuation vs. Operational Safety
Equinix’s stretched valuation contrasts with Crown Castle’s risky financial profile and liquidity shortfall. Equinix offers a more stable risk-reward balance through consistent profitability and prudent liquidity. Investors seeking operational safety may prefer Equinix, while those chasing high dividend yield at higher risk might consider Crown Castle.
Which one offers the Superior Shareholder Reward?
I see Equinix (EQIX) delivers a modest 1.8% dividend yield with a payout ratio above 140%, signaling aggressive distribution but modest free cash flow coverage. Its buyback program remains subdued, limiting total shareholder return upside. Crown Castle (CCI) offers a robust 6.9% yield, backed by a solid payout ratio below 70% and strong buyback activity pre-2024. Despite CCI’s 2024 profit dip and high leverage, its distribution model appears more sustainable, balancing dividends and buybacks. I conclude Crown Castle provides a superior total shareholder reward profile for 2026 investors.
Comparative Score Analysis: The Strategic Profile
The radar chart reveals the fundamental DNA and trade-offs of Equinix and Crown Castle, highlighting their financial strengths and vulnerabilities:
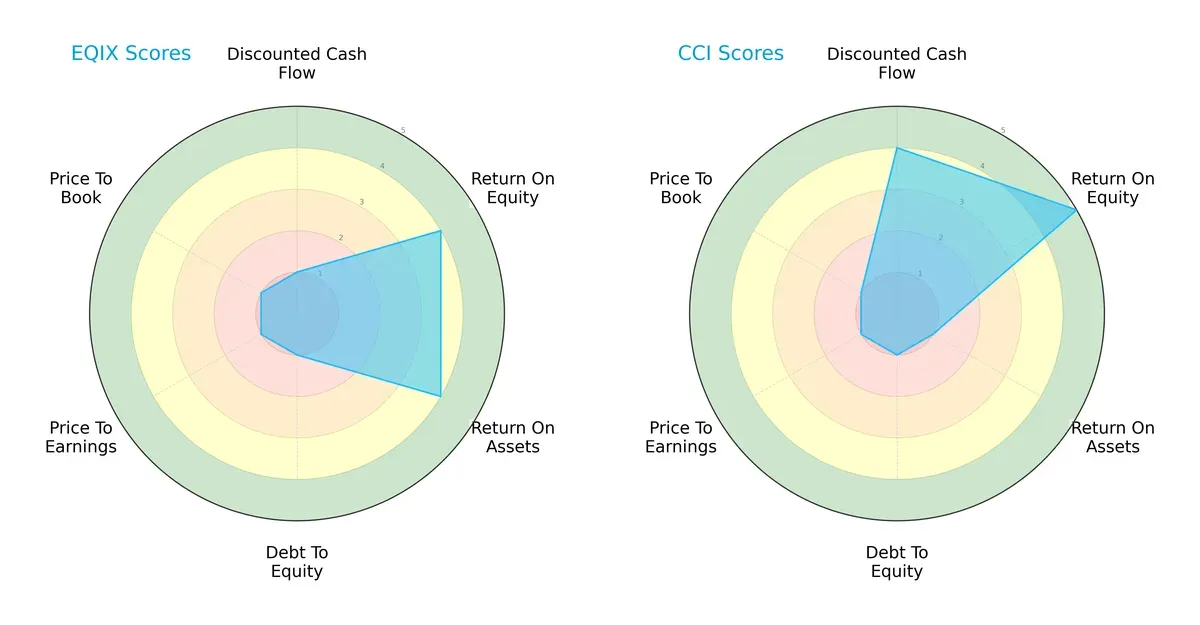
Equinix shows balanced operational efficiency with strong ROE and ROA scores (4 each), but weak valuation and leverage metrics (all score 1). Crown Castle boasts a superior ROE (5) and strong DCF score (4), yet suffers from poor asset utilization (ROA 1) and identical debt and valuation weaknesses. Equinix presents a more balanced profile, while Crown Castle relies heavily on its equity returns and cash flow edge.
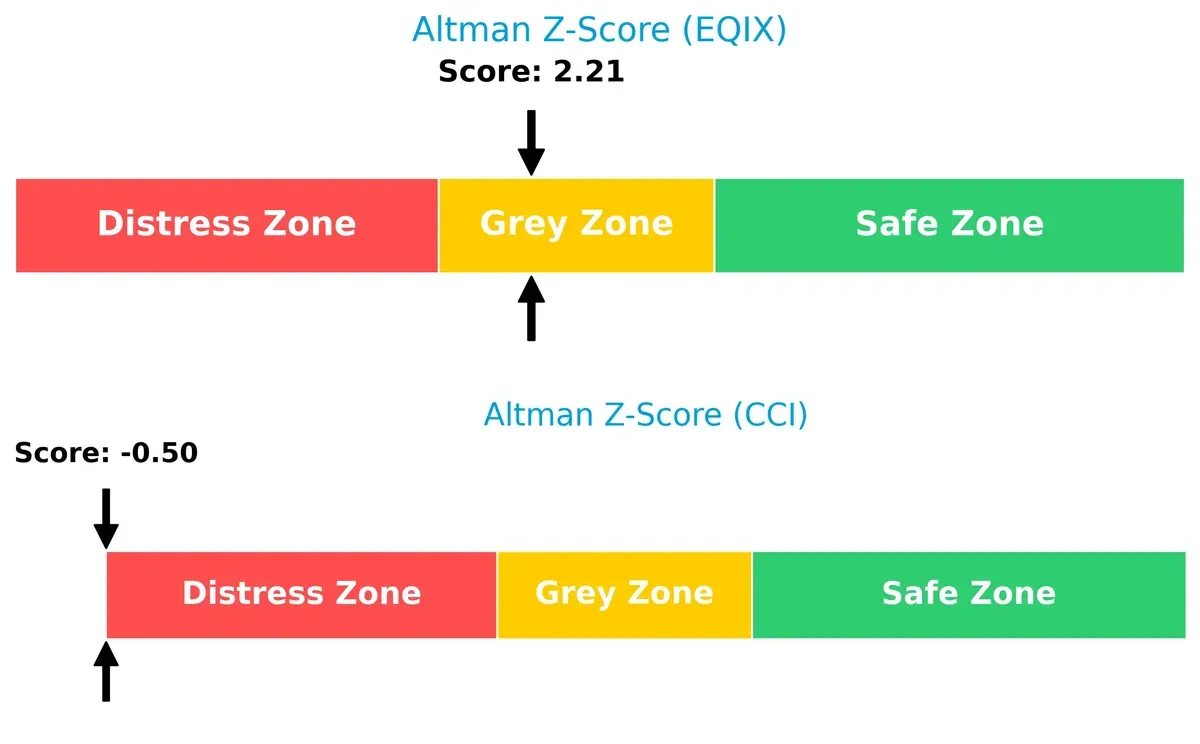
Bankruptcy Risk: Solvency Showdown
Equinix’s Altman Z-Score of 2.21 places it in the grey zone, signaling moderate bankruptcy risk. Crown Castle’s -0.50 score lands in the distress zone, indicating a higher risk of financial distress:
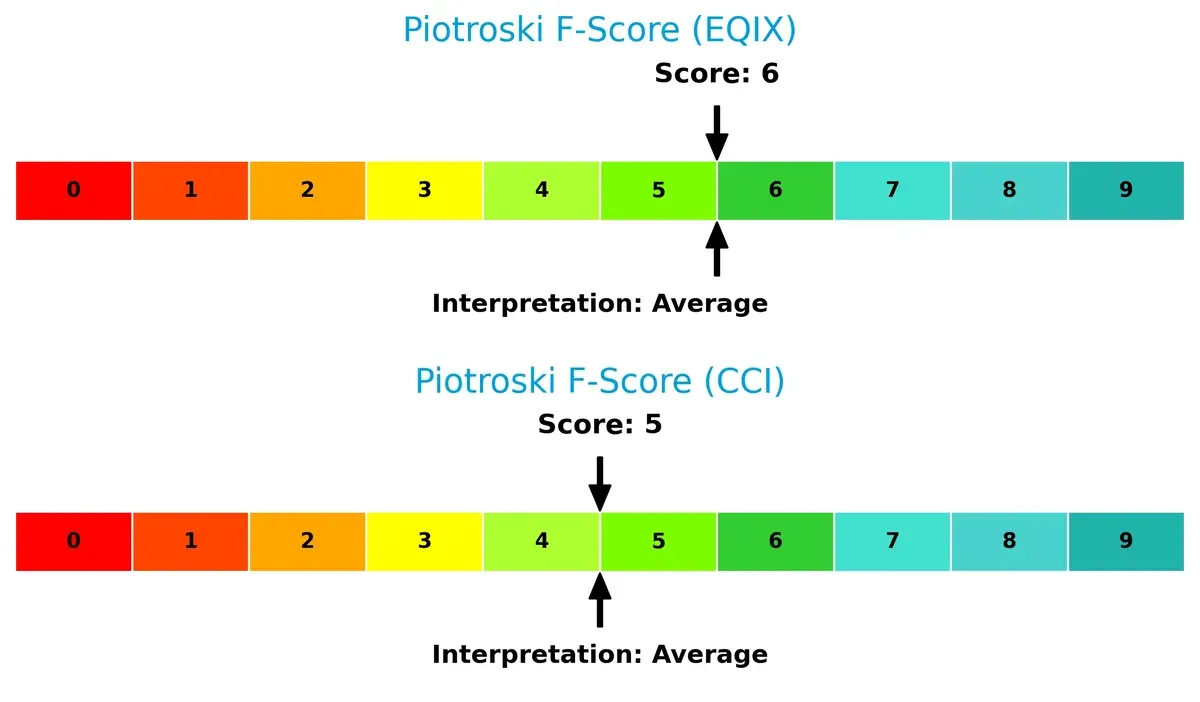
Financial Health: Quality of Operations
Both companies score similarly on Piotroski’s scale, with Equinix at 6 and Crown Castle at 5, reflecting average financial health. Neither shows acute red flags, but Equinix holds a slight edge in operational quality:
How are the two companies positioned?
This section dissects the operational DNA of Equinix and Crown Castle by comparing their revenue distribution and internal dynamics. The goal is to confront their economic moats to identify which model offers the most resilient, sustainable competitive advantage today.
Revenue Segmentation: The Strategic Mix
This visual comparison dissects how Equinix, Inc. and Crown Castle Inc. diversify their income streams and where their primary sector bets lie:
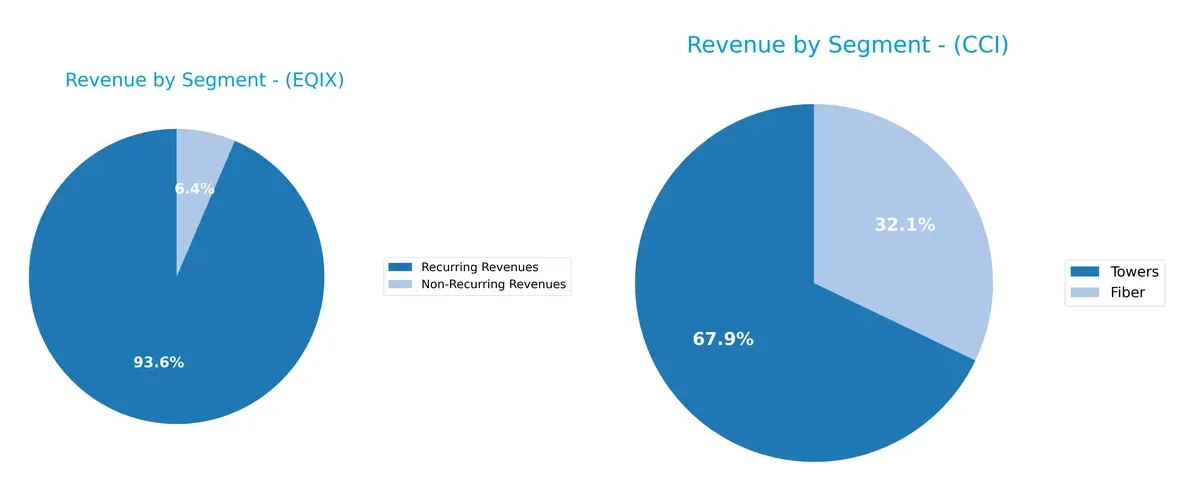
Equinix pivots on Co-Location, generating $5.8B in 2023, dwarfing its Interconnection ($1.4B) and Managed Infrastructure ($450M). This concentration anchors its ecosystem lock-in strategy. Crown Castle’s revenue splits between Towers ($4.5B) and Fiber ($2.1B), showing a more balanced mix. This diversification mitigates concentration risk and strengthens infrastructure dominance in wireless and fiber assets. Equinix’s focus risks dependency; Crown Castle enjoys broader sector coverage.
Strengths and Weaknesses Comparison
This table compares the strengths and weaknesses of Equinix, Inc. and Crown Castle Inc. based on diversification, profitability, financials, innovation, global presence, and market share:
Equinix Strengths
- Diversified revenue streams across Co-Location, Interconnection, and Managed Infrastructure
- Global presence spanning Americas, Asia Pacific, and EMEA
- Favorable current and quick ratios indicating liquidity
- Stable net margin around 9.3%
- Market leader in data center services
Crown Castle Strengths
- Strong market share in Towers and Fiber assets
- Exceptional ROE at 2934.6% despite other metrics
- Favorable P/E and P/B ratios reflecting market optimism
- High dividend yield near 6.9% attractive for income investors
- Focused asset base on towers and fiber infrastructure
Equinix Weaknesses
- Unfavorable ROE and ROIC below WACC indicating weak capital efficiency
- High debt-to-assets ratio at 54% raises leverage concerns
- Elevated P/E and P/B ratios suggest overvaluation risk
- Low asset turnover implies inefficiency in asset use
- Moderate interest coverage ratio limits financial flexibility
Crown Castle Weaknesses
- Negative net margin at -59.4% signals profitability issues
- Unfavorable ROIC and high debt-to-assets ratio near 90% highlight risk
- Weak liquidity with current and quick ratios at 0.5
- Negative debt-to-equity ratio requires further scrutiny
- Lower asset turnover and fixed asset turnover than sector peers
Both companies display core strengths in their market segments but face financial challenges. Equinix’s global diversification and liquidity contrast with Crown Castle’s concentrated infrastructure and exceptional ROE. Both exhibit leverage and profitability concerns that could impact strategic decisions.
The Moat Duel: Analyzing Competitive Defensibility
A structural moat shields long-term profits from relentless competitive erosion. Its quality defines a company’s survival and growth prospects:
Equinix, Inc.: Network Effects Powerhouse
Equinix leverages its vast global data center ecosystem, creating strong network effects. This leads to stable margins and improving profitability despite value destruction signals. Expansion in Asia Pacific deepens its moat in 2026.
Crown Castle Inc.: Cost Advantage in Fiber and Towers
Crown Castle’s moat stems from its extensive fiber and tower infrastructure, a capital-intensive cost advantage. Its positioning drives high gross and EBIT margins, though recent revenue declines and ROIC erosion pose risks. Growth hinges on 5G small cell deployments.
Network Effects vs. Capital-Intensive Scale: Who Holds the Moat Edge?
Equinix’s growing ROIC trend and global footprint suggest a wider, more resilient moat than Crown Castle’s shrinking returns despite high margins. Equinix appears better equipped to defend and expand its market share in digital infrastructure.
Which stock offers better returns?
Over the past year, both Equinix, Inc. and Crown Castle Inc. experienced bearish trends with notable price fluctuations and contrasting recent momentum.
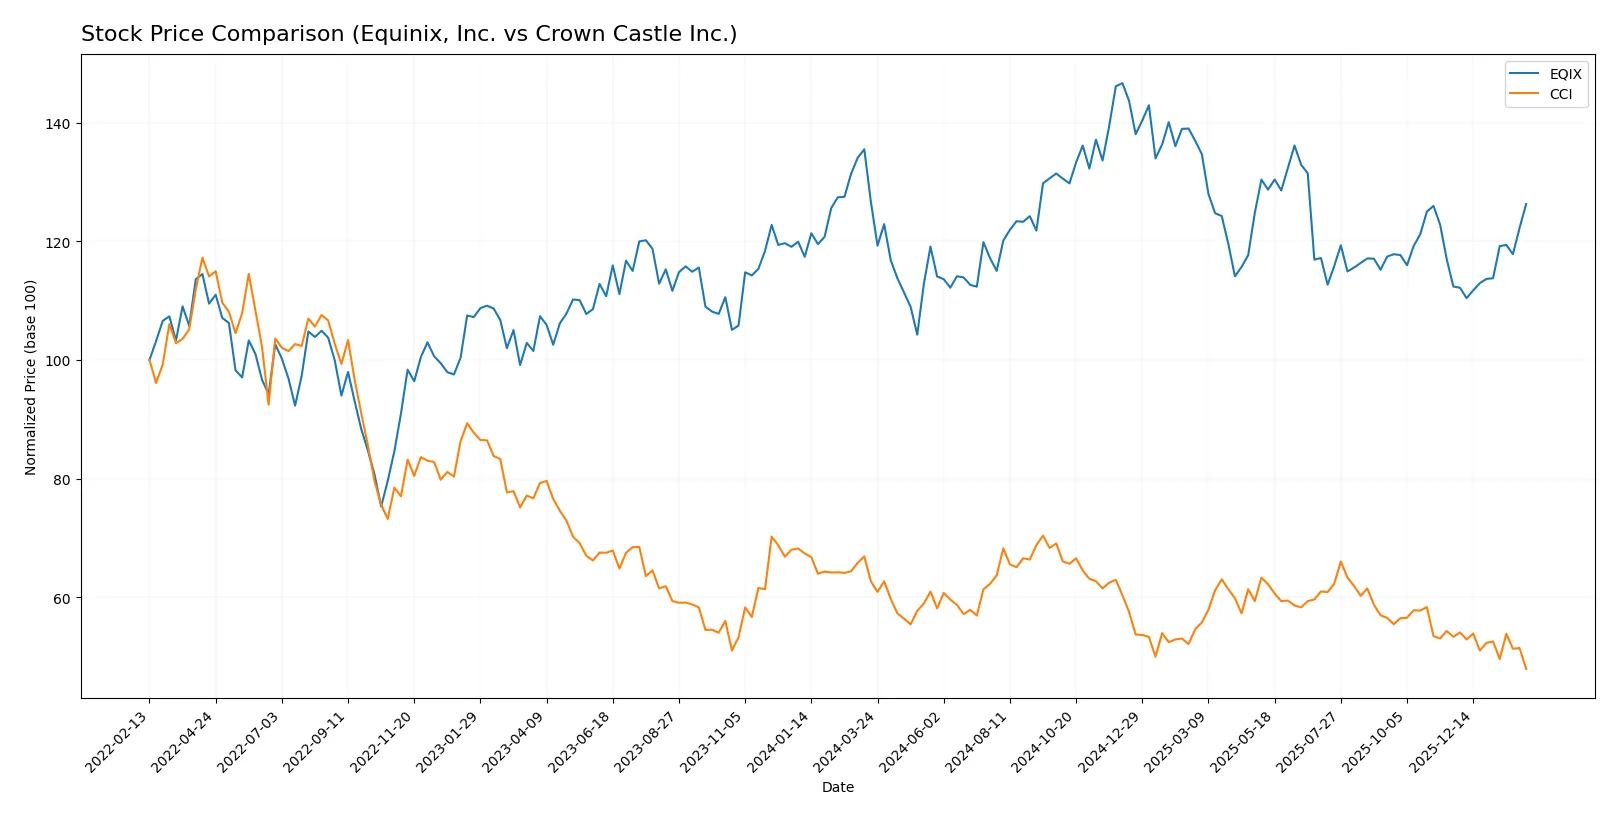
Trend Comparison
Equinix, Inc. shows a slight overall price decline of -0.27% over the last 12 months, indicating a bearish trend with accelerating downward momentum and high volatility.
Crown Castle Inc. suffered a significant drop of -23.53%, confirming a bearish trend with decelerating losses and relatively low volatility compared to Equinix.
Equinix delivered a far better market performance than Crown Castle, with a near-flat annual return versus Crown Castle’s steep decline.
Target Prices
Analysts project moderate upside potential for Equinix, Inc. and Crown Castle Inc. based on current consensus targets.
| Company | Target Low | Target High | Consensus |
|---|---|---|---|
| Equinix, Inc. | 795 | 1050 | 922.38 |
| Crown Castle Inc. | 91 | 127 | 106.5 |
Equinix’s consensus target stands roughly 9% above its current price of 848, suggesting room for growth. Crown Castle’s consensus target exceeds the current price of 80.88 by nearly 32%, reflecting strong analyst optimism.

Don’t Let Luck Decide Your Entry Point
Optimize your entry points with our advanced ProRealTime indicators. You’ll get efficient buy signals with precise price targets for maximum performance. Start outperforming now!
How do institutions grade them?
The following tables summarize the latest institutional grades for Equinix, Inc. and Crown Castle Inc.:
Equinix, Inc. Grades
This table shows recent grade updates from well-known financial institutions for Equinix:
| Grading Company | Action | New Grade | Date |
|---|---|---|---|
| Scotiabank | Maintain | Sector Outperform | 2026-01-14 |
| BMO Capital | Upgrade | Outperform | 2025-12-03 |
| Truist Securities | Maintain | Buy | 2025-11-18 |
| TD Cowen | Maintain | Buy | 2025-10-30 |
| JP Morgan | Maintain | Overweight | 2025-10-30 |
| Barclays | Maintain | Equal Weight | 2025-08-20 |
| Truist Securities | Maintain | Buy | 2025-08-07 |
| JP Morgan | Maintain | Overweight | 2025-07-31 |
| JMP Securities | Maintain | Market Outperform | 2025-07-22 |
| Barclays | Maintain | Equal Weight | 2025-07-11 |
Crown Castle Inc. Grades
This table presents recent institutional grades for Crown Castle Inc. from major firms:
| Grading Company | Action | New Grade | Date |
|---|---|---|---|
| Citigroup | Maintain | Buy | 2026-02-06 |
| UBS | Maintain | Buy | 2026-02-05 |
| Scotiabank | Maintain | Sector Perform | 2026-02-05 |
| Wells Fargo | Maintain | Overweight | 2026-02-05 |
| JP Morgan | Maintain | Neutral | 2026-02-05 |
| Jefferies | Maintain | Buy | 2026-02-04 |
| Keybanc | Maintain | Overweight | 2026-01-21 |
| UBS | Maintain | Buy | 2026-01-20 |
| Goldman Sachs | Maintain | Neutral | 2026-01-20 |
| Scotiabank | Maintain | Sector Perform | 2026-01-14 |
Which company has the best grades?
Equinix holds a stronger consensus with multiple “Buy” and “Outperform” ratings, signaling higher institutional confidence. Crown Castle’s grades cluster around “Buy” and “Sector Perform,” indicating a more cautious outlook. This difference may influence investor perception and portfolio positioning.
Risks specific to each company
The following categories identify the critical pressure points and systemic threats facing both firms in the 2026 market environment:
1. Market & Competition
Equinix, Inc.
- Faces intense competition in digital infrastructure with high valuation multiples signaling market pressure.
Crown Castle Inc.
- Operates in a competitive wireless infrastructure space with lower valuation but struggling net margins.
2. Capital Structure & Debt
Equinix, Inc.
- Leverages significant debt with a debt-to-assets ratio of 54%, raising financial risk concerns.
Crown Castle Inc.
- Carries even higher leverage at 90% debt-to-assets, indicating substantial financial strain and risk.
3. Stock Volatility
Equinix, Inc.
- Beta at 1.07 suggests volatility slightly above market average, reflecting sensitivity to economic cycles.
Crown Castle Inc.
- Beta near 0.98 indicates stock volatility closely aligned with the broad market, slightly less risky.
4. Regulatory & Legal
Equinix, Inc.
- Subject to data privacy and digital infrastructure regulations, increasing compliance costs.
Crown Castle Inc.
- Faces regulatory scrutiny on wireless infrastructure and fiber deployment, impacting expansion pace.
5. Supply Chain & Operations
Equinix, Inc.
- Relies on global digital infrastructure supply chains vulnerable to tech component shortages.
Crown Castle Inc.
- Depends on physical tower and fiber network maintenance, exposed to operational disruptions.
6. ESG & Climate Transition
Equinix, Inc.
- Growing pressure to reduce data center carbon footprint and improve energy efficiency.
Crown Castle Inc.
- Must address environmental impact of extensive physical infrastructure and energy use.
7. Geopolitical Exposure
Equinix, Inc.
- Global presence exposes it to geopolitical risks including trade tensions affecting tech flows.
Crown Castle Inc.
- Primarily U.S.-focused, but vulnerable to domestic policy shifts and regional infrastructure regulations.
Which company shows a better risk-adjusted profile?
Equinix’s moderate leverage and global digital niche position it better despite valuation risks. Crown Castle’s extreme debt levels and operational fragility weigh heavily on its risk profile. Both face regulatory and market challenges, but Crown Castle’s distress-level Altman Z-score signals higher bankruptcy risk.
Final Verdict: Which stock to choose?
Equinix, Inc. wields unmatched operational efficiency and a robust cash flow profile that supports steady growth. Its rising profitability hints at strengthening fundamentals. A point of vigilance remains its elevated debt levels, which could pressure financial flexibility. This stock suits portfolios targeting aggressive growth with a tolerance for leverage risk.
Crown Castle Inc. benefits from a strategic moat anchored in infrastructure scale and recurring revenue streams, offering a safer income profile than Equinix. Yet, its declining capital returns and liquidity concerns suggest cautious monitoring. It fits well within GARP (Growth at a Reasonable Price) strategies seeking stability with moderate growth potential.
If you prioritize growth fueled by operational excellence, Equinix outshines with improving returns despite leverage challenges. However, if you seek income stability and a resilient moat, Crown Castle offers better downside protection, albeit with caution on its capital efficiency. Each presents a distinct risk-reward profile aligned with different investor appetites.
Disclaimer: Investment carries a risk of loss of initial capital. The past performance is not a reliable indicator of future results. Be sure to understand risks before making an investment decision.
Go Further
I encourage you to read the complete analyses of Equinix, Inc. and Crown Castle Inc. to enhance your investment decisions: