CRH plc and Vulcan Materials Company are leading players in the construction materials industry, offering essential building products and innovative solutions. While CRH operates globally with a diverse portfolio, Vulcan focuses primarily on the US market with strong expertise in aggregates and asphalt. This comparison will explore their market positions, growth strategies, and innovation efforts to help you identify which company presents the most compelling investment opportunity in 2026.

Table of contents
Companies Overview
I will begin the comparison between CRH and Vulcan Materials Company by providing an overview of these two companies and their main differences.
CRH Overview
CRH plc, founded in 1936 and based in Dublin, Ireland, operates as a global building materials provider. Its mission centers on delivering building materials solutions across Ireland, the US, the UK, and Europe, covering public infrastructure, commercial and residential buildings. CRH’s diverse offerings include aggregates, cement, ready-mixed concrete, asphalt, and value-added construction solutions, supported by a workforce of 79,800 employees.
Vulcan Materials Company Overview
Vulcan Materials Company, headquartered in Birmingham, Alabama, was founded in 1909 and focuses primarily on producing and supplying construction aggregates in the United States. Its operations span four segments: Aggregates, Asphalt, Concrete, and Calcium. Vulcan serves various infrastructure projects, housing, and industrial construction, with a workforce of 11,971 employees and a significant presence in multiple US states.
Key similarities and differences
Both companies operate within the construction materials industry, supplying aggregates, concrete, and asphalt for infrastructure and building projects. CRH maintains a broader international footprint and a wider product range, including specialized precast and polymer-based products. In contrast, Vulcan concentrates largely on the US market with a focus on aggregates and calcium products. Their business models emphasize supplying essential materials for construction but differ in geographic scale and product diversification.
Income Statement Comparison
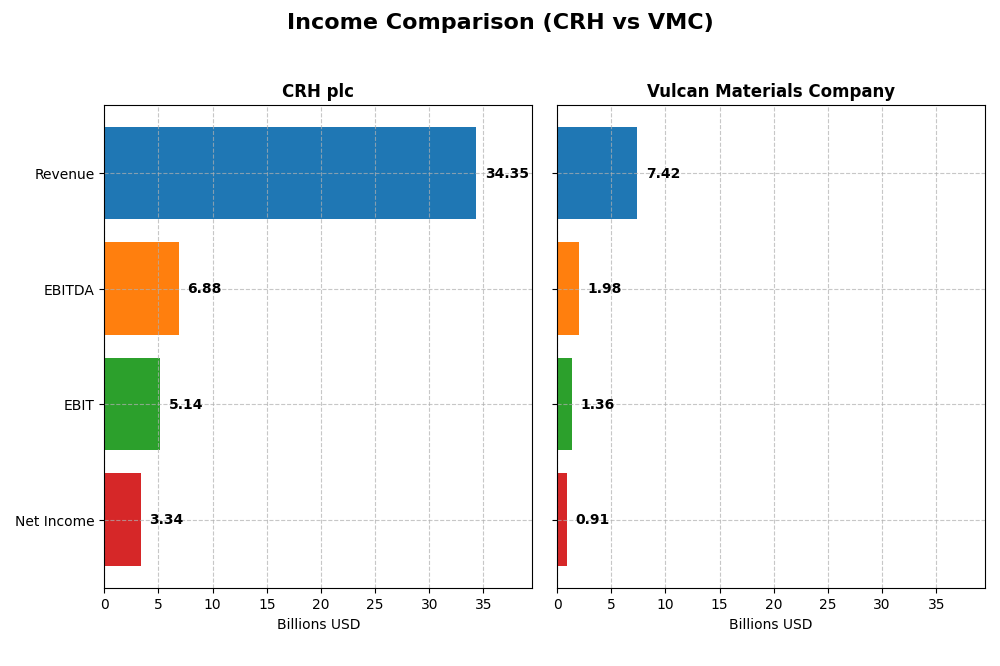
The table below compares the key income statement metrics for CRH plc and Vulcan Materials Company for the fiscal year 2024, providing a snapshot of their financial performance.
| Metric | CRH plc | Vulcan Materials Company |
|---|---|---|
| Market Cap | 83.4B | 39.5B |
| Revenue | 34.4B | 7.4B |
| EBITDA | 6.9B | 2.0B |
| EBIT | 5.1B | 1.4B |
| Net Income | 3.3B | 912M |
| EPS | 5.06 | 6.89 |
| Fiscal Year | 2024 | 2024 |
Income Statement Interpretations
CRH plc
CRH plc showed consistent growth in revenue and net income from 2020 to 2024, with revenue increasing by 52.55% and net income surging by 264.62%. Margins improved notably, with a gross margin of 35.71% and net margin of 9.72% in 2024. The latest year saw an 8.17% revenue rise and a 15.94% EPS growth, indicating accelerating profitability despite a slight unfavorable trend in operating expenses relative to revenue.
Vulcan Materials Company
Vulcan Materials Company experienced revenue growth of 52.73% over the 2020-2024 period, but reported a 4.68% revenue decline in 2024. Net income grew overall by 56.01%, with a 12.29% net margin in 2024. EBIT margin stood at 18.38%, reflecting operational efficiency. The recent year showed mixed signals: slight gross profit improvement but declines in EBIT and EPS, suggesting some short-term pressure despite solid longer-term gains.
Which one has the stronger fundamentals?
CRH plc demonstrates stronger fundamentals with broad favorable trends across revenue, net income, and margin expansions, accompanied by significant EPS growth and a high percentage of favorable income statement metrics. Vulcan Materials, while growing overall, shows recent setbacks in revenue and EBIT with more mixed margin performance. CRH’s consistent margin improvement and higher net income growth rate underline its more robust income statement fundamentals.
Financial Ratios Comparison
The table below presents a comparison of key financial ratios for CRH plc and Vulcan Materials Company based on their most recent fiscal year data, 2024.
| Ratios | CRH plc | Vulcan Materials Company |
|---|---|---|
| ROE | 16.0% | 11.2% |
| ROIC | 8.6% | 6.6% |
| P/E | 18.9 | 37.3 |
| P/B | 3.0 | 4.2 |
| Current Ratio | 1.37 | 1.83 |
| Quick Ratio | 0.91 | 1.28 |
| D/E | 0.71 | 0.72 |
| Debt-to-Assets | 30.2% | 34.1% |
| Interest Coverage | 8.0 | 7.1 |
| Asset Turnover | 0.70 | 0.43 |
| Fixed Asset Turnover | 1.57 | 0.83 |
| Payout Ratio | 49.3% | 26.8% |
| Dividend Yield | 2.60% | 0.72% |
Interpretation of the Ratios
CRH plc
CRH plc shows mostly neutral to favorable financial ratios, with a strong return on equity at 16% and interest coverage of 8.7, indicating solid profitability and debt servicing ability. However, the price-to-book ratio at 3.03 is unfavorable, suggesting the stock may be overvalued relative to its book value. The company pays a dividend with a 2.6% yield, reflecting a favorable payout supported by free cash flow, but investors should monitor payout sustainability.
Vulcan Materials Company
Vulcan Materials reports a favorable net margin of 12.29% and a strong current ratio of 1.83, indicating good operational efficiency and liquidity. However, the company faces challenges with a high price-to-earnings ratio of 37.32 and low dividend yield at 0.72%, both unfavorable. The return on equity is moderate at 11.23%, and while dividend payments exist, the yield and valuation metrics suggest cautious evaluation of shareholder returns.
Which one has the best ratios?
CRH plc presents a slightly favorable ratio profile with stronger profitability metrics and dividend yield compared to Vulcan Materials, which shows a more mixed picture with equal favorable and unfavorable ratios. CRH’s balance of profitability and conservative valuation contrasts with Vulcan’s higher valuation and lower returns, making CRH’s ratios generally more balanced for investors analyzing financial health.
Strategic Positioning
This section compares the strategic positioning of CRH and VMC, covering Market position, Key segments, and exposure to disruption:
CRH plc
- Leading global player with diversified operations across multiple regions, facing broad competitive pressures.
- Operates three segments: Americas Materials, Americas Building, International Solutions, with diverse product and service offerings.
- Moderate exposure to technological disruption with value-added concrete and polymer products for infrastructure and utilities.
Vulcan Materials Company
- Focused US-based leader with strong market share in aggregates, facing regional competitive pressure.
- Operates four segments: Aggregates, Asphalt, Concrete, and Calcium, concentrated in construction materials.
- Limited exposure to technological disruption, primarily focused on traditional construction aggregates.
CRH plc vs Vulcan Materials Company Positioning
CRH’s diversified global footprint and broad product portfolio contrast with VMC’s concentrated US-focused approach, offering CRH broader market exposure but also complexity, whereas VMC benefits from specialization but regional concentration.
Which has the best competitive advantage?
Both companies are shedding value, but CRH shows slightly favorable moat status with growing ROIC, while VMC’s moat status is slightly unfavorable despite improving profitability, indicating CRH currently holds a marginally better competitive advantage.
Stock Comparison
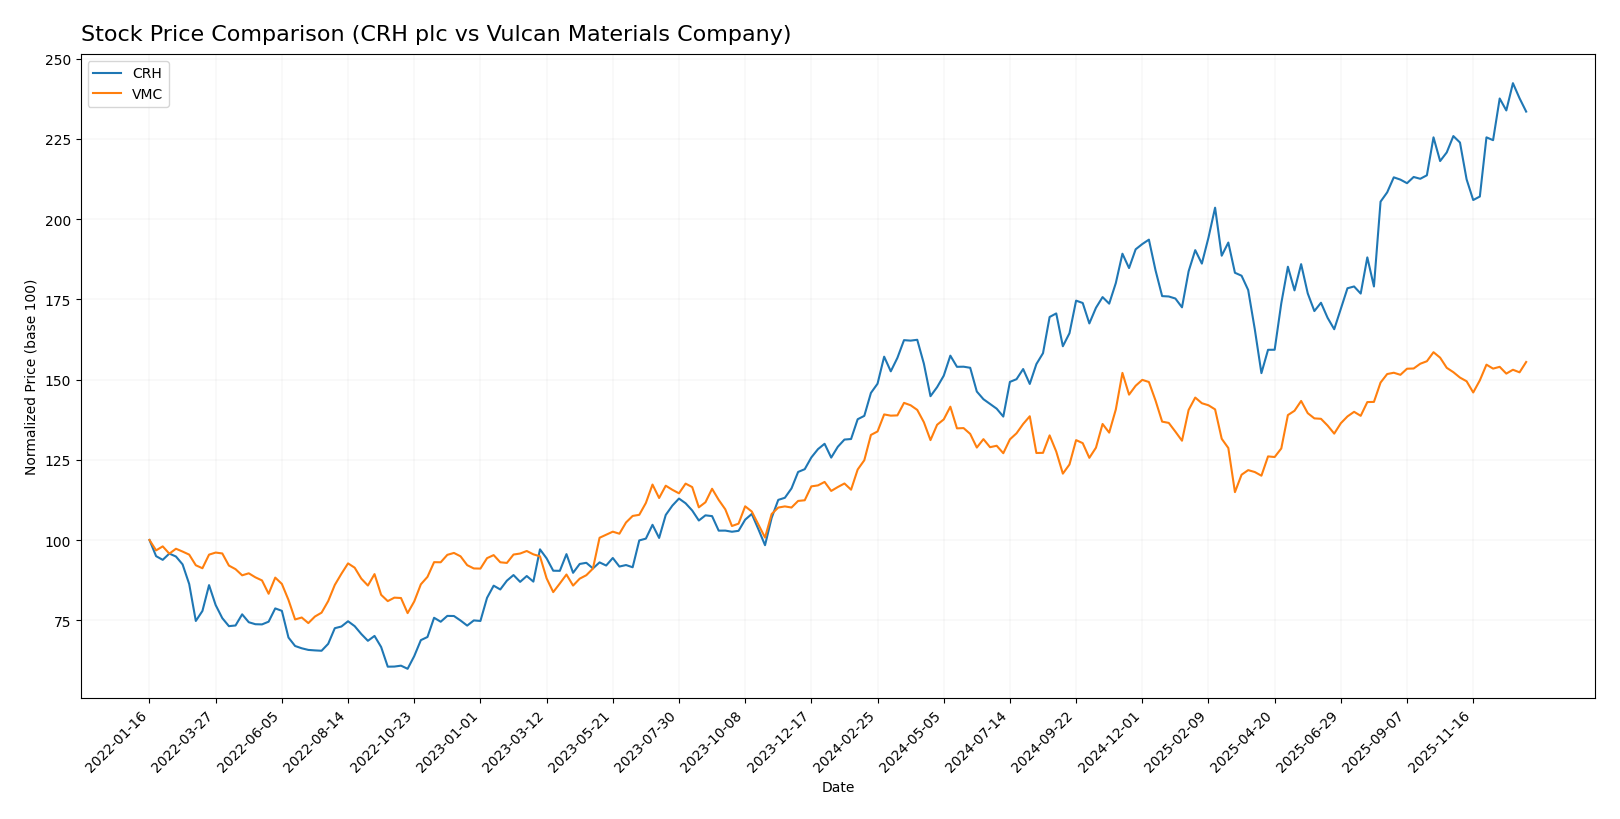
The stock price chart illustrates notable bullish trends for both CRH plc and Vulcan Materials Company over the past 12 months, with CRH showing a stronger acceleration and wider price range compared to VMC.
Trend Analysis
CRH plc’s stock gained 60.11% over the past year, indicating a bullish trend with acceleration. The price fluctuated between 73.67 and 128.94, showing moderate volatility (13.91 std deviation). Recent trend remains positive with a 3.38% increase.
Vulcan Materials Company’s stock rose 17.12% over the same period, also reflecting a bullish trend with acceleration. Price ranged from 220.9 to 304.7, with higher volatility (19.39 std deviation). Recent gains moderated to 2.08%, still positive.
Comparing both, CRH delivered the highest market performance with a significantly larger price increase and a stronger recent trend than Vulcan Materials Company.
Target Prices
The current analyst consensus suggests a positive outlook for both CRH plc and Vulcan Materials Company.
| Company | Target High | Target Low | Consensus |
|---|---|---|---|
| CRH plc | 147 | 131 | 138.4 |
| Vulcan Materials Company | 330 | 311 | 322 |
Analysts expect CRH plc’s stock to rise above its current price of 124.36 USD, targeting an average of 138.4 USD. Vulcan Materials Company also shows strong upside potential with a consensus target well above its current 298.77 USD price.
Analyst Opinions Comparison
This section compares analysts’ ratings and grades for CRH plc and Vulcan Materials Company:
Rating Comparison
CRH Rating
- Rating: B, considered Very Favorable by analysts.
- Discounted Cash Flow Score: 4, indicating a Favorable valuation outlook.
- Return on Equity Score: 5, assessed as Very Favorable for profit generation.
- Return on Assets Score: 5, showing very effective asset utilization.
- Debt To Equity Score: 1, marked as Very Unfavorable due to high financial risk.
- Overall Score: 3, categorized as Moderate financial standing.
VMC Rating
- Rating: B, considered Very Favorable by analysts.
- Discounted Cash Flow Score: 4, indicating a Favorable valuation outlook.
- Return on Equity Score: 5, assessed as Very Favorable for profit generation.
- Return on Assets Score: 5, showing very effective asset utilization.
- Debt To Equity Score: 1, marked as Very Unfavorable due to high financial risk.
- Overall Score: 3, categorized as Moderate financial standing.
Which one is the best rated?
Both CRH and VMC share identical ratings and scores across all evaluated metrics, resulting in equal analyst assessments with a Very Favorable rating and a Moderate overall score.
Scores Comparison
Here is a comparison of the Altman Z-Score and Piotroski Score for CRH plc and Vulcan Materials Company:
CRH Scores
- Altman Z-Score: 3.47, in the safe zone indicating low bankruptcy risk.
- Piotroski Score: 7, categorized as strong financial health.
VMC Scores
- Altman Z-Score: 4.12, in the safe zone indicating low bankruptcy risk.
- Piotroski Score: 6, categorized as average financial health.
Which company has the best scores?
VMC has a higher Altman Z-Score, indicating slightly lower bankruptcy risk, while CRH has a stronger Piotroski Score, reflecting better overall financial health. Both companies are in the safe zone for bankruptcy risk.
Grades Comparison
Here is the comparison of recent grades and ratings for CRH plc and Vulcan Materials Company:
CRH plc Grades
The following table summarizes recent grades from major financial institutions for CRH plc:
| Grading Company | Action | New Grade | Date |
|---|---|---|---|
| Morgan Stanley | Maintain | Overweight | 2025-12-10 |
| DA Davidson | Maintain | Neutral | 2025-11-12 |
| JP Morgan | Maintain | Overweight | 2025-11-11 |
| RBC Capital | Maintain | Outperform | 2025-11-07 |
| Wells Fargo | Maintain | Overweight | 2025-11-07 |
| Barclays | Maintain | Overweight | 2025-10-20 |
| Truist Securities | Maintain | Buy | 2025-10-02 |
| RBC Capital | Maintain | Outperform | 2025-10-01 |
| Bernstein | Maintain | Outperform | 2025-09-11 |
| RBC Capital | Maintain | Outperform | 2025-08-08 |
CRH plc’s grades consistently show strong buy-side recommendations, predominantly “Overweight” and “Outperform,” indicating positive analyst sentiment.
Vulcan Materials Company Grades
The following table summarizes recent grades from major financial institutions for Vulcan Materials Company:
| Grading Company | Action | New Grade | Date |
|---|---|---|---|
| DA Davidson | Maintain | Buy | 2025-11-04 |
| Citigroup | Maintain | Buy | 2025-11-03 |
| RBC Capital | Maintain | Sector Perform | 2025-10-31 |
| JP Morgan | Maintain | Overweight | 2025-10-21 |
| Raymond James | Maintain | Outperform | 2025-10-21 |
| Barclays | Maintain | Overweight | 2025-10-20 |
| JP Morgan | Maintain | Overweight | 2025-08-26 |
| Citigroup | Maintain | Buy | 2025-08-04 |
| UBS | Maintain | Buy | 2025-08-01 |
| Barclays | Maintain | Overweight | 2025-08-01 |
Vulcan Materials Company also enjoys predominantly positive grades, largely “Buy,” “Overweight,” and “Outperform,” with one “Sector Perform,” reflecting a generally favorable outlook.
Which company has the best grades?
Both CRH plc and Vulcan Materials Company have received predominantly positive grades from respected financial institutions, with consensus ratings at “Buy” for each. Vulcan Materials shows a higher number of “Buy” ratings, while CRH features more “Outperform” and “Overweight” grades. This suggests both companies are well-regarded, but Vulcan’s broader “Buy” consensus may signal slightly stronger analyst conviction, potentially impacting investor confidence and portfolio positioning.
Strengths and Weaknesses
Below is a comparative overview of the strengths and weaknesses of CRH plc and Vulcan Materials Company based on recent financial and operational data.
| Criterion | CRH plc | Vulcan Materials Company |
|---|---|---|
| Diversification | High product and service diversity, €26.7B in products and €8.9B in services (2024) | Moderate, focused on aggregates ($5.95B), asphalt, and concrete segments |
| Profitability | Neutral net margin (9.72%), favorable ROE (16%) and interest coverage | Favorable net margin (12.29%), neutral ROE (11.23%), favorable interest coverage |
| Innovation | Slightly favorable moat with growing ROIC trend (+64%) but currently shedding value | Slightly unfavorable moat, small ROIC growth (+3.8%), value destruction ongoing |
| Global presence | Strong global footprint with diversified infrastructure products | Primarily US-focused, strong in aggregates with steady revenue growth |
| Market Share | Leading market position in infrastructure products and services | Leading US aggregates producer, but lower asset turnover than CRH |
In summary, CRH plc shows strengths in diversification and improving profitability with a slightly favorable economic moat, while Vulcan Materials exhibits robust profitability but faces challenges in value creation and efficiency. Investors should weigh CRH’s global scale and innovation potential against Vulcan’s focused market presence and margin performance.
Risk Analysis
Below is a comparative table highlighting key risks for CRH plc and Vulcan Materials Company based on the most recent data from 2024.
| Metric | CRH plc | Vulcan Materials Company |
|---|---|---|
| Market Risk | Beta 1.20, moderate market sensitivity | Beta 1.06, slightly less volatile |
| Debt level | Debt-to-equity 0.71, moderate leverage | Debt-to-equity 0.72, moderate leverage |
| Regulatory Risk | Exposure to EU and US regulatory changes | Primarily US regulations, state-level variability |
| Operational Risk | Large global operations, complexity in supply chain | US-focused operations, somewhat simpler logistics |
| Environmental Risk | Construction materials sector, moderate environmental footprint | Aggregate mining impacts, localized environmental concerns |
| Geopolitical Risk | Exposure to multiple regions including Europe and North America | Mainly US geopolitical risks |
The most likely and impactful risks for both companies stem from their moderate leverage and exposure to regulatory changes in construction materials. CRH faces higher geopolitical risk due to its international footprint, while Vulcan Materials’ operational risk is tied to concentrated US markets. Both show stable financial health but remain sensitive to market fluctuations and environmental regulations.
Which Stock to Choose?
CRH plc has shown strong income growth with a 52.55% revenue increase and 264.62% net income growth over 2020-2024. Its financial ratios are slightly favorable overall, with a 16.0% ROE and solid interest coverage, though some valuation metrics appear unfavorable. The company carries moderate debt, reflected by a neutral debt-to-equity ratio, and holds a very favorable B rating.
Vulcan Materials Company’s income evolution is mixed, with a 52.73% revenue increase but a recent 4.68% decline in one-year revenue growth. Its financial ratios are neutral overall, supported by a favorable net margin but challenged by high valuation multiples and weaker asset turnover. Debt levels are moderate, and it shares the same very favorable B rating as CRH.
Considering ratings and financial profiles, CRH might appeal to investors favoring stable growth and profitability, given its strong income growth and slightly favorable ratios. Vulcan Materials could be seen as suitable for those accepting moderate volatility, with potentially higher operational margins but more mixed recent income trends and neutral ratio evaluations.
Disclaimer: Investment carries a risk of loss of initial capital. The past performance is not a reliable indicator of future results. Be sure to understand risks before making an investment decision.
Go Further
I encourage you to read the complete analyses of CRH plc and Vulcan Materials Company to enhance your investment decisions: