In the fast-evolving communication equipment sector, Credo Technology Group Holding Ltd (CRDO) and Zebra Technologies Corporation (ZBRA) stand out as innovative players with distinct market approaches. While Credo focuses on high-speed connectivity solutions and cutting-edge chip technologies, Zebra leads in enterprise asset intelligence and data capture systems. This comparison will help investors decide which company aligns better with their growth and risk appetite in this dynamic industry. Let’s explore their investment potential together.
Table of contents
Companies Overview
I will begin the comparison between Credo Technology Group Holding Ltd and Zebra Technologies Corporation by providing an overview of these two companies and their main differences.
Credo Technology Group Holding Ltd Overview
Credo Technology Group Holding Ltd focuses on high-speed connectivity solutions for optical and electrical Ethernet applications. Headquartered in San Jose, California, it offers integrated circuits, active electrical cables, and SerDes chiplets based on serializer/deserializer and digital signal processor technologies. Founded in 2008, Credo serves markets in the US, Mexico, China, Hong Kong, and internationally, positioning itself as an innovator in communication equipment.
Zebra Technologies Corporation Overview
Zebra Technologies Corporation provides enterprise asset intelligence solutions across automatic identification and data capture worldwide. Founded in 1969 and based in Lincolnshire, Illinois, Zebra designs and sells printers, scanners, RFID readers, rugged tablets, and software solutions. It serves diverse industries including retail, healthcare, and logistics, emphasizing real-time location systems, workforce management, and cloud-based services through direct sales and channel partners.
Key similarities and differences
Both companies operate within the communication equipment sector but differ in focus and scale. Credo specializes in Ethernet connectivity components and IP licensing, while Zebra offers a broader portfolio including printing, scanning, RFID, and enterprise software solutions. Zebra is significantly larger with nearly 10K employees versus Credo’s 500, reflecting a more diversified product and service offering compared to Credo’s niche high-speed connectivity market.
Income Statement Comparison
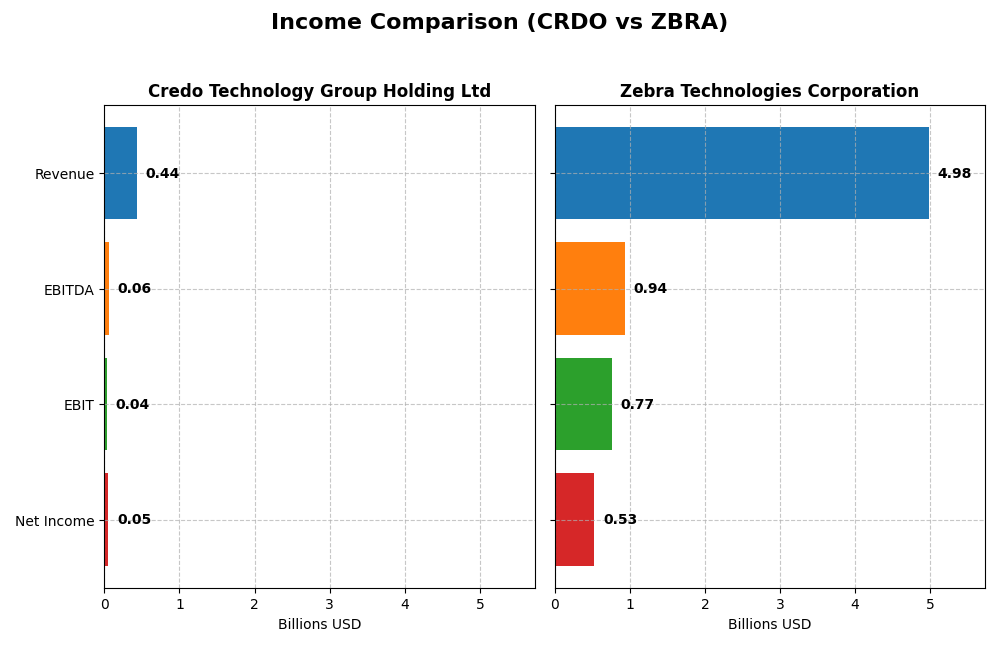
The table below compares the latest fiscal year income statement metrics for Credo Technology Group Holding Ltd and Zebra Technologies Corporation, highlighting key financial figures in USD.
| Metric | Credo Technology Group Holding Ltd | Zebra Technologies Corporation |
|---|---|---|
| Market Cap | 27.7B | 13.2B |
| Revenue | 437M | 4.98B |
| EBITDA | 60M | 937M |
| EBIT | 38M | 765M |
| Net Income | 52M | 528M |
| EPS | 0.31 | 10.25 |
| Fiscal Year | 2025 | 2024 |
Income Statement Interpretations
Credo Technology Group Holding Ltd
Credo Technology Group Holding Ltd showed a strong upward trend in revenue and net income from 2021 to 2025, with revenue surging from $59M to $437M and net income improving from a loss of $27.5M to a profit of $52.2M. Gross margin remained favorable at 64.77%, while EBIT margin was neutral at 8.7%. The 2025 fiscal year delivered exceptional growth, with revenue and net income more than doubling, indicating a robust operational turnaround.
Zebra Technologies Corporation
Zebra Technologies Corporation experienced moderate revenue growth from $4.45B in 2020 to $4.98B in 2024, alongside net income rising from $504M to $528M. Margins stayed consistently favorable, with a gross margin of 48.44% and an EBIT margin of 15.36%. The 2024 fiscal year showed solid improvements in EBIT and net margin, with net income and EPS growth rates significantly higher than prior years, reflecting efficient cost management and steady demand.
Which one has the stronger fundamentals?
Both companies present favorable income statement fundamentals, yet Credo Technology’s rapid top-line and bottom-line growth, along with a superior gross margin and zero interest expense, highlight impressive momentum. Zebra maintains stable profitability and margin strength but shows slower overall growth and a slight net margin decline over the long term. Credo’s higher recent growth rates contrast with Zebra’s consistent but more moderate expansion.
Financial Ratios Comparison
The following table presents a side-by-side comparison of key financial ratios for Credo Technology Group Holding Ltd (CRDO) and Zebra Technologies Corporation (ZBRA) for their most recent fiscal years.
| Ratios | Credo Technology Group Holding Ltd (CRDO) FY 2025 | Zebra Technologies Corporation (ZBRA) FY 2024 |
|---|---|---|
| ROE | 7.66% | 14.72% |
| ROIC | 5.01% | 9.67% |
| P/E | 138.19 | 37.67 |
| P/B | 10.58 | 5.55 |
| Current Ratio | 6.62 | 1.43 |
| Quick Ratio | 5.79 | 1.03 |
| D/E (Debt to Equity) | 0.02 | 0.66 |
| Debt-to-Assets | 1.98% | 29.64% |
| Interest Coverage | 0 (not reported) | 5.75 |
| Asset Turnover | 0.54 | 0.63 |
| Fixed Asset Turnover | 5.54 | 10.55 |
| Payout ratio | 0% | 0% |
| Dividend yield | 0% | 0% |
Interpretation of the Ratios
Credo Technology Group Holding Ltd
Credo shows a mixed ratio profile with strong quick ratio (5.79) and very low debt levels (debt to equity 0.02), indicating solid liquidity and low leverage. However, high price multiples (PE 138.19, PB 10.58) and a weak current ratio (6.62) may concern some investors. The company does not pay dividends, likely due to its reinvestment focus and growth strategy.
Zebra Technologies Corporation
Zebra’s ratios reflect balanced financial health with favorable interest coverage (5.93) and fixed asset turnover (10.55), supporting operational efficiency. Its moderate leverage (debt to equity 0.66) and neutral current ratio (1.43) suggest reasonable risk. Zebra also does not pay dividends, probably prioritizing growth and reinvestment over shareholder payouts.
Which one has the best ratios?
Credo and Zebra exhibit strengths and weaknesses in their financial ratios. Credo excels in liquidity and low leverage but is penalized by high valuation multiples and uncertain profitability metrics, while Zebra demonstrates more consistent operational metrics and moderate leverage. Overall, Zebra’s ratios lean slightly favorable, whereas Credo’s remain neutral.
Strategic Positioning
This section compares the strategic positioning of Credo Technology Group Holding Ltd and Zebra Technologies Corporation, covering market position, key segments, and exposure to technological disruption:
Credo Technology Group Holding Ltd
- Smaller market cap with high beta, facing competitive pressure in communication equipment sector.
- Key segments: Product high-speed connectivity, licensing IP, and product engineering services driving revenue.
- Exposure through innovative SerDes and DSP technologies, focused on optical and electrical Ethernet connectivity.
Zebra Technologies Corporation
- Mid-sized market cap, moderate beta, operating in enterprise asset intelligence with competitive challenges.
- Two main segments: Asset Intelligence Tracking and Enterprise Visibility & Mobility, with diverse product and service offerings.
- Faces disruption risks from advancements in RFID, barcode scanning, mobile computing, and automation technologies.
Credo Technology Group Holding Ltd vs Zebra Technologies Corporation Positioning
Credo focuses on high-speed communication components with a more concentrated product range, while Zebra operates diversified enterprise solutions across tracking and mobility. Credo’s smaller scale contrasts with Zebra’s broader market and service portfolio, reflecting different strategic scopes and industry roles.
Which has the best competitive advantage?
Both companies are currently shedding value with ROIC below WACC. Credo shows improving profitability trends, whereas Zebra faces declining returns, indicating Credo may have a slightly stronger potential moat despite overall unfavorable evaluations.
Stock Comparison
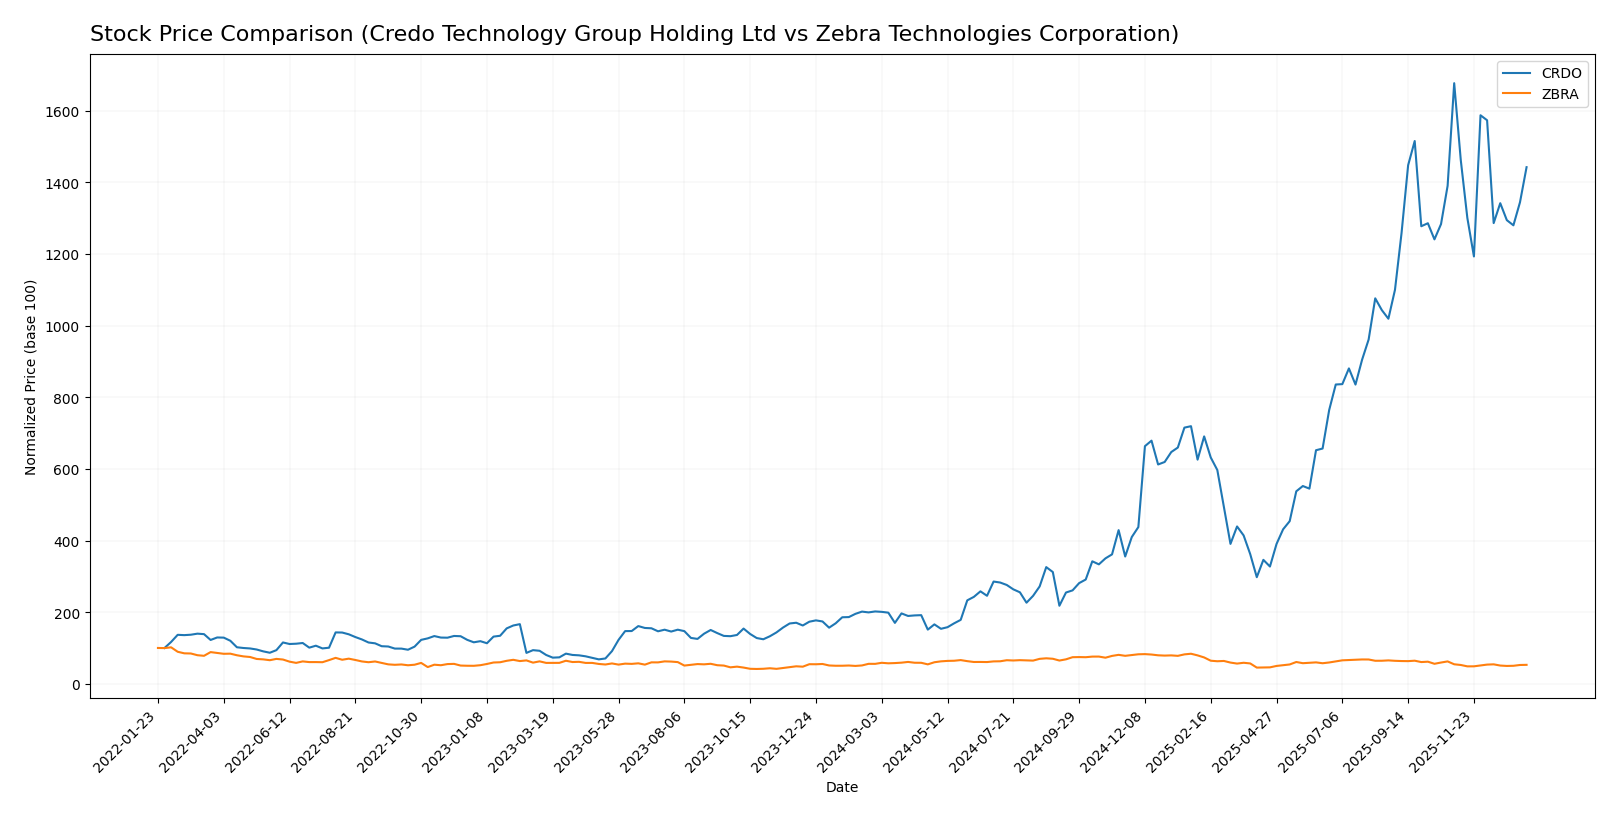
The stock price dynamics over the past 12 months reveal a stark contrast between Credo Technology Group Holding Ltd and Zebra Technologies Corporation, with Credo showing a strong bullish momentum despite recent deceleration, while Zebra experiences a steady bearish trend.
Trend Analysis
Credo Technology Group Holding Ltd exhibited a bullish trend over the past year with a 614.07% price increase, though its growth has decelerated recently, showing a -13.99% decline since November 2025. Zebra Technologies Corporation displayed a bearish trend with a -4.93% price change over the year, accelerating its decline recently by -2.9%.
Comparing both, Credo’s stock delivered the highest market performance with a significant overall gain, while Zebra’s stock underperformed, continuing on a downward trajectory.
Target Prices
Analysts present a positive consensus on target prices for Credo Technology Group Holding Ltd and Zebra Technologies Corporation.
| Company | Target High | Target Low | Consensus |
|---|---|---|---|
| Credo Technology Group Holding Ltd | 250 | 160 | 217.5 |
| Zebra Technologies Corporation | 368 | 291 | 329.5 |
The target consensus for Credo is significantly above its current price of 161.38 USD, indicating strong upside potential. Zebra’s consensus target of 329.5 USD also suggests considerable growth compared to its current price of 261.44 USD.
Analyst Opinions Comparison
This section compares analysts’ ratings and financial scores for Credo Technology Group Holding Ltd and Zebra Technologies Corporation:
Rating Comparison
CRDO Rating
- Rating: B, assessed as Very Favorable overall by analysts.
- Discounted Cash Flow Score: 1, indicating a Very Unfavorable valuation outlook.
- ROE Score: 4, reflecting a Favorable ability to generate profit from equity.
- ROA Score: 5, Very Favorable use of assets to generate earnings.
- Debt To Equity Score: 4, Favorable financial risk profile with lower leverage.
- Overall Score: 3, a Moderate overall financial standing.
ZBRA Rating
- Rating: B, also considered Very Favorable overall by analysts.
- Discounted Cash Flow Score: 3, showing a Moderate valuation outlook.
- ROE Score: 4, equally Favorable in generating profit from equity.
- ROA Score: 4, Favorable but lower asset efficiency compared to CRDO.
- Debt To Equity Score: 1, Very Unfavorable, indicating higher financial risk.
- Overall Score: 3, also Moderate overall financial standing.
Which one is the best rated?
Both CRDO and ZBRA share the same overall rating of B and an overall score of 3, indicating a Moderate standing. CRDO shows stronger asset utilization and lower financial risk, while ZBRA has a better discounted cash flow score.
Scores Comparison
Here is a comparison of the Altman Z-Score and Piotroski Score for Credo Technology Group Holding Ltd and Zebra Technologies Corporation:
CRDO Scores
- Altman Z-Score: 100.4, indicating a safe zone status
- Piotroski Score: 5, reflecting an average financial strength
ZBRA Scores
- Altman Z-Score: 3.86, indicating a safe zone status
- Piotroski Score: 7, reflecting strong financial strength
Which company has the best scores?
Zebra Technologies (ZBRA) has a lower but still safe Altman Z-Score and a higher Piotroski Score than Credo Technology (CRDO), indicating relatively stronger financial health based on these scores.
Grades Comparison
Here is a comparison of the latest reliable grades for Credo Technology Group Holding Ltd and Zebra Technologies Corporation:
Credo Technology Group Holding Ltd Grades
The following table summarizes recent grades from reputable grading firms for Credo Technology Group Holding Ltd:
| Grading Company | Action | New Grade | Date |
|---|---|---|---|
| B of A Securities | Maintain | Buy | 2025-12-02 |
| Needham | Maintain | Buy | 2025-12-02 |
| Mizuho | Maintain | Outperform | 2025-12-02 |
| Roth Capital | Maintain | Buy | 2025-12-02 |
| Barclays | Maintain | Overweight | 2025-12-02 |
| Susquehanna | Maintain | Positive | 2025-10-22 |
| Barclays | Maintain | Overweight | 2025-10-07 |
| Barclays | Maintain | Overweight | 2025-09-04 |
| TD Cowen | Maintain | Buy | 2025-09-04 |
| Needham | Maintain | Buy | 2025-09-04 |
Overall, Credo’s grades consistently indicate a positive outlook with strong buy and outperform recommendations maintained by multiple firms.
Zebra Technologies Corporation Grades
The following table shows recent grades from recognized grading firms for Zebra Technologies Corporation:
| Grading Company | Action | New Grade | Date |
|---|---|---|---|
| Barclays | Maintain | Overweight | 2026-01-12 |
| Truist Securities | Maintain | Hold | 2025-12-18 |
| Truist Securities | Maintain | Hold | 2025-10-29 |
| Barclays | Maintain | Overweight | 2025-10-29 |
| Citigroup | Maintain | Neutral | 2025-10-29 |
| Citigroup | Maintain | Neutral | 2025-10-09 |
| Truist Securities | Maintain | Hold | 2025-10-08 |
| Morgan Stanley | Maintain | Equal Weight | 2025-08-06 |
| Needham | Maintain | Buy | 2025-08-06 |
| Truist Securities | Maintain | Hold | 2025-08-06 |
Zebra’s grades show a more mixed consensus with a range from buy to hold and neutral ratings, suggesting a more cautious market view.
Which company has the best grades?
Credo Technology Group Holding Ltd has received consistently stronger grades, predominantly buy and outperform, compared to Zebra Technologies Corporation’s mixed buy, hold, and neutral ratings. This suggests Credo is viewed more favorably, potentially indicating higher confidence or growth expectations from analysts.
Strengths and Weaknesses
Below is a comparison of key strengths and weaknesses for Credo Technology Group Holding Ltd (CRDO) and Zebra Technologies Corporation (ZBRA) based on their recent financial and operational data.
| Criterion | Credo Technology Group Holding Ltd (CRDO) | Zebra Technologies Corporation (ZBRA) |
|---|---|---|
| Diversification | Moderate: Focused on product engineering and licensing, with revenue heavily weighted to products (412M USD in 2025). | Strong: Diverse segments including Asset Intelligence Tracking and Enterprise Visibility Mobility, with multi-billion revenues. |
| Profitability | Mixed: Net margin favorable at 11.95%, but ROIC below WACC indicating value destruction; ROIC growing. | Moderate: Net margin 10.6%, ROIC slightly below WACC, declining profitability trend. |
| Innovation | Growing ROIC trend suggests improving operational efficiency and innovation potential. | Declining ROIC trend may indicate challenges in innovation or operational efficiency. |
| Global presence | Limited data, but smaller scale and less diversified product portfolio suggest narrower global reach. | Extensive global presence supported by large-scale product segments and revenues in billions. |
| Market Share | Smaller market player with less diversified revenue streams. | Larger market share in key segments, supported by higher sales volumes and product diversity. |
Key takeaways: CRDO shows improving profitability and operational efficiency but currently destroys value and operates on a smaller scale. ZBRA maintains strong market presence and product diversity but faces declining profitability, raising concerns about sustained value creation. Investors should weigh CRDO’s growth potential against ZBRA’s established scale and current challenges.
Risk Analysis
Below is a comparative risk table for Credo Technology Group Holding Ltd (CRDO) and Zebra Technologies Corporation (ZBRA) based on the most recent data available.
| Metric | Credo Technology Group Holding Ltd (CRDO) | Zebra Technologies Corporation (ZBRA) |
|---|---|---|
| Market Risk | High beta 2.66 indicates higher volatility | Moderate beta 1.68 suggests moderate volatility |
| Debt level | Very low debt-to-equity 0.02, very favorable | Moderate debt-to-equity 0.66, neutral risk |
| Regulatory Risk | Moderate, operates globally including China | Moderate, global operations and complex sectors |
| Operational Risk | Smaller workforce (500 employees), risk of scale | Larger workforce (9,900 employees), operational complexity |
| Environmental Risk | Moderate, tech sector with product lifecycle impacts | Moderate, manufacturing and logistics involvement |
| Geopolitical Risk | Exposure to US-China trade tensions | Exposure to global supply chain disruptions |
The highest risks for CRDO stem from its market volatility and relatively high weighted average cost of capital, despite strong liquidity and very low debt. For ZBRA, moderate debt levels and exposure to supply chain disruptions pose the main concerns, although its financial stability and operational scale offer resilience. Both companies remain in the safe zone for bankruptcy risk but require monitoring geopolitical and market fluctuations carefully.
Which Stock to Choose?
Credo Technology Group Holding Ltd (CRDO) shows a strong income evolution with a 126% one-year revenue growth and a favorable net margin of 11.95%. Its financial ratios present a mixed picture, with favorable liquidity and low debt but high valuation multiples and moderate profitability. The company is slightly unfavorable on MOAT due to ROIC below WACC despite growing profitability, and holds a very favorable overall rating of B.
Zebra Technologies Corporation (ZBRA) exhibits steady income growth of 8.66% in the last year and a solid net margin of 10.6%. Its financial ratios are slightly favorable overall, with good profitability and moderate leverage but a less liquid current ratio. The company faces a very unfavorable MOAT rating with declining ROIC below WACC, yet maintains a very favorable rating of B supported by strong Altman Z-Score and Piotroski scores.
For investors prioritizing growth and income improvements, CRDO’s substantial revenue and margin expansion alongside a favorable rating might appear more attractive. Conversely, those valuing stability, proven profitability, and stronger financial health scores may find ZBRA’s consistent returns and solid credit profile more suitable. The choice could depend on the investor’s risk tolerance and strategic focus.
Disclaimer: Investment carries a risk of loss of initial capital. The past performance is not a reliable indicator of future results. Be sure to understand risks before making an investment decision.
Go Further
I encourage you to read the complete analyses of Credo Technology Group Holding Ltd and Zebra Technologies Corporation to enhance your investment decisions: