Home > Comparison > Technology > NOK vs CRDO
The strategic rivalry between Nokia Oyj and Credo Technology Group Holding Ltd shapes the landscape of the communication equipment sector. Nokia, a capital-intensive global network solutions leader, contrasts with Credo’s nimble, high-tech semiconductor specialization. This head-to-head pits scale and legacy infrastructure against cutting-edge innovation. This analysis will reveal which corporate trajectory offers superior risk-adjusted returns for a diversified portfolio navigating evolving technology demands.
Table of contents
Companies Overview
Nokia Oyj and Credo Technology Group Holding Ltd stand as pivotal players in the communication equipment sector.
Nokia Oyj: Global Network Infrastructure Powerhouse
Nokia dominates with its comprehensive communication equipment portfolio, spanning mobile networks, fixed infrastructure, and cloud services. Its revenue stems from advanced 2G to 5G radio access, optical networks, and enterprise solutions. In 2026, Nokia emphasizes innovation in cloud and cognitive services, targeting service providers and digital industries to sustain its broad market leadership.
Credo Technology Group Holding Ltd: Specialist in High-Speed Connectivity
Credo focuses on high-speed optical and electrical connectivity solutions, including integrated circuits and SerDes chiplets. Its revenue engine leverages proprietary serializer/deserializer and DSP technologies. In 2026, Credo sharpens its strategic focus on IP licensing and expanding its footprint in Ethernet applications across key global markets, driving growth through specialized product innovation.
Strategic Collision: Similarities & Divergences
Both firms excel in communication equipment yet diverge in scope and scale. Nokia pursues a broad ecosystem integrating network infrastructure and cloud, while Credo champions a niche specialization in high-speed connectivity components. Their primary battleground is optical and Ethernet networking technology. This contrast defines distinct investment profiles: Nokia as a large-cap infrastructure leader, Credo as a high-beta innovator in connectivity solutions.
Income Statement Comparison
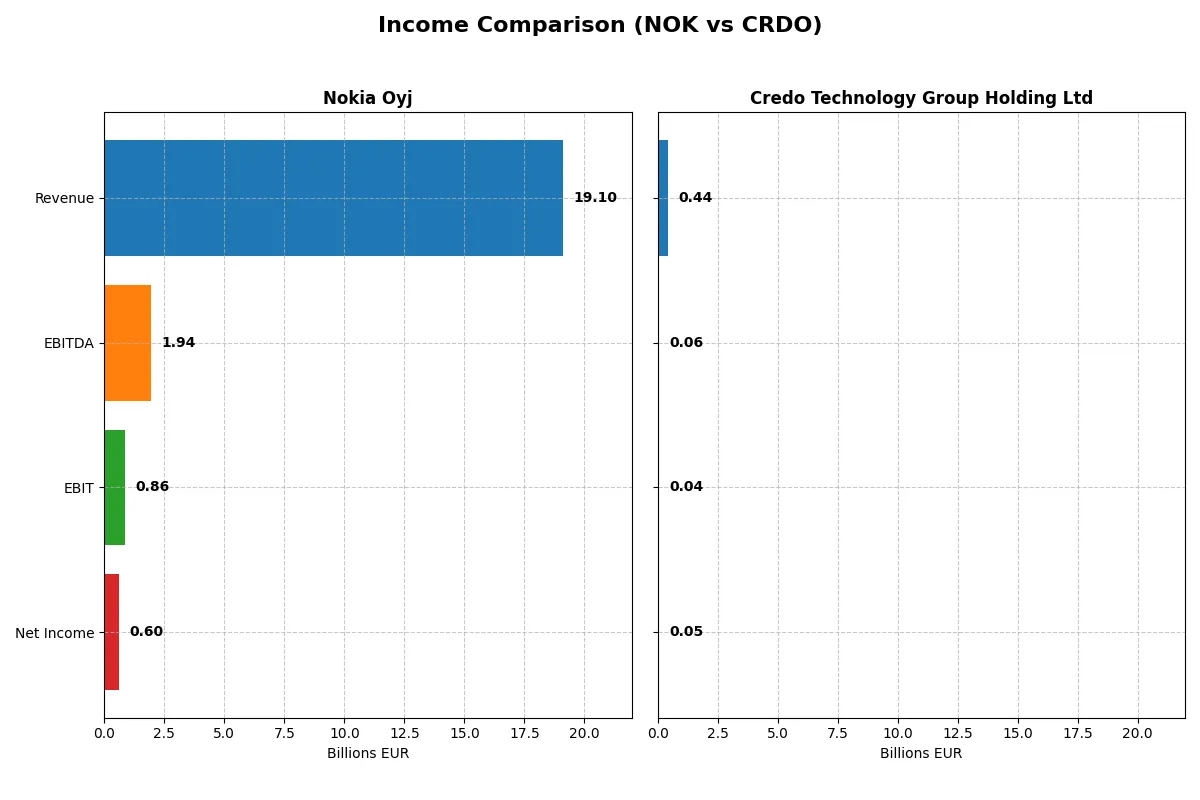
The following data dissects the core profitability and scalability of both corporate engines to reveal who dominates the bottom line:
| Metric | Nokia Oyj (NOK) | Credo Technology Group Holding Ltd (CRDO) |
|---|---|---|
| Revenue | 19.1B EUR | 437M USD |
| Cost of Revenue | 11.1B EUR | 154M USD |
| Operating Expenses | 6.5B EUR | 246M USD |
| Gross Profit | 8.0B EUR | 283M USD |
| EBITDA | 1.9B EUR | 60M USD |
| EBIT | 862M EUR | 38M USD |
| Interest Expense | 0 | 0 |
| Net Income | 604M EUR | 52M USD |
| EPS | 0.11 EUR | 0.31 USD |
| Fiscal Year | 2025 | 2025 |
Income Statement Analysis: The Bottom-Line Duel
This income statement comparison reveals the true efficiency of Nokia Oyj and Credo Technology Group’s corporate engines through their revenue and profitability trends.
Nokia Oyj Analysis
Nokia’s revenue declined modestly to €19.1B in 2025, continuing a downward trend since 2021. Net income dropped sharply to €604M, reflecting margin compression. Gross margin remains favorable at 42%, yet net margin slipped to 3.16%, signaling weakened profitability and operational challenges in the latest fiscal year.
Credo Technology Group Holding Ltd Analysis
Credo soared with revenue more than doubling to $437M in 2025, driven by rapid growth. Net income turned positive at $52M, supported by a strong net margin of 11.95%. Its gross margin of 64.77% indicates robust cost control, while EBIT margin of 8.7% reflects improving operational efficiency and accelerating momentum.
Growth Momentum vs. Margin Resilience
Credo displays superior revenue and net income growth, outpacing Nokia’s shrinking topline and profits. Nokia’s stable yet declining gross margin contrasts with Credo’s expanding margins and profitability. For investors, Credo’s high-growth, improving margin profile offers greater appeal compared to Nokia’s struggle to maintain earnings amid revenue declines.
Financial Ratios Comparison
These vital ratios act as a diagnostic tool to expose the underlying fiscal health, valuation premiums, and capital efficiency of the companies compared below:
| Ratios | Nokia Oyj (NOK) | Credo Technology Group Holding Ltd (CRDO) |
|---|---|---|
| ROE | 2.9% | 7.7% |
| ROIC | 3.8% | 5.0% |
| P/E | 49.4 | 138.2 |
| P/B | 1.42 | 10.58 |
| Current Ratio | 1.58 | 6.62 |
| Quick Ratio | 1.36 | 5.79 |
| D/E | 0.25 | 0.02 |
| Debt-to-Assets | 13.9% | 2.0% |
| Interest Coverage | 0 | 0 |
| Asset Turnover | 0.51 | 0.54 |
| Fixed Asset Turnover | 7.68 | 5.54 |
| Payout Ratio | 120% | 0% |
| Dividend Yield | 2.43% | 0% |
| Fiscal Year | 2025 | 2025 |
Efficiency & Valuation Duel: The Vital Signs
Financial ratios serve as a company’s DNA, exposing hidden risks and operational strengths essential for investor scrutiny.
Nokia Oyj
Nokia displays modest profitability with a 2.88% ROE and slim 3.16% net margin, signaling operational challenges. Its P/E ratio of 49.36 suggests the stock trades at a premium, yet a reasonable P/B of 1.42 supports valuation. Nokia rewards shareholders with a 2.43% dividend yield, balancing reinvestment and income.
Credo Technology Group Holding Ltd
Credo posts a higher net margin of 11.95%, but its 7.66% ROE and 138.19 P/E ratio reveal stretched valuation. The P/B ratio at 10.58 amplifies this expensive profile. Credo offers no dividend, focusing heavily on R&D for growth, as reflected in its substantial reinvestment ratio.
Premium Valuation vs. Operational Safety
Nokia offers a better balance between valuation and operational safety, with a favorable liquidity profile and dividend. Credo’s elevated multiples and reinvestment strategy carry higher risk. Investors prioritizing stability may lean toward Nokia’s conservative profile, while growth seekers might consider Credo’s aggressive stance.
Which one offers the Superior Shareholder Reward?
I observe Nokia Oyj offers a 3.1% dividend yield with a sustainable payout ratio near 57% in 2025, supported by robust free cash flow (0.37€/share). Nokia also maintains moderate buybacks, enhancing total returns. Conversely, Credo Technology Group pays no dividend, reinvesting heavily for growth, reflected in a high price-to-book ratio of 10.6 and negligible buybacks. Nokia’s balanced distribution and buyback strategy provide a more reliable and attractive total shareholder return profile in 2026.
Comparative Score Analysis: The Strategic Profile
The radar chart reveals the fundamental DNA and strategic trade-offs between Nokia Oyj and Credo Technology Group Holding Ltd:
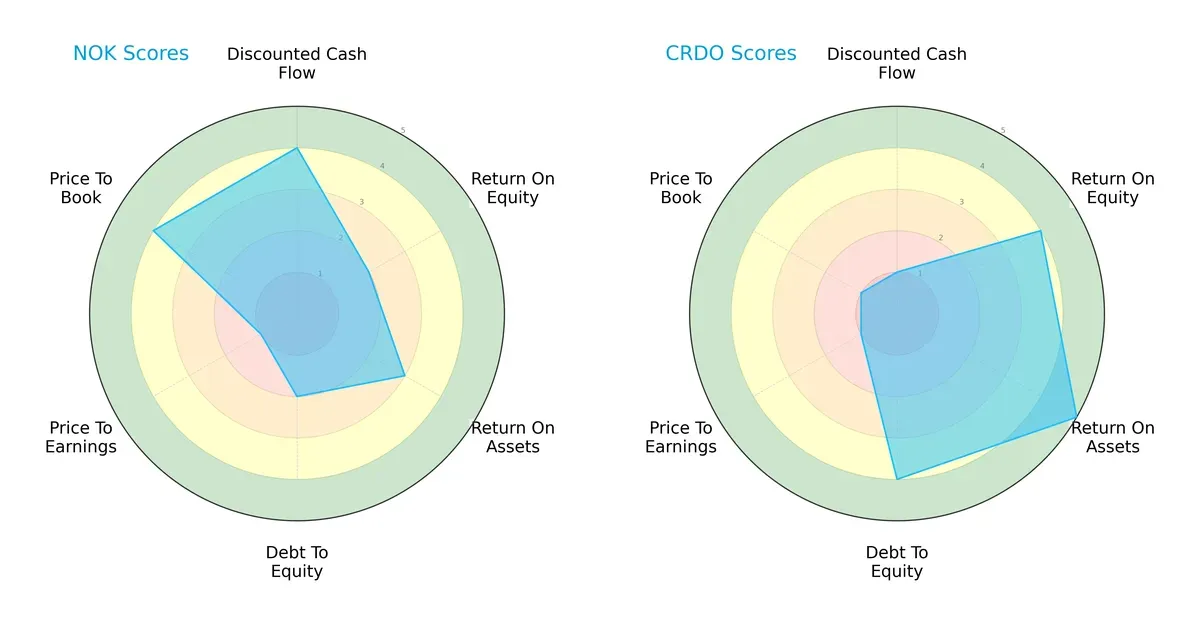
Nokia displays strength in discounted cash flow and price-to-book valuation, signaling solid intrinsic value and asset backing. Credo excels in return on equity, return on assets, and debt-to-equity, indicating operational efficiency and conservative leverage. Nokia’s profile is more valuation-focused, while Credo leverages superior profitability and balance sheet strength. Overall, Credo presents a more balanced performance across core financial metrics.
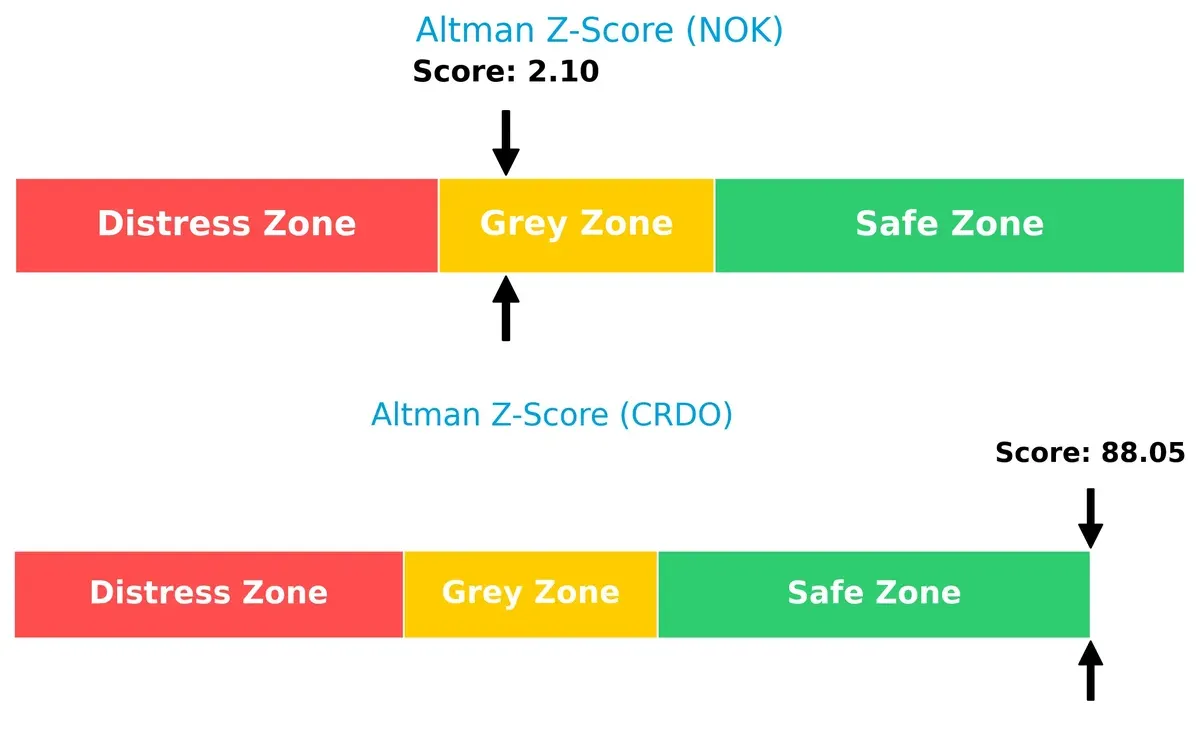
Bankruptcy Risk: Solvency Showdown
The Altman Z-Score gap reveals Credo’s robust solvency and low bankruptcy risk compared to Nokia’s moderate distress level in this cycle:
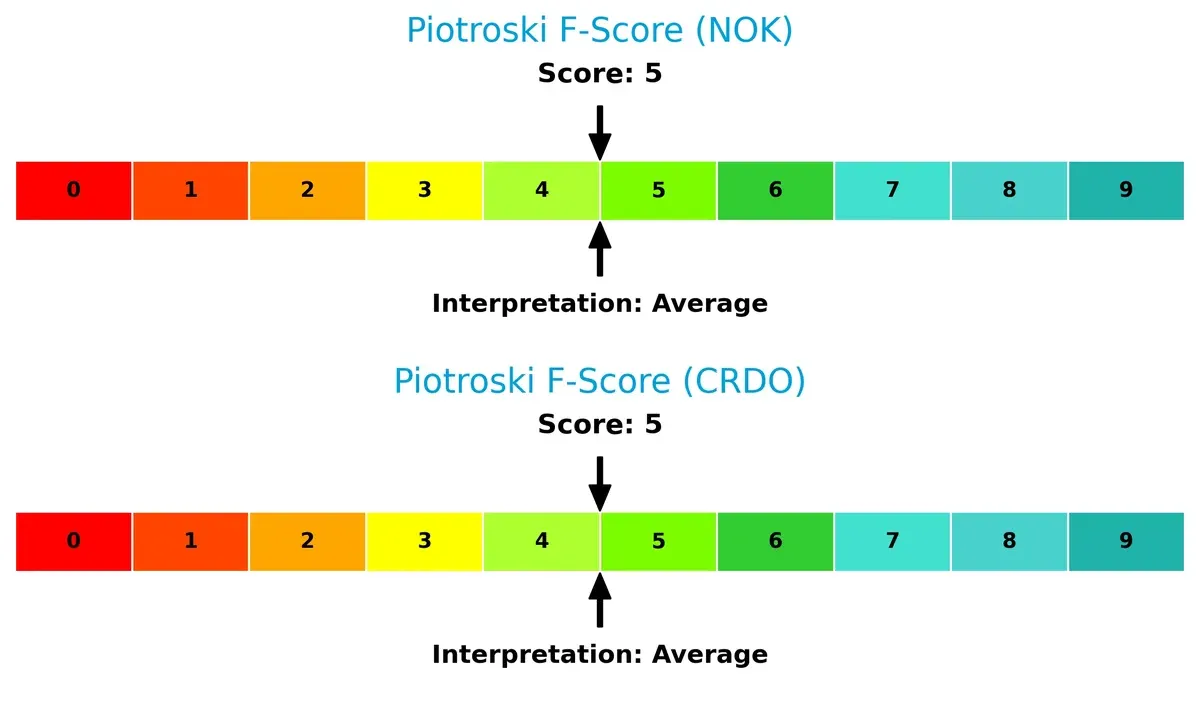
Financial Health: Quality of Operations
Both firms score an identical 5 on the Piotroski scale, indicating average financial health with no immediate red flags in operational or liquidity metrics:
How are the two companies positioned?
This section dissects Nokia and Credo’s operational DNA by comparing their revenue distribution and internal strengths and weaknesses. The goal is to confront their economic moats and reveal which model offers the most resilient competitive advantage today.
Revenue Segmentation: The Strategic Mix
The following visual comparison dissects how both firms diversify their income streams and where their primary sector bets lie:
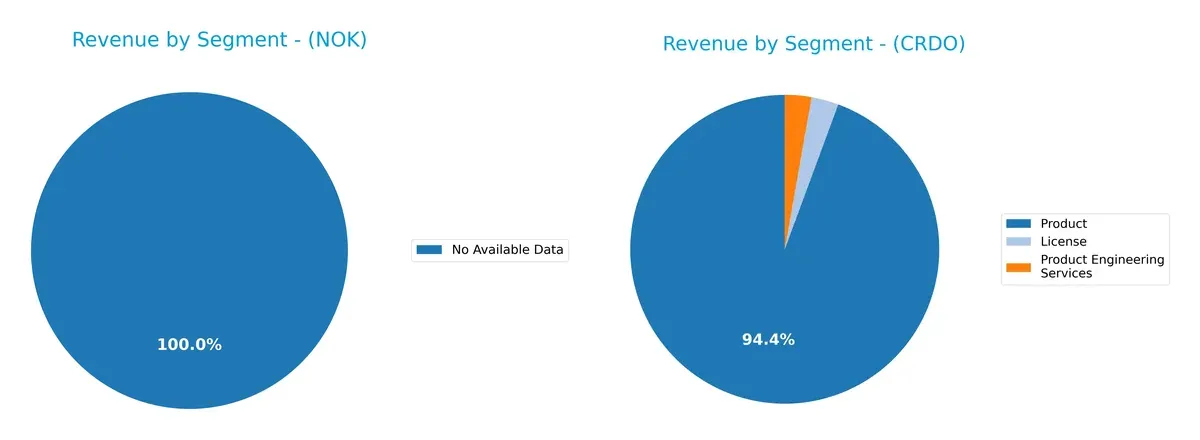
I did not find enough data to evaluate the segmentation of Nokia Oyj. Credo Technology Group Holding Ltd pivots around its Product segment, generating $412M in 2025, dwarfing License ($12.5M) and Product Engineering Services ($12.1M). This concentration reveals a strategic focus on product dominance, potentially risking exposure to market shifts but also leveraging specialized innovation. Without Nokia’s data, Credo stands out as a company anchored in a core offering rather than a diversified ecosystem.
Strengths and Weaknesses Comparison
This table compares the Strengths and Weaknesses of Nokia and Credo Technology Group:
Nokia Strengths
- Diversified global presence with significant revenues across Europe, North America, and Asia Pacific
- Favorable capital structure with low debt-to-assets and strong interest coverage
- Positive dividend yield supports shareholder returns
Credo Strengths
- High net margin indicates operational efficiency
- Favorable debt-to-assets and low debt-to-equity ratios imply strong balance sheet
- Quick ratio favorable, reflecting liquidity strength
Nokia Weaknesses
- Low profitability metrics with unfavorable net margin, ROE, and ROIC
- Elevated P/E ratio suggests overvaluation concerns
- Limited product revenue segmentation data restricts innovation insight
Credo Weaknesses
- Unfavorable WACC and elevated P/E and P/B ratios imply valuation and capital cost challenges
- Current ratio extremely high, risking inefficient asset use
- Lack of dividend yield may deter income-focused investors
Nokia’s strengths lie in its broad geographic reach and solid financial stability, but profitability metrics require improvement. Credo shows operational profitability and balance sheet strength, though valuation and liquidity ratios highlight potential risks that could impact its capital efficiency and investor appeal.
The Moat Duel: Analyzing Competitive Defensibility
A structural moat is the only true shield protecting long-term profits from relentless competition erosion. Let’s dissect the moats of two industry players:
Nokia Oyj: Intangible Assets and Brand Legacy
Nokia’s competitive edge stems from its vast patent portfolio and global brand recognition. This intangible asset base supports stable gross margins around 42%, despite declining profitability. However, shrinking revenues and EBIT signal risks to sustaining this moat through 2026.
Credo Technology Group: Innovation-Driven Cost Advantage
Credo leverages cutting-edge SerDes technology, driving high gross margins near 65% and rapid revenue growth over 120%. Unlike Nokia’s legacy moat, Credo’s innovation fuels operational leverage and margin expansion, with strong market demand likely to deepen its advantage.
Legacy Brand vs. Innovation Edge: The Moat Showdown
Both firms currently shed value as ROIC lags WACC, but Credo’s accelerating profitability and growth mark a widening moat. Nokia’s declining returns and shrinking sales suggest weakening defenses. Credo stands better positioned to defend and expand its market share in 2026.
Which stock offers better returns?
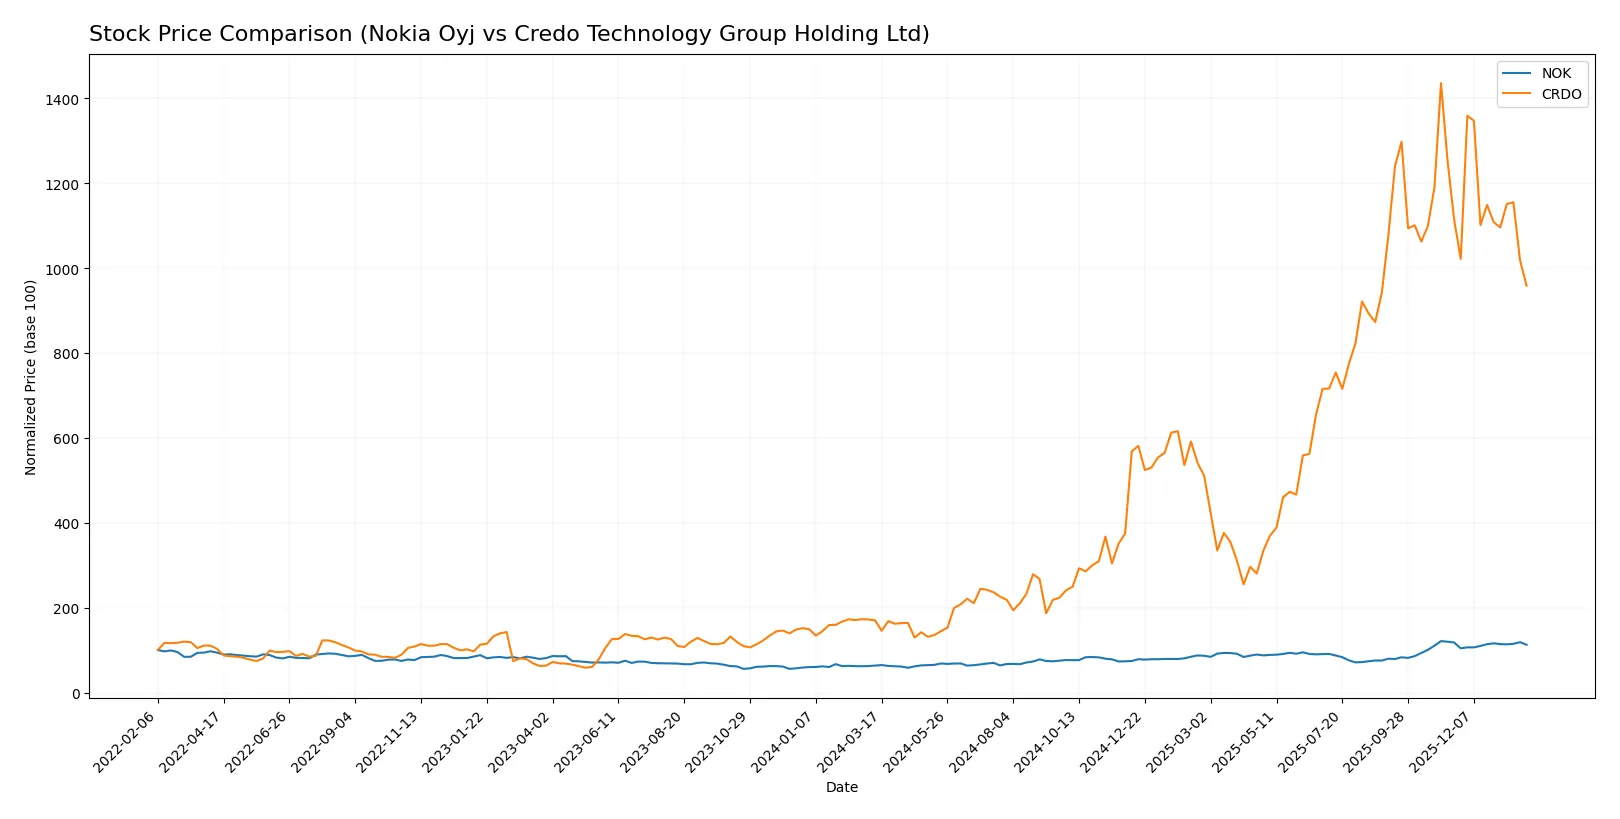
Over the past 12 months, Nokia Oyj and Credo Technology Group Holding Ltd showed strong price gains with distinct trading patterns and shifting momentum in recent weeks.
Trend Comparison
Nokia Oyj’s stock price rose 77.62% over the past year, reflecting a bullish trend with accelerating momentum and moderate volatility (0.9 std deviation). The stock reached a high of $6.91 and a low of $3.33.
Credo Technology Group’s stock surged 463.82% in the same period, also bullish but with decelerating momentum and very high volatility (48.95 std deviation). It traded between $16.92 and $187.62.
Comparing trends, Credo Technology outperformed Nokia significantly despite higher volatility and recent price declines, delivering the strongest market performance overall.
Target Prices
Analysts present a bullish outlook with notable upside potential for both Nokia Oyj and Credo Technology Group Holding Ltd.
| Company | Target Low | Target High | Consensus |
|---|---|---|---|
| Nokia Oyj | 5.00 | 8.50 | 6.69 |
| Credo Technology Group Holding Ltd | 160.00 | 260.00 | 222.50 |
The consensus target for Nokia sits modestly above its current $6.43 price, indicating moderate upside. Credo’s target consensus at $222.5 far exceeds its current $125.28 price, signaling strong analyst optimism despite recent volatility.

Don’t Let Luck Decide Your Entry Point
Optimize your entry points with our advanced ProRealTime indicators. You’ll get efficient buy signals with precise price targets for maximum performance. Start outperforming now!
How do institutions grade them?
Here is a comparison of the latest institutional grades for Nokia Oyj and Credo Technology Group Holding Ltd:
Nokia Oyj Grades
The table below summarizes recent grades from reputable financial institutions for Nokia Oyj.
| Grading Company | Action | New Grade | Date |
|---|---|---|---|
| JP Morgan | Maintain | Overweight | 2025-12-01 |
| Jefferies | Upgrade | Buy | 2025-10-28 |
| JP Morgan | Maintain | Overweight | 2025-10-24 |
| JP Morgan | Maintain | Overweight | 2025-07-29 |
| JP Morgan | Maintain | Overweight | 2025-02-21 |
| Craig-Hallum | Maintain | Buy | 2025-01-06 |
| JP Morgan | Upgrade | Overweight | 2024-12-09 |
| JP Morgan | Maintain | Neutral | 2024-10-21 |
| Northland Capital Markets | Maintain | Outperform | 2024-10-18 |
| Northland Capital Markets | Maintain | Outperform | 2024-09-04 |
Credo Technology Group Holding Ltd Grades
Below is a summary of recent grades from leading institutions for Credo Technology Group Holding Ltd.
| Grading Company | Action | New Grade | Date |
|---|---|---|---|
| Needham | Maintain | Buy | 2025-12-02 |
| B of A Securities | Maintain | Buy | 2025-12-02 |
| Barclays | Maintain | Overweight | 2025-12-02 |
| Mizuho | Maintain | Outperform | 2025-12-02 |
| Roth Capital | Maintain | Buy | 2025-12-02 |
| Susquehanna | Maintain | Positive | 2025-10-22 |
| Barclays | Maintain | Overweight | 2025-10-07 |
| Susquehanna | Maintain | Positive | 2025-09-04 |
| Roth Capital | Maintain | Buy | 2025-09-04 |
| Barclays | Maintain | Overweight | 2025-09-04 |
Which company has the best grades?
Both companies receive mostly positive grades from respected institutions. Credo Technology holds a slight edge with a consistent “Buy” and “Overweight” consensus from multiple firms. Nokia shows strong support but with fewer upgrades to outright “Buy.” Investors may interpret Credo’s grades as signaling more bullish sentiment.
Risks specific to each company
The following categories identify the critical pressure points and systemic threats facing both firms in the 2026 market environment:
1. Market & Competition
Nokia Oyj
- Faces intense competition in global 5G and network infrastructure markets, with pressure from larger incumbents and emerging tech firms.
Credo Technology Group Holding Ltd
- Operates in niche high-speed connectivity with fewer direct competitors but risks from rapid innovation and market adoption cycles.
2. Capital Structure & Debt
Nokia Oyj
- Maintains a conservative capital structure with low debt-to-equity (0.25) and strong interest coverage, limiting financial risk.
Credo Technology Group Holding Ltd
- Extremely low debt levels (0.02 D/E) reduce leverage risk, but elevated WACC (16.33%) signals expensive capital.
3. Stock Volatility
Nokia Oyj
- Exhibits low beta (0.51), indicating relative stability and lower sensitivity to market swings.
Credo Technology Group Holding Ltd
- Demonstrates high beta (2.66), exposing shareholders to significant price volatility and market risk.
4. Regulatory & Legal
Nokia Oyj
- Subject to stringent telecommunications regulations globally; intellectual property licensing poses moderate legal risks.
Credo Technology Group Holding Ltd
- Faces regulatory scrutiny in multiple jurisdictions; newer public company status may amplify compliance costs and risks.
5. Supply Chain & Operations
Nokia Oyj
- Large, complex supply chain with potential exposure to global disruptions but benefits from diversified sourcing and scale.
Credo Technology Group Holding Ltd
- Smaller scale supply chain with potential vulnerability to component shortages and operational bottlenecks.
6. ESG & Climate Transition
Nokia Oyj
- Increasingly integrates ESG principles; climate transition risks are moderate given industry focus on sustainable networks.
Credo Technology Group Holding Ltd
- ESG initiatives less mature; may face growing pressure to align with environmental standards amid investor scrutiny.
7. Geopolitical Exposure
Nokia Oyj
- Exposed to geopolitical risks due to global footprint, especially tensions affecting supply chains in Asia and Europe.
Credo Technology Group Holding Ltd
- Concentrated US and China operations expose it to US-China trade tensions and export control risks.
Which company shows a better risk-adjusted profile?
Nokia’s strongest risk factor is competitive pressure in the commoditized telecom equipment market. Credo confronts significant stock volatility and high capital costs, raising investment risk. Nokia’s conservative debt profile and lower beta give it a superior risk-adjusted stance. Credo’s high beta (2.66) and elevated WACC (16.33%) heighten vulnerability despite niche positioning. Nokia’s stable financing and dividend yield (2.43%) justify cautious preference amid market uncertainties.
Final Verdict: Which stock to choose?
Nokia Oyj’s superpower lies in its resilient balance sheet and steady cash generation, positioning it as a reliable cash machine. Its point of vigilance is the declining profitability and value destruction trend, which could pressure long-term returns. Nokia suits portfolios focused on income stability and moderate growth.
Credo Technology Group Holding’s strategic moat is its rapid revenue and profitability growth fueled by innovation and R&D intensity. While it carries higher valuation risk and cash flow volatility, it offers better growth momentum and improving profitability metrics than Nokia. Credo fits growth-oriented portfolios willing to embrace elevated risk for outsized returns.
If you prioritize financial stability and consistent cash flow, Nokia stands out due to its solid balance sheet and dividend yield despite profitability challenges. However, if you seek aggressive growth with significant upside potential, Credo outshines by delivering rapid earnings expansion and innovation-driven growth, albeit with greater valuation risk. Each presents a distinct analytical scenario aligned with different investor risk profiles.
Disclaimer: Investment carries a risk of loss of initial capital. The past performance is not a reliable indicator of future results. Be sure to understand risks before making an investment decision.
Go Further
I encourage you to read the complete analyses of Nokia Oyj and Credo Technology Group Holding Ltd to enhance your investment decisions: