In the dynamic world of communication equipment, Hewlett Packard Enterprise Company (HPE) and Credo Technology Group Holding Ltd (CRDO) stand out with distinct approaches to innovation and market presence. HPE, a tech giant with a broad portfolio, contrasts with CRDO’s focused expertise in high-speed connectivity solutions. This comparison explores their strategies, market overlaps, and growth potential to help you decide which company could be a smarter addition to your investment portfolio.
Table of contents
Companies Overview
I will begin the comparison between Hewlett Packard Enterprise Company and Credo Technology Group Holding Ltd by providing an overview of these two companies and their main differences.
Hewlett Packard Enterprise Company Overview
Hewlett Packard Enterprise Company focuses on delivering solutions that enable customers to capture, analyze, and act on data across multiple regions including the Americas, Europe, and Asia Pacific. It offers a broad range of servers, storage, networking hardware, software, and services designed for various workloads and intelligent edge applications. Founded in 1939 and headquartered in Houston, Texas, HPE serves commercial and large enterprise groups worldwide.
Credo Technology Group Holding Ltd Overview
Credo Technology Group Holding Ltd specializes in high-speed connectivity solutions for optical and electrical Ethernet applications, providing integrated circuits, active electrical cables, and SerDes chiplets. The company also offers intellectual property licensing based on its serializer/deserializer and digital signal processor technologies. Founded in 2008, Credo is headquartered in San Jose, California, and targets a global market including the US, Mexico, and China.
Key similarities and differences
Both companies operate in the communication equipment industry within the technology sector and serve global markets with advanced hardware solutions. HPE has a much larger workforce and a wider product portfolio that includes servers, storage, and network management services, while Credo focuses more narrowly on high-speed connectivity chips and IP licensing. HPE’s market cap is slightly larger at $29.5B versus Credo’s $27.7B, reflecting differences in scale and market reach.
Income Statement Comparison
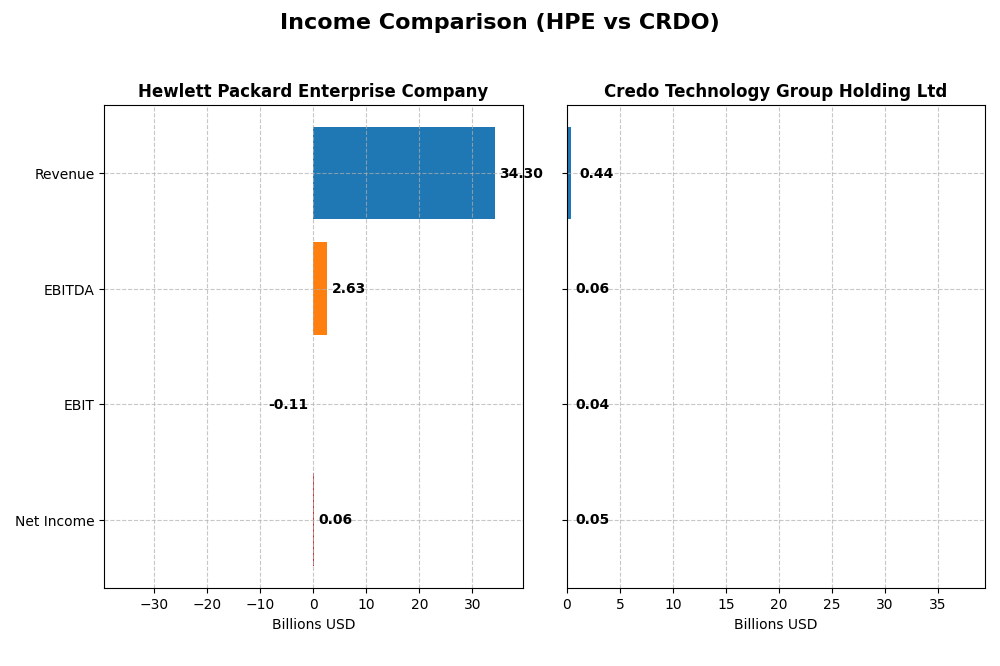
The table below presents a side-by-side comparison of the most recent fiscal year income statement metrics for Hewlett Packard Enterprise Company and Credo Technology Group Holding Ltd, providing a clear financial snapshot.
| Metric | Hewlett Packard Enterprise Company | Credo Technology Group Holding Ltd |
|---|---|---|
| Market Cap | 29.5B USD | 27.7B USD |
| Revenue | 34.3B USD | 437M USD |
| EBITDA | 2.63B USD | 60M USD |
| EBIT | -110M USD | 38M USD |
| Net Income | 57M USD | 52M USD |
| EPS | -0.045 USD | 0.31 USD |
| Fiscal Year | 2025 | 2025 |
Income Statement Interpretations
Hewlett Packard Enterprise Company
HPE’s revenue rose steadily from $27.9B in 2021 to $34.3B in 2025, reflecting a 23.08% growth over five years. However, net income sharply declined, turning negative to -$59M in 2025 from $3.4B in 2021. Gross margin remained stable near 28.8%, but EBIT margin deteriorated to -0.32%. The 2025 results show revenue growth slowed to 14.1%, while net margin and EPS worsened significantly.
Credo Technology Group Holding Ltd
Credo demonstrated strong revenue growth from $59M in 2021 to $437M in 2025, a 644.1% increase. Its net income improved impressively from a -$27.5M loss in 2021 to $52.2M profit in 2025. Gross margin rose to 64.8%, with net margin reaching 12%. The latest year delivered exceptional growth in revenue (126.3%) and net income (181.3%), alongside marked EPS expansion, signaling robust operational improvements.
Which one has the stronger fundamentals?
Credo shows superior fundamentals with consistent and strong growth in revenue, net income, and margins, supported by favorable profitability ratios and expanding EPS. In contrast, HPE’s fundamentals are weaker, with declining net income and negative EBIT margin despite steady revenue gains. Overall, Credo’s income statement profile appears more favorable and resilient over the analyzed period.
Financial Ratios Comparison
Below is a comparison of key financial ratios for Hewlett Packard Enterprise Company (HPE) and Credo Technology Group Holding Ltd (CRDO) for their most recent fiscal years.
| Ratios | Hewlett Packard Enterprise Company (2025) | Credo Technology Group Holding Ltd (2025) |
|---|---|---|
| ROE | 0.23% | 7.66% |
| ROIC | -0.59% | 5.01% |
| P/E | 567.2 | 138.2 |
| P/B | 1.31 | 10.58 |
| Current Ratio | 1.01 | 6.62 |
| Quick Ratio | 0.76 | 5.79 |
| D/E (Debt-to-Equity) | 0.91 | 0.02 |
| Debt-to-Assets | 29.5% | 2.0% |
| Interest Coverage | 9.39 | 0 |
| Asset Turnover | 0.45 | 0.54 |
| Fixed Asset Turnover | 5.71 | 5.54 |
| Payout ratio | 14.0% | 0 |
| Dividend yield | 2.46% | 0% |
Interpretation of the Ratios
Hewlett Packard Enterprise Company
HPE shows a mix of strong and weak financial ratios, with 35.7% favorable and 50% unfavorable indicators, leading to a slightly unfavorable overall assessment. Key concerns include very high P/E at 567.23 and negative return on invested capital (-59%). The company maintains a modest dividend yield of 2.46%, supported by free cash flow, but some coverage metrics and interest burden remain weak.
Credo Technology Group Holding Ltd
Credo presents balanced ratios with 42.9% favorable and 42.9% unfavorable, resulting in a neutral overall opinion. It boasts a strong net margin of 11.95% and excellent liquidity ratios, but suffers from a high weighted average cost of capital (16.29%) and elevated price multiples. The company does not pay dividends, likely reflecting reinvestment in growth and R&D priorities.
Which one has the best ratios?
Comparing the two, Credo holds a neutral stance with a better net margin and liquidity, while HPE is slightly unfavorable due to weaker profitability and high valuation multiples. Both have strengths and weaknesses, but Credo’s ratios indicate a more balanced financial position whereas HPE faces greater profitability and cash flow challenges.
Strategic Positioning
This section compares the strategic positioning of Hewlett Packard Enterprise Company (HPE) and Credo Technology Group Holding Ltd (CRDO) in terms of market position, key segments, and exposure to technological disruption:
Hewlett Packard Enterprise Company
- Large market cap of 29.5B USD with competitive pressure in communication equipment industry.
- Diversified business segments including servers, hybrid cloud, networking, and financial services.
- Invests in communications, media solutions, and partners for real-time analytics; exposure to evolving IT infrastructure.
Credo Technology Group Holding Ltd
- Market cap of 27.7B USD, operating in communication equipment with higher beta indicating volatility.
- Focused on high-speed connectivity solutions, integrated circuits, and IP licensing.
- Specialized in serializer/deserializer technologies and IP licensing, focusing on optical and electrical Ethernet.
Hewlett Packard Enterprise Company vs Credo Technology Group Holding Ltd Positioning
HPE adopts a diversified approach across multiple technology segments, offering broad solutions worldwide, which may reduce dependency on any single market. CRDO concentrates on niche high-speed connectivity technologies, potentially allowing focused innovation but increasing segment risk.
Which has the best competitive advantage?
Both companies are shedding value as ROIC is below WACC; however, CRDO shows a growing ROIC trend, implying improving profitability, while HPE’s declining ROIC suggests deteriorating capital efficiency. This indicates CRDO may have a slightly stronger competitive advantage despite current value destruction.
Stock Comparison
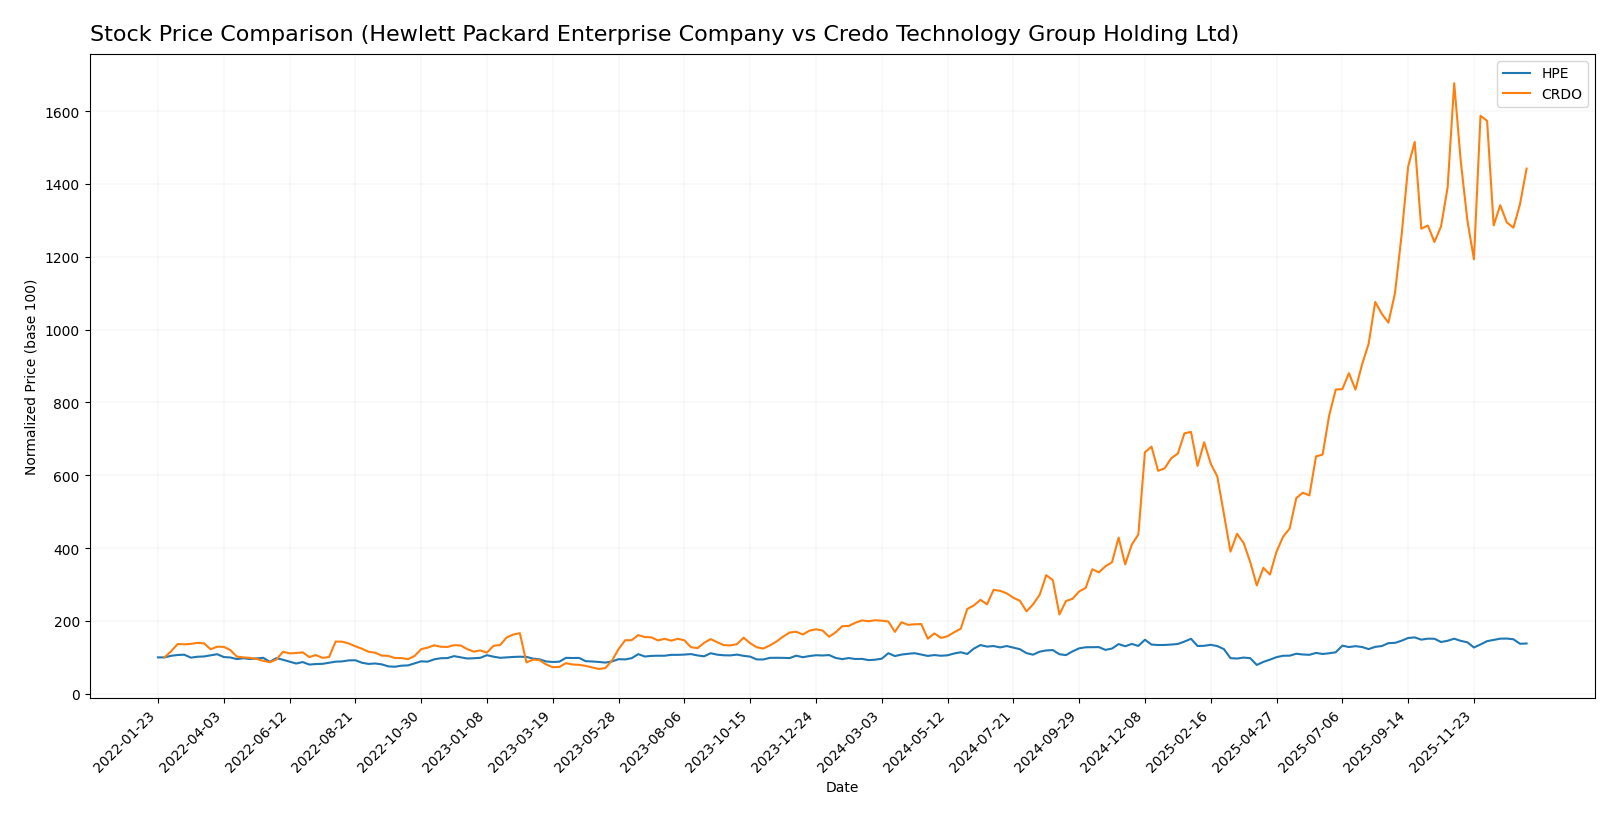
The past year saw both Hewlett Packard Enterprise Company and Credo Technology Group Holding Ltd exhibit strong bullish trends with notable price appreciations, though recent months reveal a short-term pullback in both stocks.
Trend Analysis
Hewlett Packard Enterprise Company’s stock experienced a bullish trend over the past 12 months with a 47.52% price increase, showing deceleration and a highest price of 24.99; recent weeks indicate a slight downward trend with an 8.72% decline.
Credo Technology Group Holding Ltd demonstrated a robust bullish trend over the same period, soaring 614.07% amid high volatility and deceleration; however, it faced a sharper recent decline of 13.99% with increased volatility.
Comparing both, Credo Technology Group Holding Ltd delivered significantly higher overall market performance than Hewlett Packard Enterprise Company, despite both stocks showing recent short-term weakening.
Target Prices
The current analyst consensus reveals promising upside potential for both Hewlett Packard Enterprise Company and Credo Technology Group Holding Ltd.
| Company | Target High | Target Low | Consensus |
|---|---|---|---|
| Hewlett Packard Enterprise Company | 31 | 21 | 27.25 |
| Credo Technology Group Holding Ltd | 250 | 160 | 217.5 |
Analysts expect Hewlett Packard Enterprise’s stock to rise significantly above its current price of 22.30 USD, while Credo Technology shows even stronger upside potential relative to its current price of 161.38 USD.
Analyst Opinions Comparison
This section compares analysts’ ratings and grades for Hewlett Packard Enterprise Company (HPE) and Credo Technology Group Holding Ltd (CRDO):
Rating Comparison
HPE Rating
- Rating: B-, assessed as Very Favorable overall rating by analysts.
- Discounted Cash Flow Score: 4, indicating a Favorable valuation based on future cash flow.
- ROE Score: 2, a Moderate efficiency in generating profit from equity.
- ROA Score: 2, showing Moderate effectiveness in asset utilization.
- Debt To Equity Score: 1, Very Unfavorable due to high financial risk.
- Overall Score: 2, Moderate financial standing overall.
CRDO Rating
- Rating: B, also categorized as Very Favorable overall rating.
- Discounted Cash Flow Score: 1, considered Very Unfavorable for valuation.
- ROE Score: 4, assessed as Favorable for profit generation from equity.
- ROA Score: 5, rated Very Favorable for asset utilization efficiency.
- Debt To Equity Score: 4, Favorable with lower financial risk.
- Overall Score: 3, Moderate but higher than HPE.
Which one is the best rated?
Based strictly on the provided data, CRDO holds a better overall rating (B vs. B-) and scores higher in ROE, ROA, debt-to-equity, and overall financial standing. However, HPE has a superior discounted cash flow score indicating a more favorable valuation in that metric.
Scores Comparison
Here is the comparison of the Altman Z-Score and Piotroski Score for Hewlett Packard Enterprise Company (HPE) and Credo Technology Group Holding Ltd (CRDO):
HPE Scores
- Altman Z-Score: 0.75, in distress zone indicating high bankruptcy risk.
- Piotroski Score: 5, classified as average financial strength.
CRDO Scores
- Altman Z-Score: 100.37, in safe zone indicating very low bankruptcy risk.
- Piotroski Score: 5, classified as average financial strength.
Which company has the best scores?
Based on the provided data, CRDO has a significantly stronger Altman Z-Score in the safe zone, while both companies have the same average Piotroski Score of 5. Thus, CRDO demonstrates better overall scores.
Grades Comparison
Here is a comparison of the recent grades assigned to Hewlett Packard Enterprise Company and Credo Technology Group Holding Ltd:
Hewlett Packard Enterprise Company Grades
The following table summarizes recent grades from established grading companies for Hewlett Packard Enterprise Company:
| Grading Company | Action | New Grade | Date |
|---|---|---|---|
| Argus Research | Maintain | Buy | 2025-12-10 |
| BWG Global | Upgrade | Positive | 2025-11-24 |
| Morgan Stanley | Downgrade | Equal Weight | 2025-11-17 |
| Barclays | Maintain | Overweight | 2025-10-16 |
| Goldman Sachs | Maintain | Neutral | 2025-10-16 |
| UBS | Maintain | Neutral | 2025-10-16 |
| Citigroup | Maintain | Buy | 2025-10-06 |
| Goldman Sachs | Maintain | Neutral | 2025-10-02 |
| Citigroup | Maintain | Buy | 2025-09-04 |
| UBS | Maintain | Neutral | 2025-09-04 |
Overall, Hewlett Packard Enterprise shows a mixed but generally positive trend with several buy ratings and some neutral or equal weight ratings.
Credo Technology Group Holding Ltd Grades
The following table summarizes recent grades from established grading companies for Credo Technology Group Holding Ltd:
| Grading Company | Action | New Grade | Date |
|---|---|---|---|
| B of A Securities | Maintain | Buy | 2025-12-02 |
| Needham | Maintain | Buy | 2025-12-02 |
| Mizuho | Maintain | Outperform | 2025-12-02 |
| Roth Capital | Maintain | Buy | 2025-12-02 |
| Barclays | Maintain | Overweight | 2025-12-02 |
| Susquehanna | Maintain | Positive | 2025-10-22 |
| Barclays | Maintain | Overweight | 2025-10-07 |
| Barclays | Maintain | Overweight | 2025-09-04 |
| TD Cowen | Maintain | Buy | 2025-09-04 |
| Needham | Maintain | Buy | 2025-09-04 |
Credo Technology Group Holding Ltd maintains a consistent pattern of buy and outperform ratings, indicating strong analyst support.
Which company has the best grades?
Credo Technology Group Holding Ltd generally holds stronger and more consistent buy and outperform grades compared to Hewlett Packard Enterprise Company, whose ratings include more neutral and hold positions. This difference may affect investor sentiment, potentially favoring Credo for growth-oriented portfolios.
Strengths and Weaknesses
Below is a comparison table highlighting key strengths and weaknesses of Hewlett Packard Enterprise Company (HPE) and Credo Technology Group Holding Ltd (CRDO) based on the most recent data.
| Criterion | Hewlett Packard Enterprise Company (HPE) | Credo Technology Group Holding Ltd (CRDO) |
|---|---|---|
| Diversification | Highly diversified across Hybrid Cloud, Networking, Servers, and Financial Services with $17.7B in Servers and $6.85B in Networking (2025) | Less diversified, focused largely on Product sales ($412M) and engineering services |
| Profitability | Low profitability with negative ROIC (-0.59%) and net margin at 0.17%, indicating value destruction | Moderate profitability with 11.95% net margin, positive ROIC (5.01%), but still shedding value overall |
| Innovation | Moderate innovation presence reflected in Hybrid Cloud and Intelligent Edge segments | Innovation driven by product engineering services, showing revenue growth in engineering and licensing |
| Global presence | Large global footprint through diversified enterprise IT solutions | Smaller global reach, more niche market presence in semiconductors and engineering |
| Market Share | Strong market share in enterprise servers and networking segments | Smaller market share, but growing with increased product licensing and engineering revenues |
Key takeaways: HPE shows strong diversification and market presence but struggles with profitability and value creation. CRDO has a more focused business model with improving profitability and innovation, though it remains a smaller player with moderate risk. Careful consideration of growth potential against current value destruction is advised.
Risk Analysis
Below is a comparison table of key risks for Hewlett Packard Enterprise Company (HPE) and Credo Technology Group Holding Ltd (CRDO) based on the most recent data from 2025.
| Metric | Hewlett Packard Enterprise Company (HPE) | Credo Technology Group Holding Ltd (CRDO) |
|---|---|---|
| Market Risk | Beta 1.33, moderate market sensitivity | Beta 2.66, high volatility and sensitivity |
| Debt level | Debt-to-Equity 0.91 (neutral), Interest Coverage negative (-0.63) | Debt-to-Equity 0.02 (favorable), Interest Coverage infinite (strong) |
| Regulatory Risk | Moderate, due to global operations and tech sector compliance | Moderate, with exposure in US and China markets |
| Operational Risk | High, large scale with 61K employees and complex global supply chains | Moderate, smaller scale (500 employees) and niche product focus |
| Environmental Risk | Moderate, technology hardware manufacturing impact | Low to moderate, semiconductor industry with environmental regulations |
| Geopolitical Risk | High, operations in multiple regions including sensitive markets | Moderate, with exposure to US-China trade relations |
In synthesis, HPE faces significant operational and geopolitical risks given its size and global footprint, alongside financial strain from negative interest coverage. CRDO exhibits higher market volatility but benefits from a very low debt burden and strong interest coverage, making financial distress unlikely. Investors should weigh HPE’s operational complexity and financial weakness against CRDO’s valuation concerns and market sensitivity.
Which Stock to Choose?
Hewlett Packard Enterprise Company (HPE) shows a mixed income evolution with 14.06% revenue growth but declining net margin and EPS. Its financial ratios are slightly unfavorable overall, reflecting low profitability and high debt, yet it holds a very favorable B- rating. The company is shedding value with a very unfavorable MOAT score due to a declining ROIC below WACC.
Credo Technology Group Holding Ltd (CRDO) exhibits strong income growth, including 126.34% revenue and 181.27% net margin increases, alongside mostly favorable financial ratios despite some high valuation multiples. Its rating is very favorable at B, with a slightly unfavorable MOAT status indicating value destruction but improving profitability and a strong ROIC trend.
Investors focused on growth might find CRDO’s robust income expansion and improving profitability appealing, while those prioritizing established ratings and moderate financial stability could see HPE’s consistent market presence and moderate rating as more suitable. The choice may depend on tolerance for valuation risks and preference for either dynamic growth or relative stability.
Disclaimer: Investment carries a risk of loss of initial capital. The past performance is not a reliable indicator of future results. Be sure to understand risks before making an investment decision.
Go Further
I encourage you to read the complete analyses of Hewlett Packard Enterprise Company and Credo Technology Group Holding Ltd to enhance your investment decisions: