Unilever PLC and Coty Inc. are two prominent players in the Household & Personal Products industry, each with distinct market approaches and innovation strategies. Unilever, a global giant with a diverse product portfolio, contrasts with Coty’s focus on beauty and prestige brands. This comparison highlights their competitive positioning and growth potential. Join me as we explore which company presents a more compelling investment opportunity in 2026.
Table of contents
Companies Overview
I will begin the comparison between Unilever PLC and Coty Inc. by providing an overview of these two companies and their main differences.
Unilever PLC Overview
Unilever PLC operates as a fast-moving consumer goods company headquartered in London. Its mission focuses on providing products across Beauty & Personal Care, Foods & Refreshment, and Home Care segments. The company holds a strong market position with a broad portfolio including well-known brands such as Dove, Ben & Jerry’s, and Knorr, serving global consumers with diverse household and personal products.
Coty Inc. Overview
Coty Inc., based in New York City, is engaged in manufacturing, marketing, and distributing beauty products worldwide. Its offerings span prestige fragrances, skin care, and color cosmetics, marketed through various retail channels. Coty’s portfolio includes brands like Calvin Klein, Gucci, and CoverGirl, supported by a presence in approximately 150 countries, targeting both high-end and mass-market consumer segments.
Key similarities and differences
Both Unilever and Coty operate within the Household & Personal Products industry under the Consumer Defensive sector, focusing on beauty and personal care products. Unilever’s model is broader, including food and home care, while Coty specializes more narrowly in beauty and cosmetics. Unilever boasts a significantly larger market cap and workforce, reflecting its diversified product range and global reach compared to Coty’s more focused beauty portfolio.
Income Statement Comparison
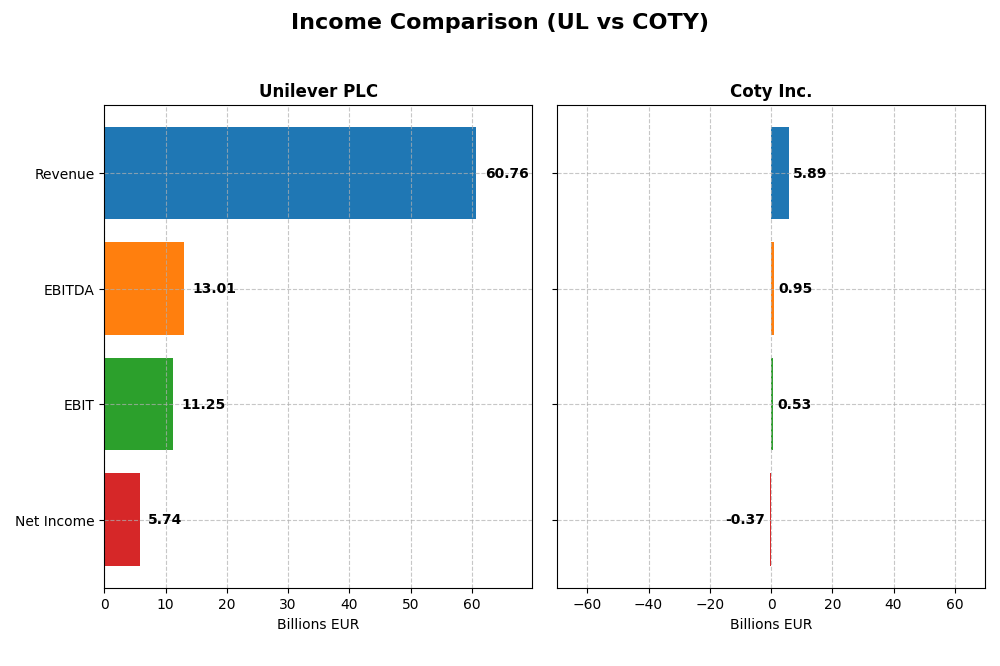
Below is a side-by-side comparison of key income statement metrics for Unilever PLC and Coty Inc. for their most recent fiscal years.
| Metric | Unilever PLC (2024) | Coty Inc. (2025) |
|---|---|---|
| Market Cap | 141B EUR | 2.8B USD |
| Revenue | 60.8B EUR | 5.9B USD |
| EBITDA | 13.0B EUR | 950M USD |
| EBIT | 11.3B EUR | 530M USD |
| Net Income | 5.7B EUR | -368M USD |
| EPS | 2.3 EUR | -0.44 USD |
| Fiscal Year | 2024 | 2025 |
Income Statement Interpretations
Unilever PLC
Unilever’s revenue shows a steady upward trend from €50.7B in 2020 to €60.8B in 2024, with net income fluctuating but generally positive, peaking at €7.6B in 2022 before dropping to €5.7B in 2024. Margins remain strong, with a gross margin of 100% and a favorable EBIT margin around 18.5%. The recent year saw a minor revenue growth slowdown and a decline in net margin and EPS, signaling some margin pressure.
Coty Inc.
Coty experienced revenue growth from $4.6B in 2021 to $6.1B in 2024, but net income remains volatile, turning negative in 2025 with a net loss of $367.9M. Gross margin is favorable at nearly 65%, but the EBIT margin is neutral and net margin unfavorable, reflecting operating challenges. The latest year shows declining revenue and profitability, with sharp drops in net margin and EPS growth, indicating deteriorating profitability.
Which one has the stronger fundamentals?
Unilever displays stronger fundamentals, supported by consistent revenue growth, robust margins, and overall favorable income statement evaluations. Coty, despite revenue expansion, suffers from significant net income losses and unfavorable margin trends, reflecting weaker profitability and operational challenges. Unilever’s stable margins and positive earnings contrast with Coty’s ongoing earnings decline and negative net margin.
Financial Ratios Comparison
The table below compares key financial ratios of Unilever PLC and Coty Inc. for their most recent fiscal years, providing a snapshot of profitability, liquidity, leverage, efficiency, and dividend metrics.
| Ratios | Unilever PLC (2024) | Coty Inc. (2025) |
|---|---|---|
| ROE | 28.7% | -10.0% |
| ROIC | 11.1% | 2.6% |
| P/E | 23.9 | -11.0 |
| P/B | 6.87 | 1.10 |
| Current Ratio | 0.76 | 0.77 |
| Quick Ratio | 0.56 | 0.46 |
| D/E (Debt-to-Equity) | 1.53 | 1.15 |
| Debt-to-Assets | 38.4% | 35.7% |
| Interest Coverage | 8.41 | 1.06 |
| Asset Turnover | 0.76 | 0.49 |
| Fixed Asset Turnover | 5.21 | 6.04 |
| Payout Ratio | 75.2% | -3.6% |
| Dividend Yield | 3.14% | 0.33% |
Interpretation of the Ratios
Unilever PLC
Unilever shows a mix of strong and weak ratios. Its return on equity (28.73%) and return on invested capital (11.12%) are favorable, indicating efficient capital use. However, liquidity ratios such as the current ratio (0.76) and quick ratio (0.56) are unfavorable, suggesting potential short-term liquidity concerns. The company pays dividends with a 3.14% yield, supported by a reasonable payout ratio, but the elevated price-to-book ratio (6.87) may warrant caution.
Coty Inc.
Coty’s ratios indicate more challenges, with negative net margin (-6.24%) and return on equity (-9.98%), reflecting operational difficulties. Liquidity ratios are also weak, with a current ratio of 0.77 and quick ratio of 0.46. The low dividend yield of 0.33% aligns with no recent dividend payments, likely due to negative income and a focus on restructuring. Despite some favorable valuations like a low price-to-book (1.1), overall financial health appears strained.
Which one has the best ratios?
Unilever demonstrates a more balanced and slightly favorable financial profile with strong profitability and capital efficiency metrics, despite some liquidity weaknesses. Coty faces significant profitability and liquidity challenges, reflected in its unfavorable global ratios assessment. Based on the data, Unilever’s ratios are generally stronger and more stable compared to Coty’s.
Strategic Positioning
This section compares the strategic positioning of Unilever PLC and Coty Inc. in terms of Market position, Key segments, and Exposure to technological disruption:
Unilever PLC
- Large market cap of 140.6B USD with low beta 0.223, indicating stable competitive pressure.
- Diversified segments: Beauty & Personal Care, Foods & Refreshment, Home Care.
- No explicit data on technological disruption exposure provided.
Coty Inc.
- Smaller market cap of 2.79B USD and higher beta 0.958, suggesting more volatile competitive environment.
- Focused on beauty products with Prestige and Consumer Beauty segments as main business drivers.
- No explicit data on technological disruption exposure provided.
Unilever PLC vs Coty Inc. Positioning
Unilever exhibits a diversified business model across multiple consumer product categories, enhancing risk spread but requiring management complexity. Coty concentrates on beauty products, potentially allowing focused innovation but increasing segment risk exposure based on provided data.
Which has the best competitive advantage?
Unilever shows a slightly favorable moat with value creation despite declining profitability, indicating a more stable competitive advantage. Coty has a slightly unfavorable moat, currently shedding value but improving profitability, reflecting a less consistent competitive advantage.
Stock Comparison
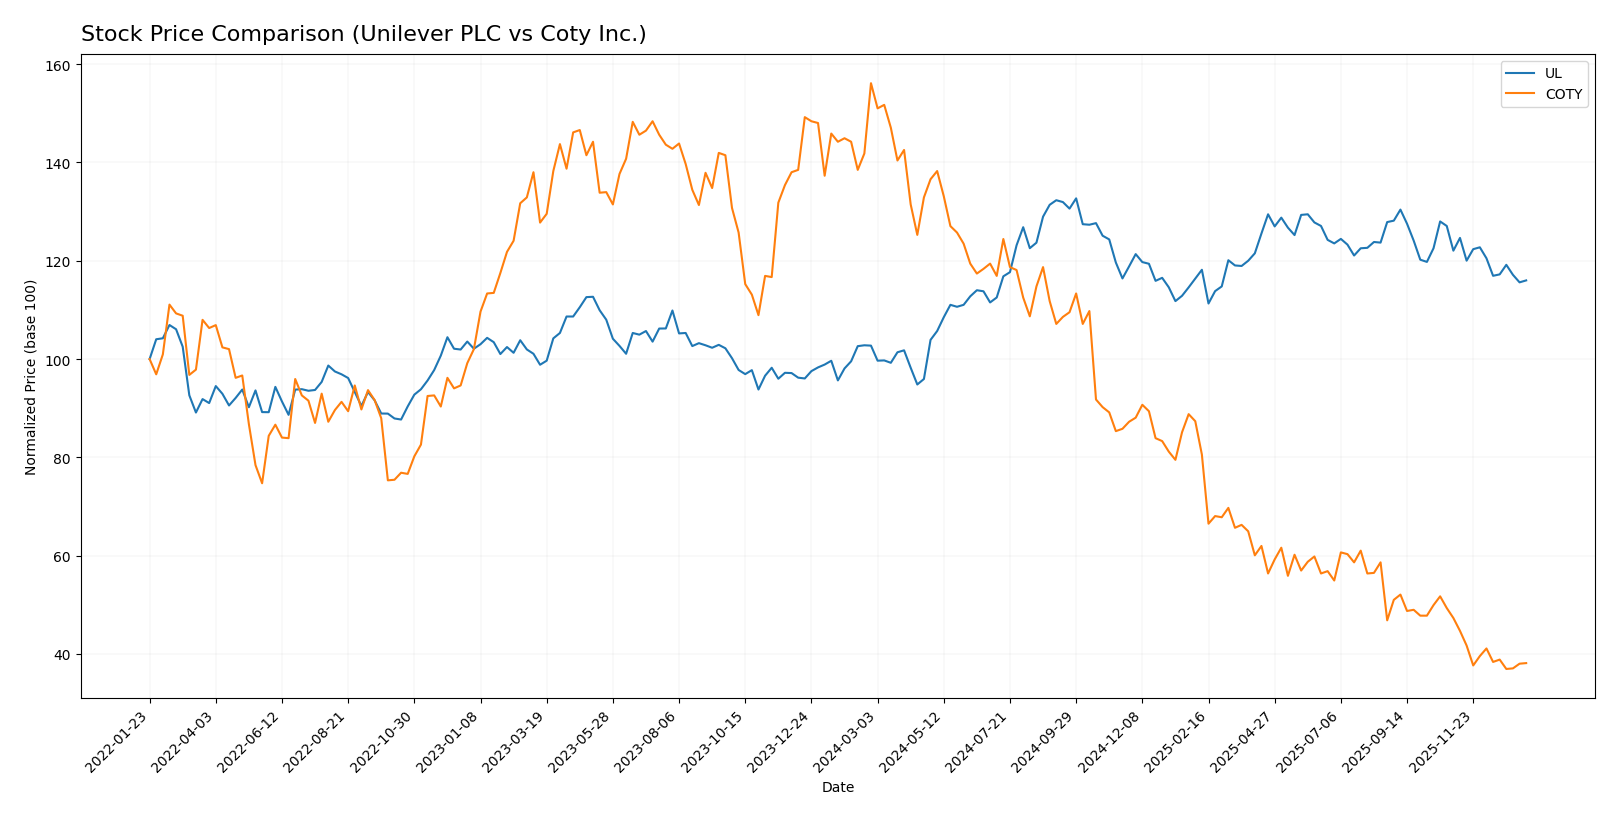
The stock price chart highlights significant divergence in price movements over the past year, with Unilever PLC showing a bullish trend despite recent deceleration, while Coty Inc. experiences a pronounced bearish trend accelerating downward.
Trend Analysis
Unilever PLC’s stock showed a bullish trend with a 12.92% gain over the past 12 months, though recent months reflect a slight reversal with a -4.96% decline and decelerating momentum.
Coty Inc.’s stock experienced a strong bearish trend, losing 75.57% over the last year with accelerating downward pressure and a recent 19.4% drop, indicating increasing weakness.
Comparing both stocks, Unilever PLC delivered the highest market performance with positive annual gains, whereas Coty Inc. faced severe depreciation throughout the same period.
Target Prices
Analysts present a clear target price consensus for Unilever PLC and Coty Inc.
| Company | Target High | Target Low | Consensus |
|---|---|---|---|
| Unilever PLC | 71 | 60.1 | 65.55 |
| Coty Inc. | 10 | 3.5 | 4.95 |
For Unilever, the consensus target price of 65.55 is slightly above the current stock price of 64.42, indicating moderate upside potential. Coty’s target consensus at 4.95 is notably higher than its current price of 3.2, suggesting analysts expect a significant recovery.
Analyst Opinions Comparison
This section compares analysts’ ratings and financial grades for Unilever PLC and Coty Inc.:
Rating Comparison
Unilever PLC Rating
- Rating: B+, rated very favorable overall.
- Discounted Cash Flow Score: 5, very favorable valuation.
- ROE Score: 5, very favorable profitability from equity.
- ROA Score: 4, favorable asset utilization.
- Debt To Equity Score: 1, very unfavorable financial risk.
- Overall Score: 3, moderate overall financial standing.
Coty Inc. Rating
- Rating: C+, rated very favorable overall.
- Discounted Cash Flow Score: 5, very favorable valuation.
- ROE Score: 1, very unfavorable profitability from equity.
- ROA Score: 1, very unfavorable asset utilization.
- Debt To Equity Score: 1, very unfavorable financial risk.
- Overall Score: 2, moderate overall financial standing.
Which one is the best rated?
Unilever holds a higher rating (B+) and stronger scores in ROE and ROA compared to Coty, which has a lower rating (C+) and weaker profitability and asset utilization scores. Both share similar debt risk levels.
Scores Comparison
Here is a comparison of the financial health scores for Unilever PLC and Coty Inc.:
UL Scores
- Altman Z-Score: 4.85, indicating financial safety in the safe zone.
- Piotroski Score: 6, reflecting average financial strength.
COTY Scores
- Altman Z-Score: 0.01, signaling high bankruptcy risk in distress zone.
- Piotroski Score: 4, also indicating average financial strength.
Which company has the best scores?
Based on these scores, Unilever PLC is in the safe zone with a strong Altman Z-Score, while Coty Inc. is in distress. Both have average Piotroski Scores, but Unilever’s overall financial stability appears superior.
Grades Comparison
Here is a detailed comparison of the latest reliable grades for Unilever PLC and Coty Inc.:
Unilever PLC Grades
The following table summarizes recent grades from recognized financial institutions for Unilever PLC:
| Grading Company | Action | New Grade | Date |
|---|---|---|---|
| Erste Group | Downgrade | Hold | 2024-11-19 |
| B of A Securities | Upgrade | Buy | 2024-08-22 |
| JP Morgan | Upgrade | Overweight | 2024-05-23 |
| Argus Research | Maintain | Buy | 2024-05-08 |
| Morgan Stanley | Downgrade | Underweight | 2024-02-27 |
| Bernstein | Upgrade | Market Perform | 2022-03-14 |
| Deutsche Bank | Downgrade | Hold | 2021-09-16 |
Unilever’s grades show a mixed trend with several upgrades from underperform or underweight to buy or overweight, but also recent downgrades to hold and underweight, indicating some investor caution.
Coty Inc. Grades
The following table presents recent grades from recognized financial institutions for Coty Inc.:
| Grading Company | Action | New Grade | Date |
|---|---|---|---|
| Evercore ISI Group | Downgrade | In Line | 2025-12-23 |
| Citigroup | Maintain | Neutral | 2025-12-17 |
| TD Cowen | Maintain | Hold | 2025-12-12 |
| Berenberg | Downgrade | Hold | 2025-09-10 |
| Morgan Stanley | Maintain | Equal Weight | 2025-08-25 |
| RBC Capital | Maintain | Outperform | 2025-08-22 |
| Wells Fargo | Maintain | Equal Weight | 2025-08-22 |
| Goldman Sachs | Maintain | Neutral | 2025-08-22 |
| Barclays | Maintain | Underweight | 2025-08-22 |
| B of A Securities | Maintain | Underperform | 2025-08-22 |
Coty’s grades largely remain stable with a majority of holds, neutrals, and equal weights, along with some downgrades but also an outperform rating maintained by RBC Capital, reflecting mixed but steady sentiment.
Which company has the best grades?
Unilever PLC generally holds stronger grades with multiple buy and overweight ratings, despite some recent downgrades to hold and underweight. Coty Inc.’s grades are more conservative, centered around hold, neutral, and equal weight ratings with fewer upgrades. Investors may interpret Unilever’s grade pattern as reflecting a more favorable outlook with some caution, while Coty’s stable but less bullish grades suggest a more neutral risk-return profile.
Strengths and Weaknesses
Below is a comparison table highlighting the key strengths and weaknesses of Unilever PLC (UL) and Coty Inc. (COTY) based on their most recent financial and operational data.
| Criterion | Unilever PLC (UL) | Coty Inc. (COTY) |
|---|---|---|
| Diversification | Broad product portfolio across multiple consumer goods categories | Primarily focused on beauty segments with less diversification |
| Profitability | ROIC 11.12%, ROE 28.73%, net margin 9.45%, indicating solid profitability | Negative net margin (-6.24%) and ROE (-9.98%), profitability currently weak |
| Innovation | Slightly favorable economic moat with value creation but declining ROIC trend | Slightly unfavorable moat; value destruction but strong ROIC growth trend |
| Global presence | Strong global footprint with stable revenue streams | Global presence mainly in beauty markets but less diversified geographically |
| Market Share | Leading positions in various FMCG categories | Significant presence in prestige and consumer beauty, but market share challenged |
In summary, Unilever demonstrates solid profitability and diversification with a slightly favorable moat, though its profitability shows a declining trend. Coty is recovering with improving profitability metrics and ROIC growth but currently operates with weak profitability and a slightly unfavorable moat. Investors should weigh Unilever’s stability against Coty’s growth potential and risk profile.
Risk Analysis
Below is a comparison table highlighting key risk factors for Unilever PLC (UL) and Coty Inc. (COTY) based on the most recent data available.
| Metric | Unilever PLC (UL) | Coty Inc. (COTY) |
|---|---|---|
| Market Risk | Low beta (0.223) indicates lower volatility vs market | Higher beta (0.958) shows closer to market volatility |
| Debt level | DE ratio 1.53 (unfavorable), debt/assets 38.44% (neutral) | DE ratio 1.15 (unfavorable), debt/assets 35.65% (neutral) |
| Regulatory Risk | Moderate, global operations in consumer goods | Moderate, global cosmetics distribution with regulatory scrutiny |
| Operational Risk | Large scale, diversified segments reduce risk | Smaller scale, reliant on a few brands, higher operational risk |
| Environmental Risk | Increasing pressure on sustainability, but established initiatives | Facing pressure to enhance sustainability practices |
| Geopolitical Risk | Exposure to multiple regions but UK-based with global footprint | US-based with extensive international exposure, sensitive to trade policies |
In synthesis, Coty faces higher operational and financial risks with an unfavorable profitability profile and distress-zone Altman Z-score, reflecting potential liquidity or solvency concerns. Unilever, with a safer Altman Z-score and favorable return metrics, shows moderate debt risk but benefits from a more stable market position and lower volatility. Investors should weigh Coty’s higher risk against potential turnaround opportunities, while Unilever offers more stability but with some concerns on leverage and liquidity ratios.
Which Stock to Choose?
Unilever PLC (UL) shows a slightly favorable financial profile with stable income growth, a strong return on equity of 28.73%, and a manageable net debt to EBITDA ratio of 1.89. Despite some liquidity concerns, its overall rating is very favorable, supported by a B+ score and value creation indicated by an ROIC exceeding WACC.
Coty Inc. (COTY) faces challenges with declining income, negative net margin of -6.24%, and a higher net debt to EBITDA ratio of 4.20. Its financial ratios are mostly unfavorable, reflected in a moderate overall rating of C+ and a moat evaluation that signals value destruction despite a recent improvement in ROIC.
Investors prioritizing financial stability and value creation might find Unilever’s profile more appealing, given its favorable rating and income statement. Conversely, those with a tolerance for risk and interest in potential turnaround opportunities could see Coty’s improving ROIC trend as a positive signal, despite its current financial weaknesses.
Disclaimer: Investment carries a risk of loss of initial capital. The past performance is not a reliable indicator of future results. Be sure to understand risks before making an investment decision.
Go Further
I encourage you to read the complete analyses of Unilever PLC and Coty Inc. to enhance your investment decisions: