Home > Comparison > Consumer Defensive > PG vs COTY
The strategic rivalry between The Procter & Gamble Company and Coty Inc. shapes the Household & Personal Products industry’s future. Procter & Gamble operates as a diversified consumer defensive giant with broad product segments and global scale. Coty focuses on prestige and mass beauty products, relying on brand specialization and distribution breadth. This analysis evaluates which company’s operational model and strategic path deliver superior risk-adjusted returns for diversified investor portfolios.
Table of contents
Companies Overview
The Procter & Gamble Company and Coty Inc. dominate diverse segments of the global household and personal products market.
The Procter & Gamble Company: Consumer Packaged Goods Leader
The Procter & Gamble Company excels as a global leader in branded consumer packaged goods. Its revenue stems from five core segments: Beauty, Grooming, Health Care, Fabric & Home Care, and Baby, Feminine & Family Care. In 2026, P&G sharpened its focus on premium brand innovation and expanding e-commerce channels to sustain its market dominance.
Coty Inc.: Prestige and Mass Beauty Innovator
Coty Inc. operates as a major player in beauty products, blending prestige fragrances and mass-market cosmetics. It generates revenue through a vast portfolio of brands sold via department stores, perfumeries, and online outlets. Coty’s 2026 strategy emphasizes revitalizing its luxury segment while broadening direct-to-consumer sales.
Strategic Collision: Similarities & Divergences
Both companies focus on household and personal products, yet P&G prioritizes a diversified, segment-based portfolio, while Coty centers on beauty with a split between prestige and mass markets. Their primary battleground is the evolving consumer demand for premium and accessible products. This contrast defines distinct investment profiles: P&G offers stability through scale, Coty embraces growth through brand revitalization.
Income Statement Comparison
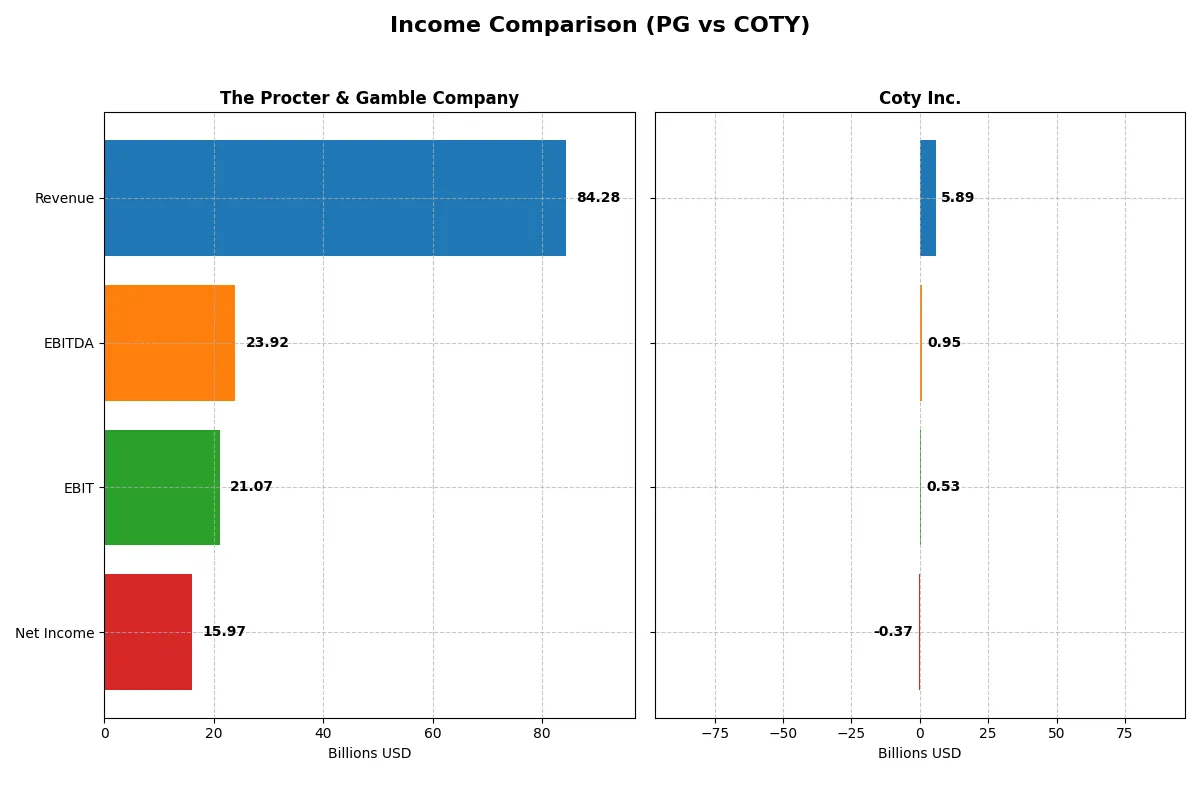
The following data dissects the core profitability and scalability of both corporate engines to reveal who dominates the bottom line:
| Metric | The Procter & Gamble Company (PG) | Coty Inc. (COTY) |
|---|---|---|
| Revenue | 84.3B | 5.9B |
| Cost of Revenue | 41.2B | 2.1B |
| Operating Expenses | 22.7B | 3.6B |
| Gross Profit | 43.1B | 3.8B |
| EBITDA | 23.9B | 950M |
| EBIT | 21.1B | 530M |
| Interest Expense | 907M | 227M |
| Net Income | 16.0B | -368M |
| EPS | 6.67 | -0.44 |
| Fiscal Year | 2025 | 2025 |
Income Statement Analysis: The Bottom-Line Duel
This income statement comparison uncovers which company runs a more efficient and profitable business engine over recent years.
The Procter & Gamble Company Analysis
P&G’s revenue grew steadily from 76B in 2021 to 84.3B in 2025, with net income rising from 14.3B to nearly 16B. The company maintains strong gross margins above 51% and a healthy net margin close to 19%, reflecting efficient cost controls. Fiscal 2025 saw EBIT and net income margins expand, signaling improving profitability momentum despite modest revenue growth.
Coty Inc. Analysis
Coty’s revenue climbed from 4.6B in 2021 to 5.9B in 2025 but net income turned negative last year, falling to a -381M loss. Coty boasts a higher gross margin near 65%, yet struggles with an unfavorable net margin of -6.24%, revealing operational inefficiencies and high expenses. The company’s earnings declined sharply in 2025, reflecting a troubling erosion in bottom-line performance.
Margin Strength vs. Profitability Consistency
P&G clearly leads with consistent profit growth and margin stability, while Coty’s superior gross margin fails to translate into net profitability. P&G’s steady, favorable income statement metrics mark it as the financially stronger enterprise. Investors may find P&G’s reliable earnings profile more attractive than Coty’s volatile and loss-making record.
Financial Ratios Comparison
These vital ratios act as a diagnostic tool to expose underlying fiscal health, valuation premiums, and capital efficiency among companies analyzed:
| Ratios | The Procter & Gamble Company (PG) | Coty Inc. (COTY) |
|---|---|---|
| ROE | 30.7% | -10.0% |
| ROIC | 16.5% | 2.6% |
| P/E | 24.5 | -11.0 |
| P/B | 7.52 | 1.10 |
| Current Ratio | 0.70 | 0.77 |
| Quick Ratio | 0.49 | 0.46 |
| D/E | 0.68 | 1.15 |
| Debt-to-Assets | 28.3% | 35.7% |
| Interest Coverage | 22.5 | 1.06 |
| Asset Turnover | 0.67 | 0.49 |
| Fixed Asset Turnover | 3.53 | 6.04 |
| Payout ratio | 61.8% | -3.6% |
| Dividend yield | 2.52% | 0.33% |
| Fiscal Year | 2025 | 2025 |
Efficiency & Valuation Duel: The Vital Signs
Ratios act as the company’s DNA, revealing hidden risks and operational excellence crucial for investment decisions.
The Procter & Gamble Company
Procter & Gamble demonstrates strong profitability with a 30.7% ROE and a solid 18.95% net margin. The stock trades at a neutral P/E of 24.5, reflecting fair valuation but an unfavorable P/B of 7.5 suggests premium pricing. It returns value with a 2.5% dividend yield, combining efficiency with steady shareholder rewards.
Coty Inc.
Coty struggles with a negative ROE near -10% and a -6.2% net margin, signaling operational challenges. Despite a favorable low P/E and P/B, these valuations reflect distress rather than opportunity. Coty’s dividend yield is weak at 0.3%, indicating limited returns while it faces a high debt load and unfavorable asset turnover.
Premium Valuation vs. Operational Safety
Procter & Gamble offers a better balance of profitability, valuation, and shareholder returns, reflecting operational safety. Coty’s metrics expose risk and inefficiency despite cheaper multiples. Investors prioritizing stability and returns will lean toward Procter & Gamble’s mature profile.
Which one offers the Superior Shareholder Reward?
I see Procter & Gamble (PG) commits to a robust dividend yield around 2.5% with a 62% payout ratio, well-covered by free cash flow. PG also executes steady buybacks, enhancing total return. Coty (COTY) yields a mere 0.3%, with an inconsistent payout and weaker free cash flow coverage. Coty’s buyback activity is modest, reflecting its uneven profitability and higher leverage. I judge PG’s disciplined distribution and capital allocation as far more sustainable. PG offers superior total shareholder reward in 2026, balancing income with growth and risk management.
Comparative Score Analysis: The Strategic Profile
The radar chart reveals the fundamental DNA and trade-offs of The Procter & Gamble Company and Coty Inc., highlighting their distinct financial strengths and weaknesses:
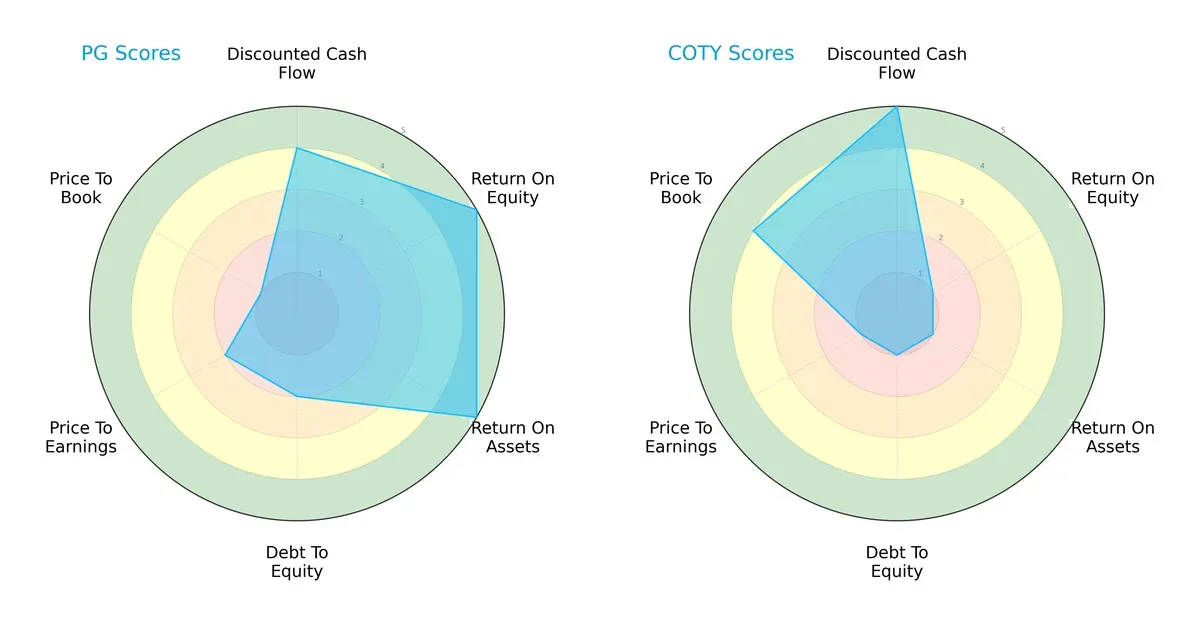
The Procter & Gamble Company shows a balanced profile with strong ROE (5) and ROA (5) scores, reflecting efficient profit generation and asset use. Coty Inc. excels in discounted cash flow (5) and price-to-book (4), suggesting potential undervaluation but suffers from very weak profitability metrics (ROE and ROA at 1) and high financial risk (debt-to-equity at 1). P&G’s moderate debt-to-equity (2) and valuation scores (PE 2, PB 1) contrast with Coty’s reliance on valuation edges rather than operational strength.
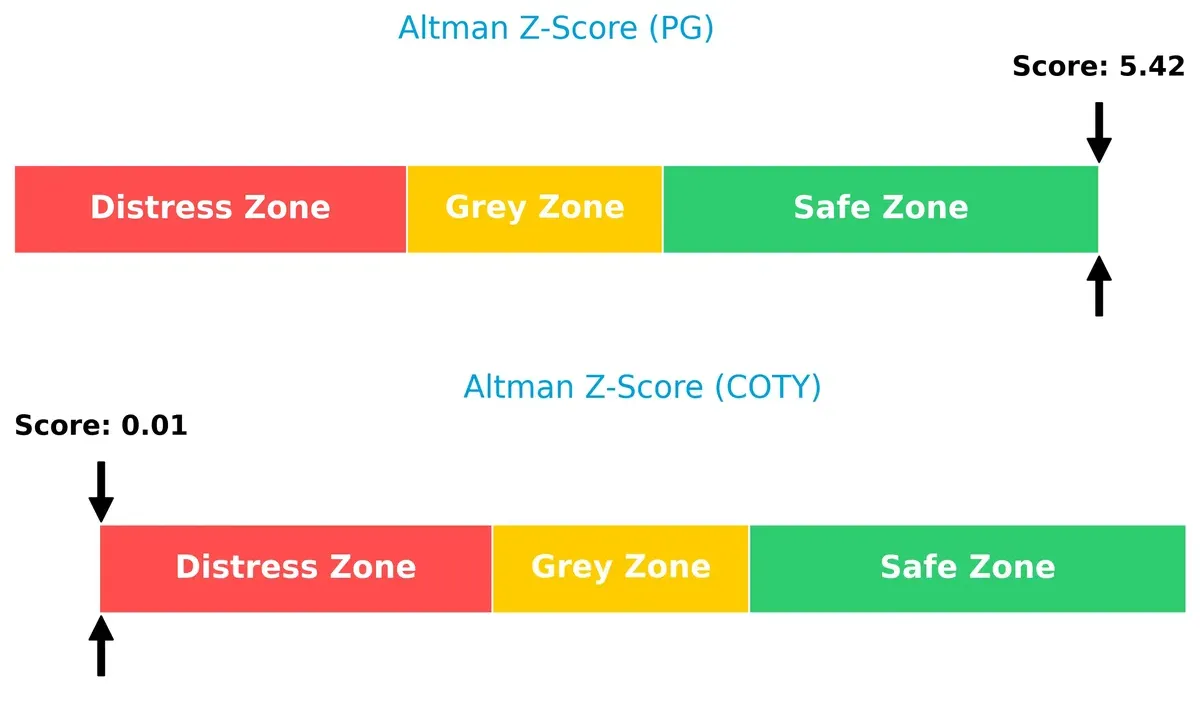
Bankruptcy Risk: Solvency Showdown
The Procter & Gamble Company’s Altman Z-Score of 5.42 places it securely in the safe zone, signaling low bankruptcy risk. Coty Inc.’s score near zero signals distress and heightened default risk in this cycle:
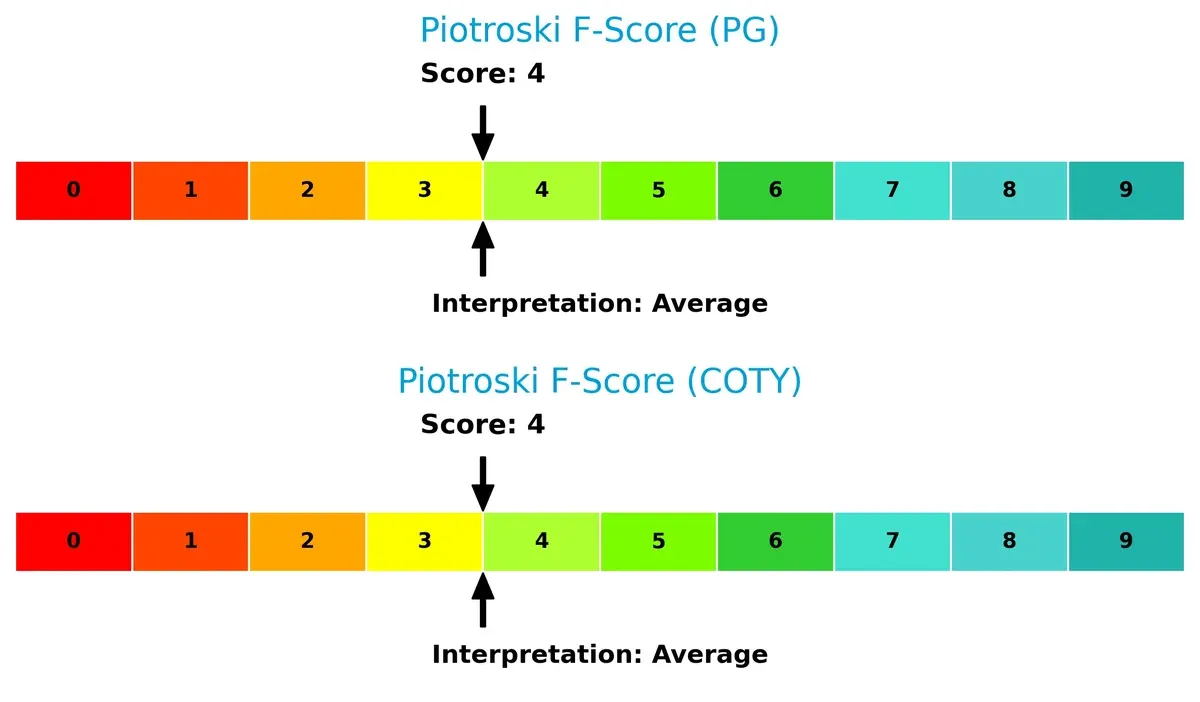
Financial Health: Quality of Operations
Both firms share a Piotroski F-Score of 4, indicating average financial health. Neither exhibits peak operational strength, but no immediate red flags differentiate their internal metrics:
How are the two companies positioned?
This section dissects the operational DNA of PG and COTY by comparing their revenue distribution and internal dynamics. The goal is to confront their economic moats to identify the most resilient, sustainable competitive advantage.
Revenue Segmentation: The Strategic Mix
This visual comparison dissects how The Procter & Gamble Company and Coty Inc. diversify their income streams and where their primary sector bets lie:
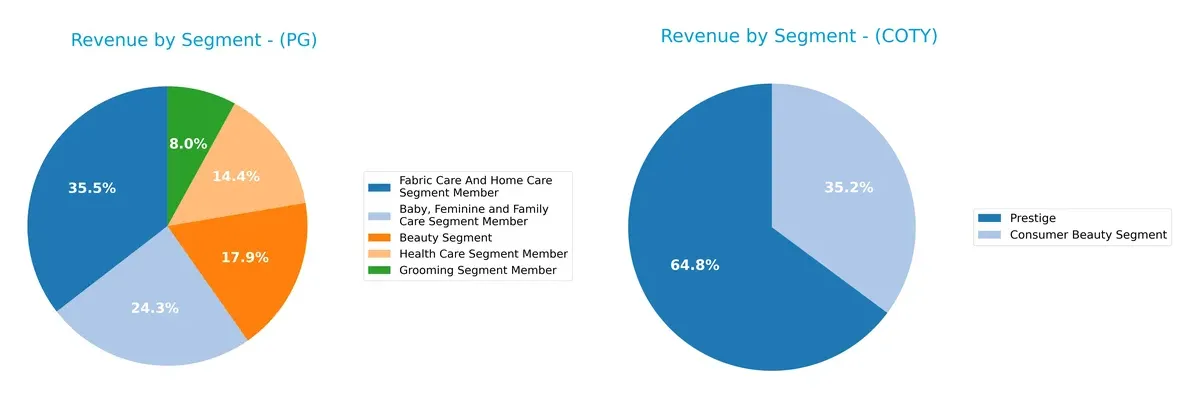
Procter & Gamble anchors its revenue with a broad mix across Fabric Care & Home Care ($29.6B), Baby & Family Care ($20.2B), and Beauty ($15.0B). This diversification reduces concentration risk and leverages ecosystem lock-in via essential household products. Coty, by contrast, pivots heavily on Prestige ($3.8B) and Consumer Beauty ($2.1B), showing narrower focus and higher dependency on beauty trends. P&G’s strategy reflects infrastructure dominance; Coty faces more volatility from consumer preferences.
Strengths and Weaknesses Comparison
This table compares the strengths and weaknesses of The Procter & Gamble Company (PG) and Coty Inc. (COTY):
PG Strengths
- Diverse product segments including Baby, Beauty, Fabric Care, Grooming, and Health Care
- Strong global presence with nearly equal US and Non-US revenues
- High net margin (18.95%) and ROE (30.71%) indicating profitability
- Favorable ROIC (16.47%) well above WACC (5.4%)
- High interest coverage (23.23) and dividend yield (2.52%)
COTY Strengths
- Presence in Consumer Beauty and Prestige segments
- Favorable price-to-book ratio (1.1) and PE despite negative earnings
- Favorable WACC (5.61%) supports capital efficiency
- High fixed asset turnover (6.04) signals asset use efficiency
PG Weaknesses
- Low current (0.7) and quick ratios (0.49) indicate liquidity risks
- Unfavorable price-to-book ratio (7.52) may reflect overvaluation
- Moderate debt-to-equity (0.68) is neutral but worth monitoring
- Neutral asset turnover (0.67) limits operational efficiency gains
COTY Weaknesses
- Negative net margin (-6.24%) and ROE (-9.98%) show profitability challenges
- High debt-to-equity (1.15) and debt-to-assets (35.65%) elevate financial risk
- Low current (0.77) and quick ratios (0.46) raise liquidity concerns
- Low dividend yield (0.33%) and interest coverage (2.33) reduce investor appeal
- Lower asset turnover (0.49) suggests underutilized assets
PG’s diversified portfolio and strong profitability underpin market resilience. COTY faces significant profitability and liquidity challenges that constrain strategic flexibility.
The Moat Duel: Analyzing Competitive Defensibility
A structural moat is the only reliable shield preserving long-term profits from relentless competitive erosion:
The Procter & Gamble Company: Brand Power and Scale Moat
P&G’s moat stems from powerful brand portfolios and global scale, delivering a 25% EBIT margin and 11% ROIC above WACC. Its diverse segments and stable margins signal durable pricing power in 2026.
Coty Inc.: Emerging Turnaround with Niche Brand Moat
Coty relies on premium fragrance brands but suffers negative net margins and value destruction despite improving ROIC trends. Its narrower moat contrasts sharply with P&G’s broad brand dominance and scale.
Wide Moat Scale vs. Niche Brand Revival
P&G possesses a wider, more durable moat, proven by consistent value creation and margin resilience. Coty’s improving profitability is encouraging but insufficient to defend share against P&G’s entrenched competitive advantages.
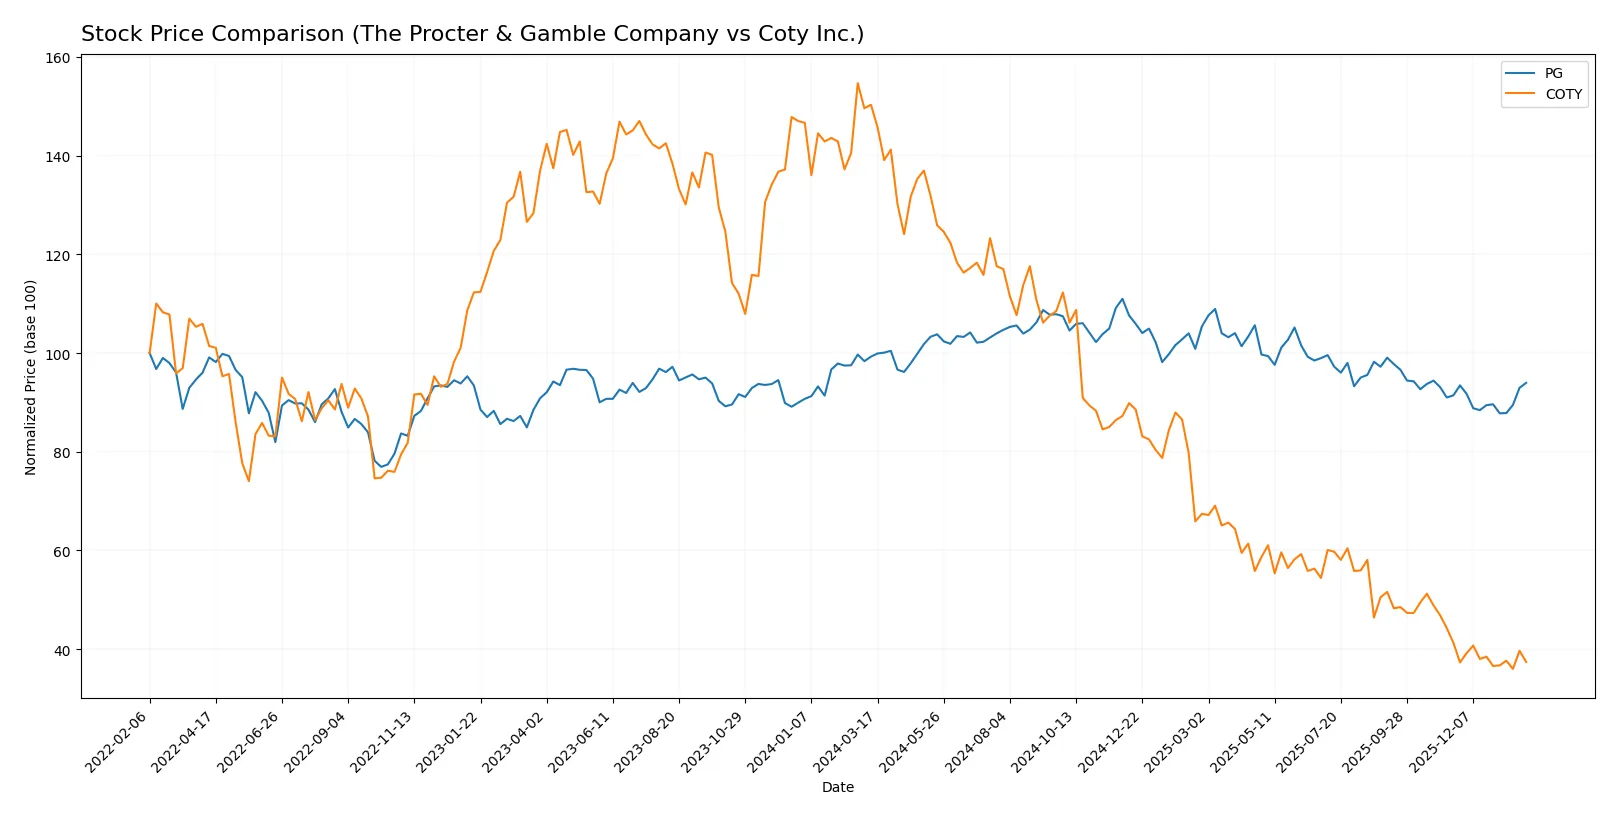
Which stock offers better returns?
The past year shows contrasting price dynamics: Procter & Gamble’s stock declined overall but gained recently, while Coty’s stock plunged sharply with accelerating losses.
Trend Comparison
The Procter & Gamble Company’s stock fell 5.35% over the past 12 months, marking a bearish trend with accelerating decline and notable volatility (8.85 std dev). It rebounded recently by 2.78%, showing a slight bullish tilt.
Coty Inc.’s stock dropped 75.1% over the same period, a strongly bearish trend with accelerating losses and lower volatility (2.74 std dev). Recent months worsened with a 9.43% decline and a negative trend slope.
Procter & Gamble’s stock outperformed Coty’s, delivering much higher market resilience and a smaller overall loss. Coty suffered a severe value erosion, signaling weaker market performance.
Target Prices
Analysts present a mixed but clear set of target prices for these consumer goods companies.
| Company | Target Low | Target High | Consensus |
|---|---|---|---|
| The Procter & Gamble Company | 150 | 179 | 165.67 |
| Coty Inc. | 3 | 10 | 4.83 |
Procter & Gamble’s consensus target price at 165.67 implies a modest upside from the current 151.77, reflecting steady confidence. Coty’s wider range and lower consensus near 4.83 suggest uncertainty and potential volatility against its 3.17 stock price.

Don’t Let Luck Decide Your Entry Point
Optimize your entry points with our advanced ProRealTime indicators. You’ll get efficient buy signals with precise price targets for maximum performance. Start outperforming now!
How do institutions grade them?
The Procter & Gamble Company Grades
The following table summarizes recent grades from reliable grading companies for P&G:
| Grading Company | Action | New Grade | Date |
|---|---|---|---|
| TD Cowen | Downgrade | Hold | 2026-01-27 |
| UBS | Maintain | Buy | 2026-01-23 |
| JP Morgan | Upgrade | Overweight | 2026-01-23 |
| Wells Fargo | Maintain | Overweight | 2026-01-23 |
| UBS | Maintain | Buy | 2026-01-14 |
| TD Cowen | Maintain | Buy | 2026-01-08 |
| Wells Fargo | Maintain | Overweight | 2026-01-05 |
| JP Morgan | Maintain | Neutral | 2025-12-18 |
| Jefferies | Upgrade | Buy | 2025-12-17 |
| JP Morgan | Maintain | Neutral | 2025-10-27 |
Coty Inc. Grades
Below is the summary of recent grades from verified grading companies for Coty Inc.:
| Grading Company | Action | New Grade | Date |
|---|---|---|---|
| TD Cowen | Maintain | Hold | 2026-01-21 |
| Evercore ISI Group | Downgrade | In Line | 2025-12-23 |
| Citigroup | Maintain | Neutral | 2025-12-17 |
| TD Cowen | Maintain | Hold | 2025-12-12 |
| Berenberg | Downgrade | Hold | 2025-09-10 |
| Morgan Stanley | Maintain | Equal Weight | 2025-08-25 |
| RBC Capital | Maintain | Outperform | 2025-08-22 |
| Wells Fargo | Maintain | Equal Weight | 2025-08-22 |
| Barclays | Maintain | Underweight | 2025-08-22 |
| B of A Securities | Maintain | Underperform | 2025-08-22 |
Which company has the best grades?
The Procter & Gamble Company consistently receives stronger grades, including multiple Buy and Overweight ratings. Coty Inc. shows a mix of Hold and Neutral grades, with some downgrades. Investors may view P&G as more favorably positioned based on these institutional assessments.
Risks specific to each company
The following categories identify the critical pressure points and systemic threats facing both firms in the 2026 market environment:
1. Market & Competition
The Procter & Gamble Company
- Dominates consumer packaged goods with strong brands and scale in diversified segments.
Coty Inc.
- Faces intense competition in beauty and cosmetics with lower market capitalization and weaker margins.
2. Capital Structure & Debt
The Procter & Gamble Company
- Moderate debt-to-equity at 0.68; strong interest coverage (23.23) supports financial stability.
Coty Inc.
- Higher leverage with debt-to-equity at 1.15 and weaker interest coverage (2.33) raises financial risk.
3. Stock Volatility
The Procter & Gamble Company
- Low beta (0.388) indicates lower volatility and defensive qualities.
Coty Inc.
- Near-market beta (0.958) suggests higher stock price volatility and sensitivity to market swings.
4. Regulatory & Legal
The Procter & Gamble Company
- Large multinational with complex regulatory exposure but strong compliance infrastructure.
Coty Inc.
- Mid-size player vulnerable to regulatory shifts in beauty and cosmetic product standards.
5. Supply Chain & Operations
The Procter & Gamble Company
- Extensive global supply chain with strong asset turnover and operational scale.
Coty Inc.
- Operational challenges reflected in lower asset turnover (0.49) and higher supply chain risk.
6. ESG & Climate Transition
The Procter & Gamble Company
- Increasing ESG initiatives supported by strong capital allocation and brand reputation.
Coty Inc.
- ESG risks higher with less capital flexibility and ongoing brand repositioning.
7. Geopolitical Exposure
The Procter & Gamble Company
- Diversified global footprint mitigates geopolitical risks.
Coty Inc.
- Significant reliance on international markets increases vulnerability to geopolitical tensions.
Which company shows a better risk-adjusted profile?
P&G’s most impactful risk is its unfavorable liquidity ratios, signaling potential short-term cash flow constraints despite overall financial strength. Coty struggles mainly with high leverage and poor profitability, placing it in financial distress per its Altman Z-score. P&G’s low beta and strong interest coverage give it a superior risk-adjusted profile. Coty’s distress zone Altman Z-score and negative margins highlight urgent solvency concerns, underscoring its vulnerability amid competitive and operational pressures.
Final Verdict: Which stock to choose?
The Procter & Gamble Company (PG) shines with its durable competitive advantage and consistent value creation, driven by a very favorable moat and strong profitability. Its main point of vigilance is a low current ratio, signaling liquidity risks in turbulent markets. PG suits portfolios aiming for steady, reliable growth with moderate risk tolerance.
Coty Inc. (COTY) leverages a strategic niche in the beauty sector with a turnaround potential reflected in its improving ROIC trend. However, it carries a heavier debt load and weaker income quality, making it less stable than PG. Coty might appeal to investors with a higher risk appetite seeking value recovery plays or speculative growth.
If you prioritize resilient cash generation and a proven economic moat, PG is the compelling choice due to its superior return on invested capital and financial stability. However, if you seek a higher-risk, turnaround opportunity with potential upside from operational improvement, Coty offers a scenario worth monitoring despite its current financial challenges.
Disclaimer: Investment carries a risk of loss of initial capital. The past performance is not a reliable indicator of future results. Be sure to understand risks before making an investment decision.
Go Further
I encourage you to read the complete analyses of The Procter & Gamble Company and Coty Inc. to enhance your investment decisions: