The Estée Lauder Companies Inc. (EL) and Coty Inc. (COTY) are two giants in the Household & Personal Products industry, both specializing in beauty and skincare products. While Estée Lauder boasts a diverse portfolio of premium brands and a strong global presence, Coty focuses on a wide range of prestige and mass-market products. This comparison will help you identify which company offers the most compelling investment opportunity in 2026.

Table of contents
Companies Overview
I will begin the comparison between The Estée Lauder Companies Inc. and Coty Inc. by providing an overview of these two companies and their main differences.
The Estée Lauder Companies Inc. Overview
The Estée Lauder Companies Inc. is a leading global manufacturer and marketer of skin care, makeup, fragrance, and hair care products. Headquartered in New York City, the company operates through a diverse portfolio of over 30 brands, including Estée Lauder, Clinique, and MAC. It distributes products worldwide via department stores, specialty retailers, freestanding stores, and online channels, positioning itself strongly in the premium beauty market.
Coty Inc. Overview
Coty Inc. is a global beauty company engaged in manufacturing, marketing, and distributing prestige and mass-market fragrances, skin care, and color cosmetics. Based in New York City, Coty offers products under numerous well-known brands such as Calvin Klein, Gucci, and CoverGirl. It serves approximately 150 countries through multiple retail channels, including perfumeries, department stores, and e-commerce, with a focus on both prestige and mass-market segments.
Key similarities and differences
Both companies operate in the household and personal products industry, focusing on beauty and fragrance worldwide with a strong presence in department and specialty stores. Estée Lauder emphasizes a broad premium brand portfolio and high-end market positioning, while Coty balances prestige and mass-market brands, targeting a wider consumer base. Coty’s distribution spans more countries, but Estée Lauder’s market cap and brand diversity are significantly larger.
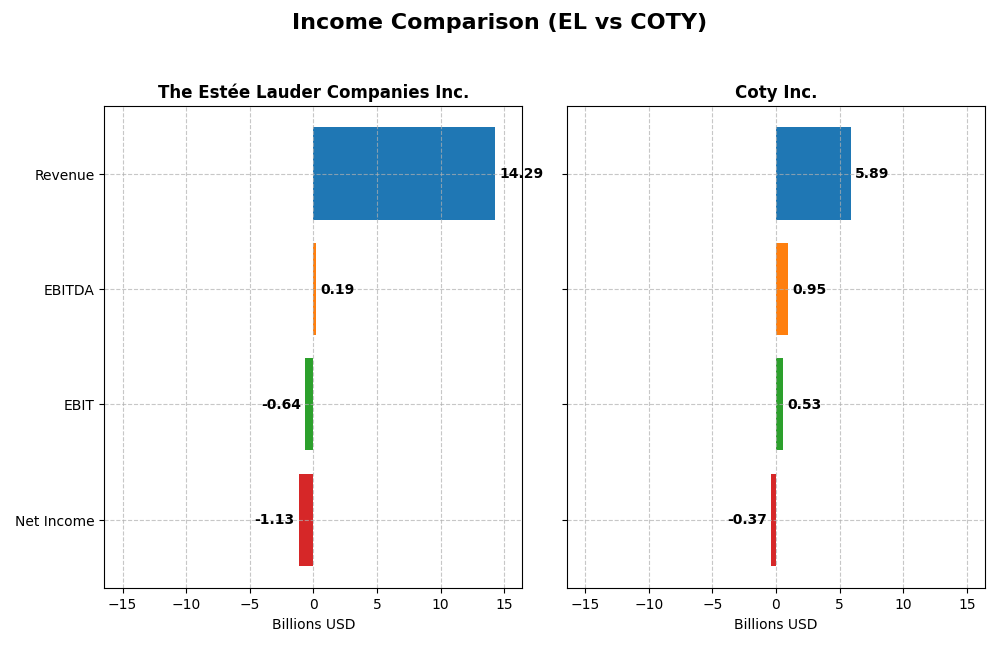
Income Statement Comparison
The table below compares key income statement metrics for The Estée Lauder Companies Inc. and Coty Inc. for the fiscal year 2025.
| Metric | The Estée Lauder Companies Inc. (EL) | Coty Inc. (COTY) |
|---|---|---|
| Market Cap | 40.7B | 2.79B |
| Revenue | 14.29B | 5.89B |
| EBITDA | 193M | 950M |
| EBIT | -636M | 530M |
| Net Income | -1.13B | -368M |
| EPS | -3.15 | -0.44 |
| Fiscal Year | 2025 | 2025 |
Income Statement Interpretations
The Estée Lauder Companies Inc.
The Estée Lauder Companies Inc. experienced a declining trend in revenue from $17.7B in 2022 to $14.3B in 2025, with net income turning negative at -$1.13B in 2025 after positive earnings in previous years. Gross margin remained strong at 73.9%, but EBIT and net margins deteriorated significantly, reflecting a challenging fiscal year with a sharp drop in profitability and earnings per share.
Coty Inc.
Coty Inc.’s revenue grew overall by 27.3% since 2021, reaching $5.9B in 2025, although it declined slightly from 2024 to 2025. Despite a favorable gross margin of 64.8%, the company posted negative net income of -$368M in 2025, following fluctuating profits. EBIT margin was neutral at 9%, but the net margin remained negative, highlighting ongoing profitability pressures amid modest revenue growth.
Which one has the stronger fundamentals?
Both companies exhibit unfavorable income statement trends, with Estée Lauder showing a steep decline in net income and margin contraction, while Coty demonstrates some revenue growth but persistent net losses. Estée Lauder’s higher gross margin contrasts with its worsening EBIT and net margins, whereas Coty’s stable EBIT margin is offset by ongoing net losses. Neither company shows a clearly stronger fundamental position based solely on their recent income statements.
Financial Ratios Comparison
This table presents a side-by-side comparison of key financial ratios for The Estée Lauder Companies Inc. (EL) and Coty Inc. (COTY) for the fiscal year 2025, reflecting their latest reported data.
| Ratios | The Estée Lauder Companies Inc. (EL) | Coty Inc. (COTY) |
|---|---|---|
| ROE | -29.3% | -9.98% |
| ROIC | 6.44% | 2.55% |
| P/E | -25.7 | -11.0 |
| P/B | 7.53 | 1.10 |
| Current Ratio | 1.30 | 0.77 |
| Quick Ratio | 0.92 | 0.46 |
| D/E (Debt to Equity) | 2.44 | 1.15 |
| Debt-to-Assets | 47.5% | 35.7% |
| Interest Coverage | 2.37 | 1.06 |
| Asset Turnover | 0.72 | 0.49 |
| Fixed Asset Turnover | 2.79 | 6.04 |
| Payout ratio | -54.5% | -3.6% |
| Dividend yield | 2.12% | 0.33% |
Interpretation of the Ratios
The Estée Lauder Companies Inc.
The Estée Lauder shows a mixed ratio profile with several unfavorable indicators such as a negative net margin (-7.93%) and a poor return on equity (-29.31%), suggesting profitability and efficiency challenges. Neutral ratios like a current ratio of 1.3 imply moderate liquidity. The company pays dividends with a favorable yield of 2.12%, but caution is warranted due to its negative earnings and high payout risks.
Coty Inc.
Coty’s ratios reveal significant weaknesses, including negative net margin (-6.24%) and return on equity (-9.98%), alongside a low current ratio (0.77), indicating liquidity concerns. Despite some favorable metrics such as a low price-to-book ratio (1.1) and a strong fixed asset turnover (6.04), Coty does not pay dividends, likely reflecting a reinvestment strategy amid ongoing financial strain.
Which one has the best ratios?
Comparing both, The Estée Lauder’s ratios are slightly unfavorable but generally stronger, with better liquidity and dividend yield, while Coty faces more unfavorable ratios and liquidity issues. The Estée Lauder’s mixed but more balanced metrics contrast with Coty’s predominantly weak financial indicators, making its overall ratio profile comparatively better.
Strategic Positioning
This section compares the strategic positioning of The Estée Lauder Companies Inc. (EL) and Coty Inc. (COTY) regarding their market position, key segments, and exposure to disruption:
The Estée Lauder Companies Inc. (EL)
- Leading global beauty firm with significant market cap of 40.7B; faces competition in premium segments.
- Diversified product portfolio: skin care (6.96B), makeup (4.21B), fragrance (2.49B), hair care (565M).
- Moderate exposure to technological disruption; innovation in skincare and beauty tools development.
Coty Inc. (COTY)
- Smaller firm with 2.8B market cap; competes across prestige and mass-market beauty segments.
- Two main segments: Prestige (3.82B) and Consumer Beauty (2.07B) with a broad brand portfolio.
- Exposure to disruption through digital sales channels and evolving consumer preferences in beauty.
The Estée Lauder Companies Inc. vs Coty Inc. Positioning
EL adopts a diversified approach across multiple beauty product categories, offering scale advantages but facing intense premium competition. COTY focuses on prestige and mass-market segments with fewer categories, balancing brand breadth and targeted market reach.
Which has the best competitive advantage?
Both companies are shedding value with ROIC below WACC; EL shows declining profitability (Very Unfavorable), while COTY has improving ROIC despite value destruction (Slightly Unfavorable), indicating marginally better competitive dynamics for COTY.
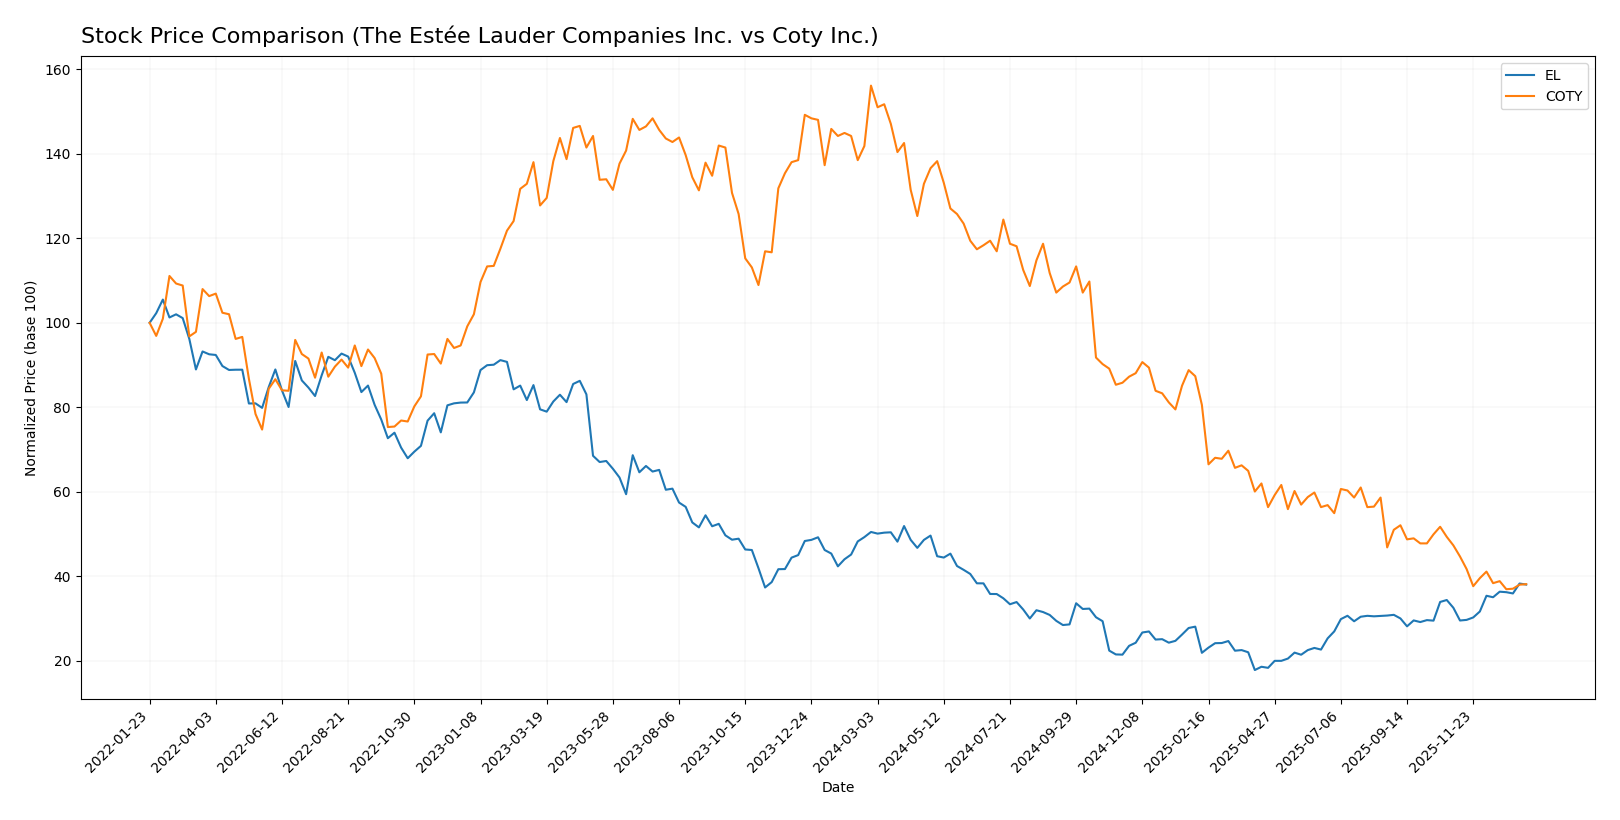
Stock Comparison
The stock price movements over the past year highlight a marked bearish trend for both The Estée Lauder Companies Inc. and Coty Inc., with The Estée Lauder showing signs of recent recovery while Coty continues to decline.
Trend Analysis
The Estée Lauder Companies Inc. experienced a 24.65% price decline over the past 12 months, indicating a bearish trend with accelerating downward momentum. However, the recent 2.5-month period shows a 16.89% price increase, suggesting a short-term recovery.
Coty Inc.’s stock fell by 75.57% over the past year, reflecting a strong bearish trend with accelerating losses. The recent trend further declined by 19.4%, indicating continued negative momentum without signs of reversal.
Comparing both, The Estée Lauder Companies Inc. delivered a higher market performance, with a less severe overall decline and recent positive price movement, unlike Coty Inc.’s persistent and deeper losses.
Target Prices
Analysts present a mixed but insightful consensus on target prices for The Estée Lauder Companies Inc. and Coty Inc.
| Company | Target High | Target Low | Consensus |
|---|---|---|---|
| The Estée Lauder Companies Inc. | 130 | 70 | 106.67 |
| Coty Inc. | 10 | 3.5 | 4.95 |
The Estée Lauder Companies’ consensus target of 106.67 is slightly below the current price of 113.02, suggesting a modest downside risk. Coty Inc.’s consensus target of 4.95 is notably above its current price of 3.2, indicating potential upside according to analysts.
Analyst Opinions Comparison
This section compares analysts’ ratings and grades for The Estée Lauder Companies Inc. (EL) and Coty Inc. (COTY):
Rating Comparison
EL Rating
- Rating: D+, assessed as Very Favorable overall rating.
- Discounted Cash Flow Score: 2, indicating Moderate value.
- ROE Score: 1, indicating Very Unfavorable performance.
- ROA Score: 1, indicating Very Unfavorable efficiency.
- Debt To Equity Score: 1, indicating Very Unfavorable risk.
- Overall Score: 1, indicating Very Unfavorable overall strength.
COTY Rating
- Rating: C+, assessed as Very Favorable overall rating.
- Discounted Cash Flow Score: 5, indicating Very Favorable value.
- ROE Score: 1, indicating Very Unfavorable performance.
- ROA Score: 1, indicating Very Unfavorable efficiency.
- Debt To Equity Score: 1, indicating Very Unfavorable risk.
- Overall Score: 2, indicating Moderate overall strength.
Which one is the best rated?
Based strictly on the provided data, Coty Inc. (COTY) holds a higher overall rating (C+) and better scores in discounted cash flow and overall score compared to The Estée Lauder Companies Inc. (EL), which has lower scores despite a similar risk profile.
Scores Comparison
The financial scores of The Estée Lauder Companies Inc. and Coty Inc. are compared below:
EL Scores
- Altman Z-Score: 3.11, indicating a safe zone, low bankruptcy risk
- Piotroski Score: 5, classified as average financial strength
COTY Scores
- Altman Z-Score: 0.01, indicating distress zone, high risk
- Piotroski Score: 4, also classified as average financial strength
Which company has the best scores?
Based on the provided data, EL has a significantly higher Altman Z-Score, placing it in the safe zone, whereas COTY is in the distress zone. Both have average Piotroski Scores, with EL slightly ahead at 5 versus 4 for COTY.
Grades Comparison
Here is a summary of the recent grades assigned to The Estée Lauder Companies Inc. and Coty Inc.:
The Estée Lauder Companies Inc. Grades
The following table presents recent ratings from reputable grading firms for The Estée Lauder Companies Inc.:
| Grading Company | Action | New Grade | Date |
|---|---|---|---|
| Wells Fargo | Maintain | Equal Weight | 2026-01-05 |
| Raymond James | Upgrade | Strong Buy | 2026-01-05 |
| Citigroup | Maintain | Neutral | 2025-12-17 |
| Evercore ISI Group | Maintain | Outperform | 2025-12-16 |
| Rothschild & Co | Downgrade | Sell | 2025-11-25 |
| Argus Research | Upgrade | Buy | 2025-11-11 |
| JP Morgan | Maintain | Overweight | 2025-10-31 |
| Telsey Advisory Group | Maintain | Market Perform | 2025-10-31 |
| UBS | Maintain | Neutral | 2025-10-31 |
| RBC Capital | Maintain | Outperform | 2025-10-31 |
The grades for The Estée Lauder Companies Inc. show a mixed but generally positive trend, with multiple upgrades and several “Buy” or equivalent ratings alongside some neutral and one downgrade.
Coty Inc. Grades
The following table presents recent ratings from reputable grading firms for Coty Inc.:
| Grading Company | Action | New Grade | Date |
|---|---|---|---|
| Evercore ISI Group | Downgrade | In Line | 2025-12-23 |
| Citigroup | Maintain | Neutral | 2025-12-17 |
| TD Cowen | Maintain | Hold | 2025-12-12 |
| Berenberg | Downgrade | Hold | 2025-09-10 |
| Morgan Stanley | Maintain | Equal Weight | 2025-08-25 |
| RBC Capital | Maintain | Outperform | 2025-08-22 |
| Wells Fargo | Maintain | Equal Weight | 2025-08-22 |
| Goldman Sachs | Maintain | Neutral | 2025-08-22 |
| Barclays | Maintain | Underweight | 2025-08-22 |
| B of A Securities | Maintain | Underperform | 2025-08-22 |
The grades for Coty Inc. indicate a generally cautious to neutral stance, with several “Hold,” “Neutral,” or equivalent ratings and some downgrades, plus a few underweight and underperform opinions.
Which company has the best grades?
Comparing both companies, The Estée Lauder Companies Inc. has received more positive and upgraded ratings, including a recent “Strong Buy” by Raymond James, while Coty Inc.’s ratings trend more toward neutral or cautious stances with downgrades. This disparity may influence investor sentiment and portfolio risk profiles differently.
Strengths and Weaknesses
Below is a comparison of key strengths and weaknesses between The Estée Lauder Companies Inc. (EL) and Coty Inc. (COTY) based on their recent financial and market data.
| Criterion | The Estée Lauder Companies Inc. (EL) | Coty Inc. (COTY) |
|---|---|---|
| Diversification | Highly diversified product portfolio: Skin Care (6.96B), Makeup (4.21B), Fragrance (2.49B), Hair Care (565M) | Moderate diversification across Consumer Beauty (2.07B) and Prestige (3.82B) segments |
| Profitability | Currently shedding value with declining ROIC; net margin -7.93%, ROE -29.31% (unfavorable) | Also shedding value but with improving ROIC; net margin -6.24%, ROE -9.98% (unfavorable) |
| Innovation | Strong brand equity and innovation in premium skincare and makeup | Innovation improving, supported by growing ROIC trend, especially in Prestige segment |
| Global presence | Extensive global footprint with strong market penetration worldwide | Global presence but less dominant; focus on specific beauty segments |
| Market Share | Leading market share in luxury skincare and makeup categories | Solid presence in consumer and prestige beauty but trailing Estée Lauder |
Key takeaways: Estée Lauder shows strong diversification and global reach but faces challenges in profitability and value creation. Coty is less diversified but shows signs of improving profitability with a growing ROIC trend, suggesting potential for future value creation despite current unfavorable margins. Investors should weigh stability against growth potential carefully.
Risk Analysis
Below is a comparative table summarizing key risk factors for The Estée Lauder Companies Inc. (EL) and Coty Inc. (COTY) based on the most recent data from 2025.
| Metric | The Estée Lauder Companies Inc. (EL) | Coty Inc. (COTY) |
|---|---|---|
| Market Risk | Beta 1.15, moderate market volatility exposure | Beta 0.96, slightly lower volatility |
| Debt level | Debt/Equity 2.44 (unfavorable), Interest coverage -1.57 (weak) | Debt/Equity 1.15 (unfavorable), Interest coverage 2.33 (moderate) |
| Regulatory Risk | Moderate, global cosmetics regulations | Moderate, operates in 150 countries with diverse regulations |
| Operational Risk | Neutral asset turnover (0.72), large global supply chain | Unfavorable asset turnover (0.49), complex brand portfolio |
| Environmental Risk | Increasing focus on sustainable products, moderate risk | Moderate risk, sustainability initiatives ongoing but less advanced |
| Geopolitical Risk | Exposure to international markets, supply chain sensitivity | Similar exposure, with reliance on global distributors |
The most impactful and likely risks are the elevated debt levels and weak interest coverage at Estée Lauder, indicating financial strain that could limit flexibility. Coty’s distress-level Altman Z-score signals a higher bankruptcy risk, driven by poor profitability and liquidity ratios. Investors should monitor financial health closely amid regulatory and geopolitical uncertainties.
Which Stock to Choose?
The Estée Lauder Companies Inc. (EL) shows a declining income trend with unfavorable net margin and ROE, neutral ROIC and WACC, and a slightly unfavorable global financial ratios evaluation. Its debt levels are high, reflected in an unfavorable debt-to-equity ratio and negative interest coverage, while its rating stands at a very favorable D+ despite mixed financial scores.
Coty Inc. (COTY) also faces unfavorable income evolution with negative net margin and ROE, and an unfavorable global ratios evaluation despite some favorable scores like WACC and price-to-book. It carries a high debt load with weak liquidity ratios and a moderate rating of C+. The company’s Altman Z-Score indicates financial distress.
Investors focused on growth might find The Estée Lauder Companies’ improving recent price trend and strong rating suggestive, while risk-tolerant investors aware of Coty’s financial distress and mixed signals in profitability and liquidity may view it differently. The overall unfavorable income and ratio profiles suggest caution for both stocks.
Disclaimer: Investment carries a risk of loss of initial capital. The past performance is not a reliable indicator of future results. Be sure to understand risks before making an investment decision.
Go Further
I encourage you to read the complete analyses of The Estée Lauder Companies Inc. and Coty Inc. to enhance your investment decisions: