In the dynamic world of household and personal products, Coty Inc. and Spectrum Brands Holdings, Inc. stand out as influential players with distinct strategies. Coty focuses on prestige beauty and color cosmetics, while Spectrum offers a diverse portfolio spanning home care, pet care, and garden products. Their market overlap and innovation approaches make this comparison particularly compelling. Join me as we analyze which company presents the most attractive opportunity for investors in 2026.
Table of contents
Companies Overview
I will begin the comparison between Coty and Spectrum Brands by providing an overview of these two companies and their main differences.
Coty Overview
Coty Inc. is a global leader in the beauty industry, engaged in the manufacture, marketing, and sale of prestige and mass-market beauty products. Its portfolio includes fragrances, skin care, and color cosmetics under well-known brands such as Calvin Klein, Gucci, and CoverGirl. Founded in 1904 and based in New York City, Coty distributes its products to about 150 countries, serving diverse retail channels from department stores to e-commerce platforms.
Spectrum Brands Overview
Spectrum Brands Holdings, Inc. is a diversified consumer products company operating worldwide through three segments: Home and Personal Care, Global Pet Care, and Home and Garden. Its portfolio features home appliances, pet care products, and pest control solutions under multiple brands including Black & Decker, IAMS, and Spectracide. Incorporated in 2009 and headquartered in Middleton, Wisconsin, Spectrum sells through retailers, e-commerce, wholesalers, and distributors.
Key similarities and differences
Both Coty and Spectrum Brands operate in the consumer defensive sector, focusing on household and personal products with global reach. Coty concentrates on beauty and cosmetics, emphasizing prestige and mass-market fragrances and skincare, while Spectrum Brands has a broader product range including home appliances, pet care, and garden pest control. Coty’s distribution is heavily retail and direct-to-consumer oriented, whereas Spectrum leverages a multi-segment approach serving diverse consumer needs beyond personal care.
Income Statement Comparison
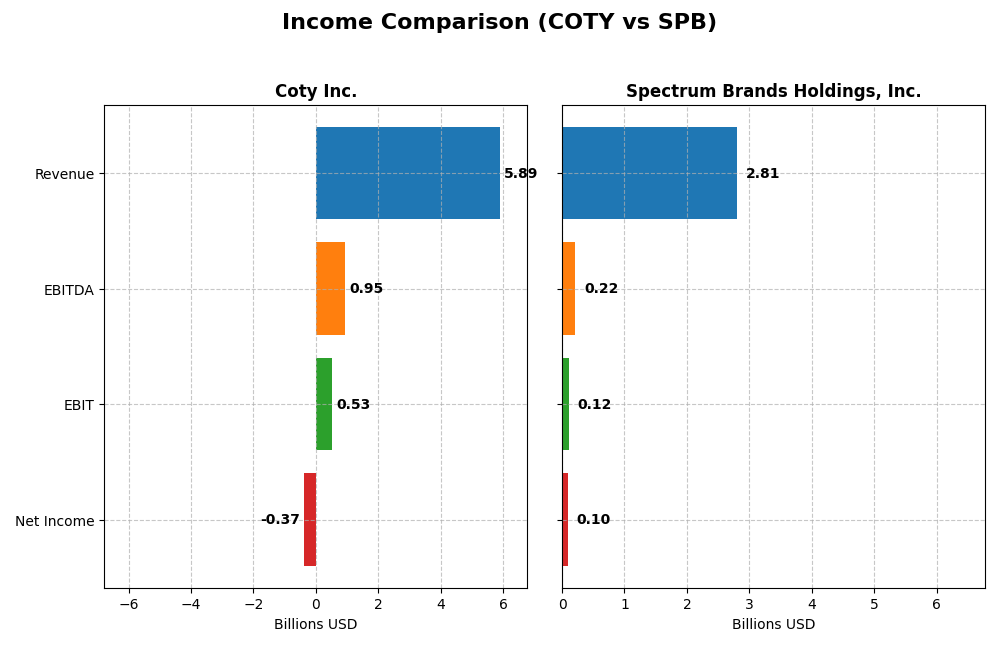
The table below presents a side-by-side comparison of key income statement metrics for Coty Inc. and Spectrum Brands Holdings, Inc. for their most recent fiscal years.
| Metric | Coty Inc. (COTY) | Spectrum Brands Holdings, Inc. (SPB) |
|---|---|---|
| Market Cap | 2.79B | 1.53B |
| Revenue | 5.89B | 2.81B |
| EBITDA | 950M | 215M |
| EBIT | 530M | 117M |
| Net Income | -368M | 99.9M |
| EPS | -0.44 | 3.88 |
| Fiscal Year | 2025 | 2025 |
Income Statement Interpretations
Coty Inc.
Coty exhibited overall revenue growth of 27.3% from 2021 to 2025 but faced significant net income decline of 82.8% in the same period. Gross margins remained favorable at 64.8%, while EBIT margins held steady at about 9%. The latest fiscal year saw revenue fall 3.7% with net income turning negative, reflecting margin compression and deteriorating profitability.
Spectrum Brands Holdings, Inc.
Spectrum Brands experienced a 6.3% revenue decline over 2021-2025 alongside a 47.3% drop in net income. Gross margin was favorable at 36.7%, with EBIT margin neutral near 4.2%, and net margin slightly positive at 3.6%. The most recent year marked a 5.2% revenue decrease and a 15.5% net margin contraction, signaling ongoing challenges in profitability.
Which one has the stronger fundamentals?
Both companies show unfavorable overall income statement trends, with declining revenues and profits. Coty’s higher gross margin contrasts with its negative net margin, while Spectrum Brands maintains a positive net margin but with weaker growth. Each faces significant margin pressure and income contraction, offering no clear advantage in fundamental strength based solely on these income statement metrics.
Financial Ratios Comparison
The table below presents key financial ratios for Coty Inc. and Spectrum Brands Holdings, Inc. based on their most recent fiscal year data, allowing a straightforward comparison of their financial health and performance.
| Ratios | Coty Inc. (2025 FY) | Spectrum Brands (2025 FY) |
|---|---|---|
| ROE | -9.98% | 5.23% |
| ROIC | 2.55% | 4.95% |
| P/E | -11.02 | 13.51 |
| P/B | 1.10 | 0.71 |
| Current Ratio | 0.77 | 2.26 |
| Quick Ratio | 0.46 | 1.41 |
| D/E (Debt to Equity) | 1.15 | 0.34 |
| Debt-to-Assets | 35.7% | 19.4% |
| Interest Coverage | 1.06 | 4.16 |
| Asset Turnover | 0.49 | 0.83 |
| Fixed Asset Turnover | 6.04 | 8.55 |
| Payout Ratio | -3.62% | 48.2% |
| Dividend Yield | 0.33% | 3.57% |
Interpretation of the Ratios
Coty Inc.
Coty Inc. exhibits several unfavorable financial ratios, including a negative net margin of -6.24% and a return on equity of -9.98%, signaling profitability and efficiency challenges. Its current and quick ratios below 1 indicate liquidity concerns, while a debt-to-equity ratio of 1.15 suggests relatively high leverage. The company does not pay dividends, reflecting its reinvestment focus amid ongoing financial restructuring.
Spectrum Brands Holdings, Inc.
Spectrum Brands shows a mixed profile with some unfavorable profitability ratios like a 3.56% net margin and 5.23% ROE, yet it maintains strong liquidity ratios: a current ratio of 2.26 and a quick ratio of 1.41. Its low debt-to-equity of 0.34 supports financial stability. The company pays dividends, yielding 3.57%, suggesting a shareholder return focus supported by manageable payout levels.
Which one has the best ratios?
Spectrum Brands holds a more favorable ratio profile overall, with 64.29% favorable ratios compared to Coty’s 28.57%. Its superior liquidity, lower leverage, and dividend yield contrast with Coty’s numerous unfavorable profitability and liquidity metrics, indicating a stronger financial position for Spectrum Brands in this comparison.
Strategic Positioning
This section compares the strategic positioning of Coty Inc. and Spectrum Brands Holdings, Inc., including market position, key segments, and exposure to technological disruption:
COTY
- Mid-sized market cap of 2.79B with competitive pressure in global beauty products industry.
- Focuses on prestige and consumer beauty segments, driven by fragrances, skin care, and cosmetics.
- Exposure to digital retail disruption through e-commerce, selling via prestige and mass channels.
SPB
- Smaller market cap of 1.53B facing competitive pressure in branded consumer products worldwide.
- Operates three segments: Home & Personal Care, Global Pet Care, and Home & Garden with diverse drivers.
- Technology disruption risk moderate, with home appliances and pet care segments adapting gradually.
COTY vs SPB Positioning
Coty concentrates on beauty and prestige products globally, leveraging a broader brand portfolio, while Spectrum Brands diversifies across home care, pet care, and garden segments. Coty’s scale in beauty contrasts with SPB’s wider but smaller segments, each with distinct competitive dynamics.
Which has the best competitive advantage?
Both companies have slightly unfavorable MOAT evaluations, indicating value destruction despite improving profitability. Coty’s larger scale in beauty offers brand strength, whereas SPB’s diversified segments provide resilience but neither shows a clear sustainable competitive advantage.
Stock Comparison
The stock prices of Coty Inc. and Spectrum Brands Holdings, Inc. have shown marked declines over the past year, with Coty experiencing a steeper drop, while Spectrum Brands exhibited signs of recent recovery amid volatile trading conditions.

Trend Analysis
Coty Inc.’s stock price declined by 75.57% over the past 12 months, indicating a bearish trend with acceleration. The stock reached a high of 13.1 and a low of 3.1, with moderate volatility at 2.82 standard deviation.
Spectrum Brands Holdings, Inc. saw a 20.57% decrease over the same period, also bearish with accelerating decline. Its price ranged from 50.35 to 94.88, showing higher volatility at 15.02 standard deviation but recent positive momentum.
Comparing both, Coty delivered the weakest market performance with a substantially larger decline, whereas Spectrum Brands, despite an overall drop, showed recent upward price movement, indicating relative strength.
Target Prices
Analysts provide a clear consensus on target prices for Coty Inc. and Spectrum Brands Holdings, Inc.
| Company | Target High | Target Low | Consensus |
|---|---|---|---|
| Coty Inc. | 10 | 3.5 | 4.95 |
| Spectrum Brands Holdings, Inc. | 75 | 75 | 75 |
The consensus target for Coty Inc. at $4.95 suggests moderate upside from its current price of $3.2, while Spectrum Brands’ fixed target of $75 indicates a significant potential increase from its current price near $63.2.
Analyst Opinions Comparison
This section compares analysts’ ratings and grades for Coty Inc. and Spectrum Brands Holdings, Inc.:
Rating Comparison
COTY Rating
- Rating: C+ with a very favorable overall rating status.
- Discounted Cash Flow Score: 5, indicating a very favorable valuation based on future cash flow.
- ROE Score: 1, showing very unfavorable profit generation from shareholders’ equity.
- ROA Score: 1, indicating very unfavorable asset utilization.
- Debt To Equity Score: 1, reflecting very unfavorable financial risk with high leverage.
- Overall Score: 2, rated as moderate overall financial standing.
SPB Rating
- Rating: B with a very favorable overall rating status.
- Discounted Cash Flow Score: 1, indicating a very unfavorable valuation based on future cash flow.
- ROE Score: 2, showing moderate efficiency in generating profit from equity.
- ROA Score: 3, indicating moderate effectiveness in utilizing assets to generate earnings.
- Debt To Equity Score: 3, reflecting moderate financial risk with reasonable leverage.
- Overall Score: 3, rated as moderate overall financial standing.
Which one is the best rated?
Based solely on the provided data, SPB holds a better overall rating (B) compared to COTY’s C+. SPB scores moderately across most metrics, while COTY shows extremes with a very favorable DCF score but very unfavorable scores for ROE, ROA, and debt-to-equity.
Scores Comparison
The comparison of scores between Coty Inc. and Spectrum Brands Holdings, Inc. is as follows:
COTY Scores
- Altman Z-Score: 0.01, indicating distress zone risk.
- Piotroski Score: 4, reflecting average financial strength.
SPB Scores
- Altman Z-Score: 1.77, also in distress zone but closer to grey zone.
- Piotroski Score: 6, showing average but stronger financial health than COTY.
Which company has the best scores?
Spectrum Brands Holdings, Inc. has higher Altman Z and Piotroski Scores than Coty Inc., suggesting relatively better financial stability and strength based on the provided data. Both remain in the distress zone for bankruptcy risk.
Grades Comparison
Here is the grades comparison of Coty Inc. and Spectrum Brands Holdings, Inc.:
Coty Inc. Grades
The table below shows recent analyst grades and actions for Coty Inc.
| Grading Company | Action | New Grade | Date |
|---|---|---|---|
| Evercore ISI Group | Downgrade | In Line | 2025-12-23 |
| Citigroup | Maintain | Neutral | 2025-12-17 |
| TD Cowen | Maintain | Hold | 2025-12-12 |
| Berenberg | Downgrade | Hold | 2025-09-10 |
| Morgan Stanley | Maintain | Equal Weight | 2025-08-25 |
| RBC Capital | Maintain | Outperform | 2025-08-22 |
| Wells Fargo | Maintain | Equal Weight | 2025-08-22 |
| Goldman Sachs | Maintain | Neutral | 2025-08-22 |
| Barclays | Maintain | Underweight | 2025-08-22 |
| B of A Securities | Maintain | Underperform | 2025-08-22 |
Overall, Coty Inc.’s grades predominantly trend around Hold and Neutral ratings, with some downgrades and a few Outperform ratings.
Spectrum Brands Holdings, Inc. Grades
The table below shows recent analyst grades and actions for Spectrum Brands Holdings, Inc.
| Grading Company | Action | New Grade | Date |
|---|---|---|---|
| Canaccord Genuity | Maintain | Buy | 2025-11-17 |
| Wells Fargo | Maintain | Equal Weight | 2025-11-14 |
| Wells Fargo | Maintain | Equal Weight | 2025-09-25 |
| Canaccord Genuity | Maintain | Buy | 2025-08-08 |
| Wells Fargo | Maintain | Equal Weight | 2025-07-09 |
| Canaccord Genuity | Maintain | Buy | 2025-06-25 |
| UBS | Maintain | Buy | 2025-05-09 |
| UBS | Maintain | Buy | 2025-04-17 |
| Wells Fargo | Maintain | Equal Weight | 2025-04-16 |
| Wells Fargo | Maintain | Equal Weight | 2025-04-02 |
Spectrum Brands shows a consistent pattern of Buy and Equal Weight ratings, with no downgrades.
Which company has the best grades?
Spectrum Brands Holdings, Inc. has received stronger and more consistent Buy ratings compared to Coty Inc., whose grades cluster around Hold and Neutral with several downgrades. This difference may influence investors seeking higher conviction in analyst sentiment.
Strengths and Weaknesses
Here is a comparative overview of key strengths and weaknesses for Coty Inc. (COTY) and Spectrum Brands Holdings, Inc. (SPB) based on recent financial and market data:
| Criterion | Coty Inc. (COTY) | Spectrum Brands (SPB) |
|---|---|---|
| Diversification | Focused on Consumer Beauty and Prestige segments; limited recent diversification with declining Consumer Beauty revenue (2.07B in 2025) vs. 3.82B Prestige | Diversified across Global Pet Supplies (1.08B), Home & Personal Care (1.15B), and Home & Garden (0.57B), showing balanced segment revenue |
| Profitability | Negative net margin (-6.24%) and ROE (-9.98%); ROIC slightly positive at 2.55%, but below WACC; overall value destroying | Positive net margin (3.56%) and ROE (5.23%), ROIC at 4.95% but slightly below WACC; better profitability profile but still shedding value |
| Innovation | Limited innovation evidence; ROIC trend growing indicating some operational improvement | Moderate innovation capacity with steady ROIC growth and solid asset turnover (0.83) |
| Global presence | Strong global brand recognition in beauty, but weaker financials challenge global competitiveness | Strong presence in multiple consumer product segments globally, supported by solid liquidity and lower debt levels |
| Market Share | Leading in prestige beauty but declining Consumer Beauty market share | Strong in pet supplies and home care markets with consistent revenue growth |
Key takeaways: Both companies show increasing profitability trends but continue to shed value as ROIC remains below WACC. Spectrum Brands exhibits stronger diversification, financial health, and overall favorable ratios, making it more resilient compared to Coty, which struggles with profitability and liquidity.
Risk Analysis
Below is a comparative table of key risks for Coty Inc. (COTY) and Spectrum Brands Holdings, Inc. (SPB) based on the most recent 2025 data:
| Metric | Coty Inc. (COTY) | Spectrum Brands (SPB) |
|---|---|---|
| Market Risk | Beta 0.96 (moderate) | Beta 0.68 (lower volatility) |
| Debt level | D/E 1.15 (high, unfavorable) | D/E 0.34 (low, favorable) |
| Regulatory Risk | Moderate, global operations | Moderate, diverse segments |
| Operational Risk | Supply chain, brand portfolio | Diversified product lines |
| Environmental Risk | Moderate, consumer products | Moderate, chemical use in pest control |
| Geopolitical Risk | Exposure to 150 countries | Global but less extensive reach |
In synthesis, Coty faces higher financial risk due to elevated debt and weak profitability, reflected in unfavorable ratios and a distress Altman Z-Score. Spectrum Brands shows better financial stability and lower leverage, though both companies operate in regulated consumer sectors with moderate operational and environmental risks. Investors should weigh Coty’s higher market risk and financial distress against Spectrum’s steadier profile.
Which Stock to Choose?
Coty Inc. has experienced a 27.3% revenue growth over 2021-2025 but shows unfavorable profitability with a -6.24% net margin and negative returns on equity and assets. Its debt level and liquidity ratios are weak, reflected in an overall unfavorable financial ratios evaluation, yet it holds a very favorable rating of C+.
Spectrum Brands Holdings, Inc. presents a declining revenue trend of -6.31% over the period with modest profitability at a 3.56% net margin. Its financial ratios are mostly favorable, including strong liquidity and low debt, supported by a very favorable rating of B, despite some recent earnings pressure.
For risk-averse investors prioritizing financial stability and favorable ratio profiles, Spectrum Brands might appear more attractive due to its stronger balance sheet and higher rating. Conversely, those focusing on growth potential could find Coty’s improving ROIC trend and higher revenue growth more compelling, despite weaker current profitability and financial metrics.
Disclaimer: Investment carries a risk of loss of initial capital. The past performance is not a reliable indicator of future results. Be sure to understand risks before making an investment decision.
Go Further
I encourage you to read the complete analyses of Coty Inc. and Spectrum Brands Holdings, Inc. to enhance your investment decisions: