Investors seeking opportunities in the household and personal products sector will find Coty Inc. and Nu Skin Enterprises, Inc. compelling contenders. Both companies operate globally in beauty and wellness, yet they differ in market approach and innovation strategies—Coty focuses on prestige and mass-market brands, while Nu Skin emphasizes advanced skin care and nutritional supplements. In this article, I will analyze their strengths to help you decide which company holds the greatest potential for your investment portfolio.
Table of contents
Companies Overview
I will begin the comparison between Coty and Nu Skin by providing an overview of these two companies and their main differences.
Coty Overview
Coty Inc. operates in the Household & Personal Products industry, focusing on the manufacture, marketing, distribution, and sale of beauty products worldwide. It offers a broad portfolio including prestige fragrances, skin care, and color cosmetics under premium brands like Calvin Klein and Gucci. Coty sells through various retail channels and third-party distributors to approximately 150 countries, positioning itself as a global leader in beauty products.
Nu Skin Overview
Nu Skin Enterprises, Inc. develops and distributes beauty and wellness products, concentrating on skin care systems, nutritional supplements, and personal care under brands such as Nu Skin and ageLOC. The company promotes its products through direct sales, distributors, and retail stores, with a presence in Mainland China. Nu Skin emphasizes research and product development in both skin care and nutritional supplements, operating primarily in the consumer defensive sector.
Key similarities and differences
Both Coty and Nu Skin operate within the Household & Personal Products industry, focusing on beauty and personal care. Coty leans more heavily on a wide range of prestige and mass-market beauty brands sold globally through retailers and distributors. In contrast, Nu Skin emphasizes direct selling and distributor networks, with a stronger focus on wellness supplements alongside skin care. Their market caps and employee counts also differ significantly, with Coty being the larger company.
Income Statement Comparison
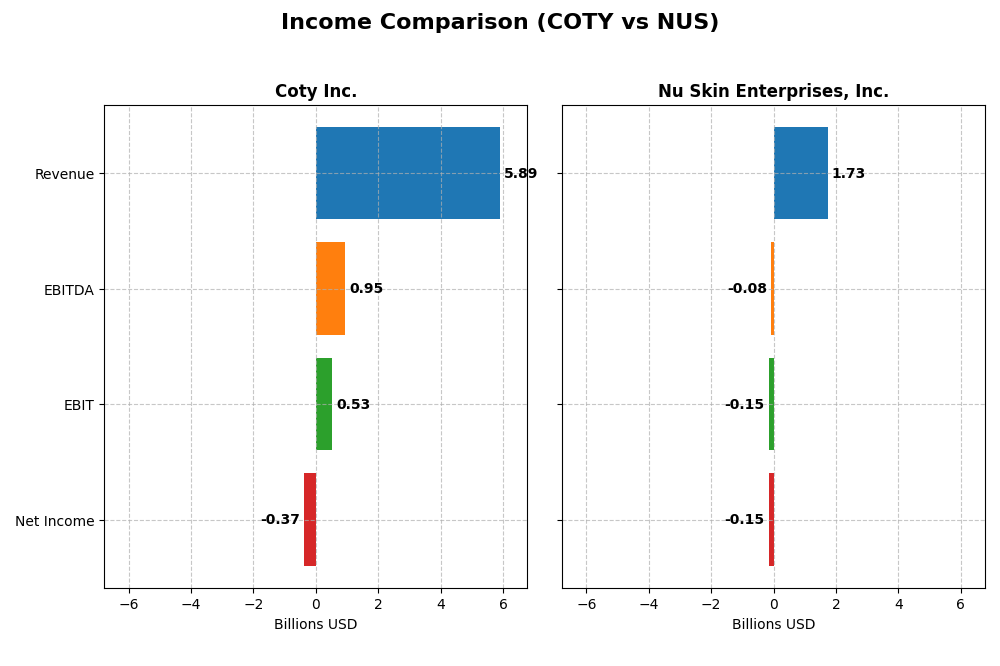
This table compares key income statement metrics for Coty Inc. and Nu Skin Enterprises, Inc. based on the most recent fiscal year data available.
| Metric | Coty Inc. (COTY) | Nu Skin Enterprises, Inc. (NUS) |
|---|---|---|
| Market Cap | 2.79B | 518M |
| Revenue | 5.89B | 1.73B |
| EBITDA | 950M | -79M |
| EBIT | 530M | -149M |
| Net Income | -368M | -147M |
| EPS | -0.44 | -2.95 |
| Fiscal Year | 2025 | 2024 |
Income Statement Interpretations
Coty Inc.
Coty’s revenue grew by 27.3% from 2021 to 2025 but declined 3.7% in the latest year, with net income falling sharply overall by 82.8%. Gross margin remained favorable at 64.8%, while EBIT margin showed neutrality. The 2025 fiscal year saw a negative net margin of -6.2%, indicating profitability challenges despite relatively stable operating efficiency.
Nu Skin Enterprises, Inc.
Nu Skin experienced a 32.9% revenue decline over 2020–2024 and posted an 8.5% negative net margin in 2024. Gross margin was favorable at 68.2%, yet EBIT margin was unfavorable at -8.6%. The latest year showed deteriorating profitability, with net income and EPS plunging and no signs of margin improvement amid decreasing sales.
Which one has the stronger fundamentals?
Both companies face unfavorable overall income statement evaluations, with Nu Skin showing more severe declines in revenue, net income, and margins. Coty’s higher gross margin and more stable EBIT margin suggest relatively better operational control. However, both report negative net margins and shrinking profitability, indicating fundamental weaknesses without a clear advantage.
Financial Ratios Comparison
The table below presents a side-by-side comparison of key financial ratios for Coty Inc. and Nu Skin Enterprises, Inc. based on their most recent fiscal year data.
| Ratios | Coty Inc. (2025) | Nu Skin Enterprises, Inc. (2024) |
|---|---|---|
| ROE | -9.98% | -22.50% |
| ROIC | 2.55% | -10.40% |
| P/E | -11.02 | -2.33 |
| P/B | 1.10 | 0.53 |
| Current Ratio | 0.77 | 1.82 |
| Quick Ratio | 0.46 | 1.17 |
| D/E | 1.15 | 0.73 |
| Debt-to-Assets | 35.7% | 32.6% |
| Interest Coverage | 1.06 | -5.74 |
| Asset Turnover | 0.49 | 1.18 |
| Fixed Asset Turnover | 6.04 | 3.71 |
| Payout ratio | -3.62% | -8.14% |
| Dividend yield | 0.33% | 3.49% |
Interpretation of the Ratios
Coty Inc.
Coty’s financial ratios reveal several weaknesses, including negative net margin (-6.24%) and return on equity (-9.98%), indicating profitability challenges. Current and quick ratios below 1 signal liquidity concerns, while debt to equity at 1.15 suggests elevated leverage. The dividend yield at 0.33% is weak, and no recent dividends were paid, reflecting possible retention for reinvestment or debt management.
Nu Skin Enterprises, Inc.
Nu Skin shows mixed results with unfavorable profitability ratios, including a net margin of -8.46% and a return on equity of -22.5%, but better liquidity metrics such as a current ratio of 1.82 and quick ratio of 1.17. The company pays dividends with a 3.49% yield supported by a payout ratio that appears sustainable despite negative earnings, likely balancing shareholder returns with growth investments.
Which one has the best ratios?
Nu Skin’s ratios are generally more favorable, with better liquidity, lower leverage, and a higher dividend yield despite profitability issues. Coty struggles with profitability, liquidity, and leverage, showing a predominantly unfavorable ratio profile. Thus, Nu Skin presents a more balanced financial position compared to Coty based on the evaluated metrics.
Strategic Positioning
This section compares the strategic positioning of Coty Inc. and Nu Skin Enterprises, Inc. in terms of market position, key segments, and exposure to technological disruption:
Coty Inc.
- Established global beauty products manufacturer with a diversified portfolio across prestige and consumer beauty segments, facing competitive pressures from multiple retail channels.
- Key segments include prestige fragrances, skin care, color cosmetics, and mass consumer beauty products driving revenues globally.
- Limited explicit mention of technological disruption exposure; product range includes skin treatment devices suggesting some tech integration.
Nu Skin Enterprises, Inc.
- Smaller market cap with focus on beauty and wellness products, selling primarily through direct and distributor channels, facing moderate competitive pressure.
- Key business drivers are skin care systems, nutritional supplements, and weight management products under ageLOC and Pharmanex brands.
- Moderate exposure to technological disruption through skin treatment devices and nutritional supplements research and development activities.
Coty Inc. vs Nu Skin Enterprises, Inc. Positioning
Coty operates a diversified product portfolio across multiple beauty categories and retail channels, offering broad market reach but facing complex competition. Nu Skin’s concentrated focus on beauty and wellness with direct sales may limit scale but enhances niche specialization.
Which has the best competitive advantage?
Both companies are shedding value relative to their cost of capital. Coty shows improving profitability trends, whereas Nu Skin faces declining returns, indicating Coty holds a slightly more favorable competitive advantage based on MOAT evaluation.
Stock Comparison
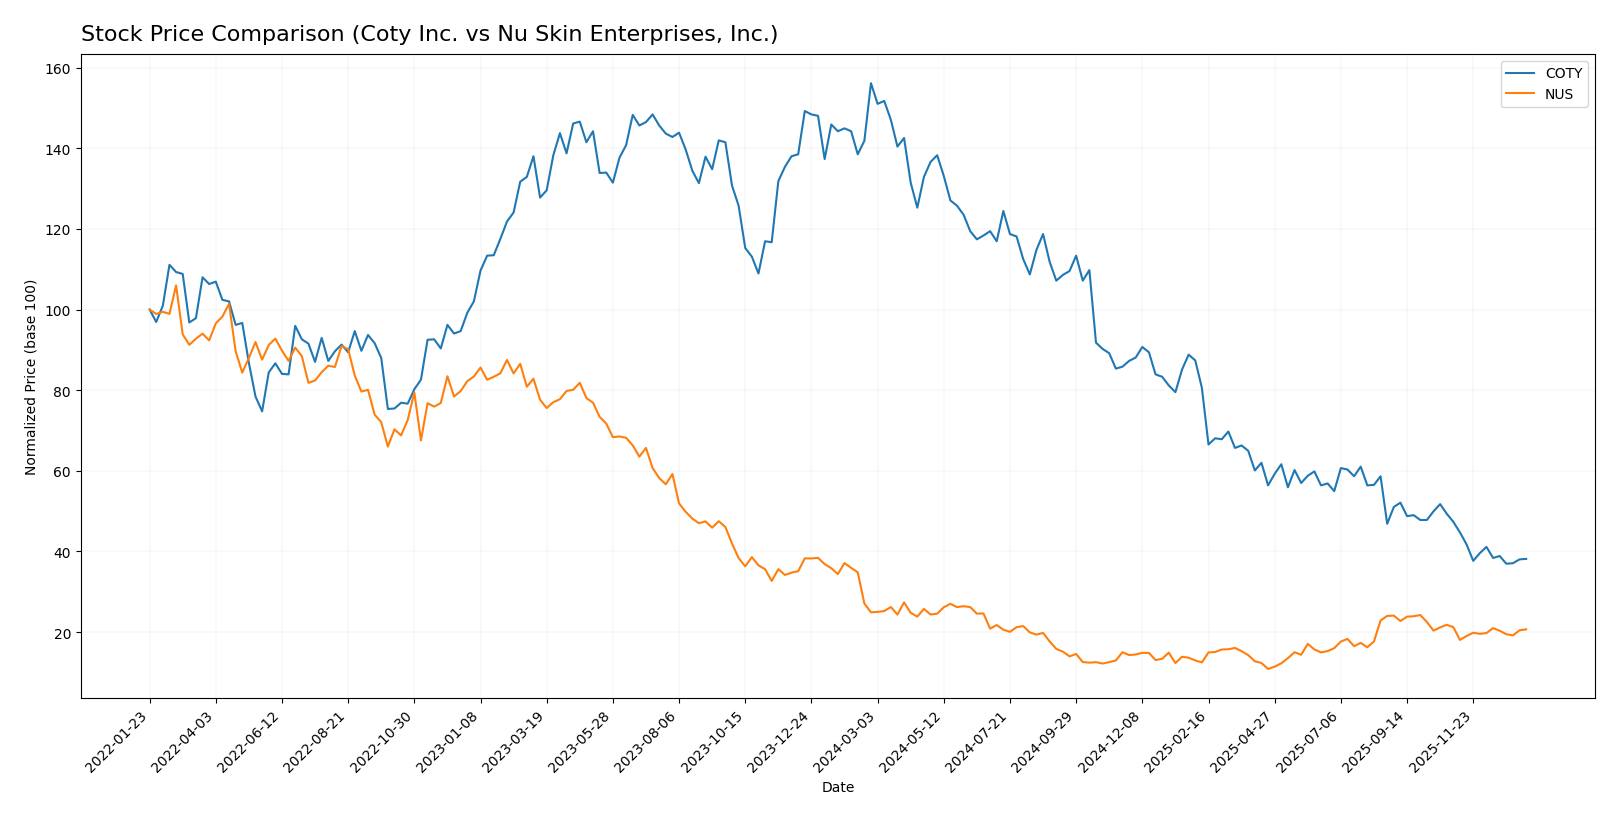
The past year shows pronounced bearish trends for both Coty Inc. and Nu Skin Enterprises, Inc., with Coty experiencing a sharper decline and higher volatility; recent trading volumes indicate a slight seller dominance for Coty and neutral buyer behavior for Nu Skin.
Trend Analysis
Coty Inc. exhibited a bearish trend over the past 12 months with a -75.57% price change, showing acceleration in the decline and a standard deviation of 2.82, with a high of 13.1 and a low of 3.1.
Nu Skin Enterprises, Inc. also recorded a bearish trend, declining -16.93% over the same period, with accelerating downward movement and a standard deviation of 2.34; its price ranged between 13.83 and 5.48.
Comparing the two, Coty’s stock underperformed Nu Skin’s substantially, delivering the lowest market return and greater volatility over the last year.
Target Prices
Here is the current consensus on target prices from verified analysts for selected companies.
| Company | Target High | Target Low | Consensus |
|---|---|---|---|
| Coty Inc. | 10 | 3.5 | 4.95 |
| Nu Skin Enterprises, Inc. | 11 | 11 | 11 |
Analysts expect Coty’s stock to rise modestly from its current price of 3.2 USD, while Nu Skin’s target consensus of 11 USD suggests a potential slight upside from its current 10.45 USD.
Analyst Opinions Comparison
This section compares analysts’ ratings and grades for Coty Inc. and Nu Skin Enterprises, Inc.:
Rating Comparison
COTY Rating
- Rating: C+, classified as Very Favorable overall.
- Discounted Cash Flow Score: 5, indicating a Very Favorable valuation outlook.
- ROE Score: 1, considered Very Unfavorable, showing weak profit generation.
- ROA Score: 1, considered Very Unfavorable, indicating poor asset utilization.
- Debt To Equity Score: 1, Very Unfavorable, indicating higher financial risk.
- Overall Score: 2, Moderate overall financial standing.
NUS Rating
- Rating: A, classified as Very Favorable overall.
- Discounted Cash Flow Score: 4, indicating a Favorable valuation outlook.
- ROE Score: 4, considered Favorable, showing efficient profit generation.
- ROA Score: 4, considered Favorable, indicating effective asset utilization.
- Debt To Equity Score: 3, Moderate, indicating moderate financial risk.
- Overall Score: 4, Favorable overall financial standing.
Which one is the best rated?
Based strictly on the provided data, Nu Skin Enterprises, Inc. holds a superior rating and overall scores across key financial metrics compared to Coty Inc., which has lower scores in profitability and financial risk measures.
Scores Comparison
The comparison of Coty Inc. and Nu Skin Enterprises, Inc. scores is as follows:
COTY Scores
- Altman Z-Score: 0.01, in distress zone indicating high bankruptcy risk.
- Piotroski Score: 4, average financial strength.
NUS Scores
- Altman Z-Score: 3.94, in safe zone indicating low bankruptcy risk.
- Piotroski Score: 8, very strong financial strength.
Which company has the best scores?
Nu Skin Enterprises, Inc. shows significantly stronger financial health with a safe zone Altman Z-Score and a very strong Piotroski Score. Coty Inc. is in financial distress with an average Piotroski Score.
Grades Comparison
Here is the comparison of recent grades assigned to Coty Inc. and Nu Skin Enterprises, Inc.:
Coty Inc. Grades
The following table shows recent grades from reputable grading companies for Coty Inc.:
| Grading Company | Action | New Grade | Date |
|---|---|---|---|
| Evercore ISI Group | Downgrade | In Line | 2025-12-23 |
| Citigroup | Maintain | Neutral | 2025-12-17 |
| TD Cowen | Maintain | Hold | 2025-12-12 |
| Berenberg | Downgrade | Hold | 2025-09-10 |
| Morgan Stanley | Maintain | Equal Weight | 2025-08-25 |
| RBC Capital | Maintain | Outperform | 2025-08-22 |
| Wells Fargo | Maintain | Equal Weight | 2025-08-22 |
| Goldman Sachs | Maintain | Neutral | 2025-08-22 |
| Barclays | Maintain | Underweight | 2025-08-22 |
| B of A Securities | Maintain | Underperform | 2025-08-22 |
Overall, Coty’s grades show a mixed to cautious sentiment with several downgrades and a consensus leaning towards holding the stock.
Nu Skin Enterprises, Inc. Grades
The following table lists recent grades from reputable grading companies for Nu Skin Enterprises, Inc.:
| Grading Company | Action | New Grade | Date |
|---|---|---|---|
| DA Davidson | Maintain | Neutral | 2024-12-20 |
| Citigroup | Maintain | Neutral | 2024-10-22 |
| DA Davidson | Maintain | Neutral | 2024-08-12 |
| Citigroup | Maintain | Neutral | 2024-08-09 |
| DA Davidson | Maintain | Neutral | 2024-05-09 |
| DA Davidson | Maintain | Neutral | 2024-01-05 |
| Stifel | Maintain | Hold | 2023-10-16 |
| Stifel | Maintain | Hold | 2023-10-15 |
| Citigroup | Maintain | Neutral | 2023-09-29 |
| Citigroup | Maintain | Neutral | 2023-09-28 |
Nu Skin’s ratings consistently indicate a neutral to hold stance, reflecting a stable but cautious outlook.
Which company has the best grades?
Coty Inc. has a broader range of grades including some downgrades, while Nu Skin Enterprises, Inc. shows a consistent pattern of neutral and hold ratings. Coty’s mixed grades may suggest higher volatility in analyst sentiment, potentially impacting investor confidence differently compared to Nu Skin’s more stable but unenthusiastic consensus.
Strengths and Weaknesses
Below is a comparative table highlighting the key strengths and weaknesses of Coty Inc. (COTY) and Nu Skin Enterprises, Inc. (NUS) based on their diversification, profitability, innovation, global presence, and market share as of 2026.
| Criterion | Coty Inc. (COTY) | Nu Skin Enterprises, Inc. (NUS) |
|---|---|---|
| Diversification | Moderate: Focused on Consumer Beauty & Prestige segments; less diversified recently | Moderate: Primarily Nu Skin products with smaller manufacturing and other segments |
| Profitability | Low: Negative net margin (-6.24%), ROIC slightly positive but below WACC; value destroying | Weak: Negative net margin (-8.46%), declining ROIC well below WACC; value destroying |
| Innovation | Moderate: Stable product lines in beauty, some recent growth in profitability | Low: Declining profitability and innovation indicated by falling ROIC and interest coverage |
| Global presence | Strong: Established global footprint in beauty industry | Moderate: Global presence but less diversified product portfolio |
| Market Share | Moderate: Large in prestige beauty segment, declining Consumer Beauty sales | Moderate: Consistent revenue from Nu Skin segment but shrinking overall profitability |
Key takeaways: Coty Inc. shows signs of improving profitability despite currently destroying value, supported by a strong global presence. Nu Skin faces more significant challenges with declining profitability and value destruction. Both companies require cautious investment consideration due to profitability concerns and the need for strategic growth initiatives.
Risk Analysis
Below is a comparative risk table for Coty Inc. (COTY) and Nu Skin Enterprises, Inc. (NUS) based on the most recent financial and operational data of 2025 and 2024 respectively.
| Metric | Coty Inc. (COTY) | Nu Skin Enterprises, Inc. (NUS) |
|---|---|---|
| Market Risk | Moderate (Beta 0.958, volatile price range 2.94-7.71) | Moderate (Beta 0.977, wider price range 5.32-14.62) |
| Debt level | High (Debt-to-Equity 1.15, interest coverage 2.33) | Moderate (Debt-to-Equity 0.73, negative interest coverage) |
| Regulatory Risk | Moderate (Global presence, consumer products sector) | Moderate (Direct selling in China and global) |
| Operational Risk | Elevated (Negative margins, low liquidity ratios) | Elevated (Negative margins, but better liquidity) |
| Environmental Risk | Moderate (Consumer products, brand reputation exposure) | Moderate (Wellness products, potential supply chain risks) |
| Geopolitical Risk | Moderate (Global distribution in 150 countries) | Elevated (Retail operation in Mainland China) |
The most likely and impactful risks for Coty include high debt levels combined with negative profitability and liquidity positions, increasing financial distress risk. Nu Skin faces operational and geopolitical risks due to its direct retail presence in China and negative interest coverage, despite stronger balance sheet metrics. Investors should monitor debt servicing ability and regulatory changes closely for both.
Which Stock to Choose?
Coty Inc. shows mixed financial performance with declining income over recent years, unfavorable profitability ratios including a negative net margin and ROE, and high debt levels. Its financial ratios are mostly unfavorable, yet it holds a very favorable overall rating of C+, indicating some positive valuation aspects despite operational challenges.
Nu Skin Enterprises, Inc. displays a more favorable financial ratio profile with better liquidity and lower debt, though it suffers from negative profitability metrics such as net margin and ROE. The company’s income statement shows sustained unfavorable trends, but it maintains a strong overall rating of A, supported by robust scores in cash flow and financial strength.
For investors, the choice might depend on risk tolerance and investment focus: those prioritizing financial stability and stronger ratings may find Nu Skin Enterprises more aligned with their goals, while investors seeking potential recovery in profitability might interpret Coty’s improving ROIC trend as a signal worth monitoring, despite its current financial headwinds.
Disclaimer: Investment carries a risk of loss of initial capital. The past performance is not a reliable indicator of future results. Be sure to understand risks before making an investment decision.
Go Further
I encourage you to read the complete analyses of Coty Inc. and Nu Skin Enterprises, Inc. to enhance your investment decisions: