Home > Comparison > Consumer Defensive > COTY vs NWL
The strategic rivalry between Coty Inc. and Newell Brands Inc. shapes the competitive landscape in Consumer Defensive products. Coty operates as a global beauty product manufacturer with a portfolio spanning prestige and mass-market brands. In contrast, Newell Brands excels as a diversified consumer goods conglomerate with extensive household and commercial product lines. This analysis assesses which company’s operational approach offers superior risk-adjusted returns for a diversified portfolio amid evolving market dynamics.
Table of contents
Companies Overview
Coty Inc. and Newell Brands Inc. stand as key players in the global household and personal products market.
Coty Inc.: Beauty Powerhouse with Diverse Brand Portfolio
Coty Inc. dominates the beauty and personal care sector by manufacturing and marketing prestige fragrances and cosmetics globally. Its core revenue stems from luxury and mass-market brands sold through department stores and e-commerce platforms. In 2026, the company focuses on expanding direct-to-consumer channels and strengthening its portfolio of iconic fragrance and skincare brands.
Newell Brands Inc.: Consumer Products Conglomerate
Newell Brands Inc. operates across five segments, offering diversified consumer and commercial products including home appliances, outdoor gear, and writing instruments. Its revenue base is broad, supported by strong brands like Rubbermaid and Coleman. The company’s strategic priority in 2026 centers on product innovation and enhancing its omni-channel retail presence to boost market penetration.
Strategic Collision: Similarities & Divergences
Both companies compete in the consumer defensive sector but differ sharply in scope and approach. Coty focuses on a brand-driven, prestige beauty ecosystem while Newell relies on a diversified product portfolio spanning multiple consumer categories. Their battleground lies in retail channel expansion, yet Coty’s niche luxury appeal contrasts with Newell’s mass-market versatility. These distinctions shape distinct investment profiles, balancing brand strength versus product breadth.
Income Statement Comparison
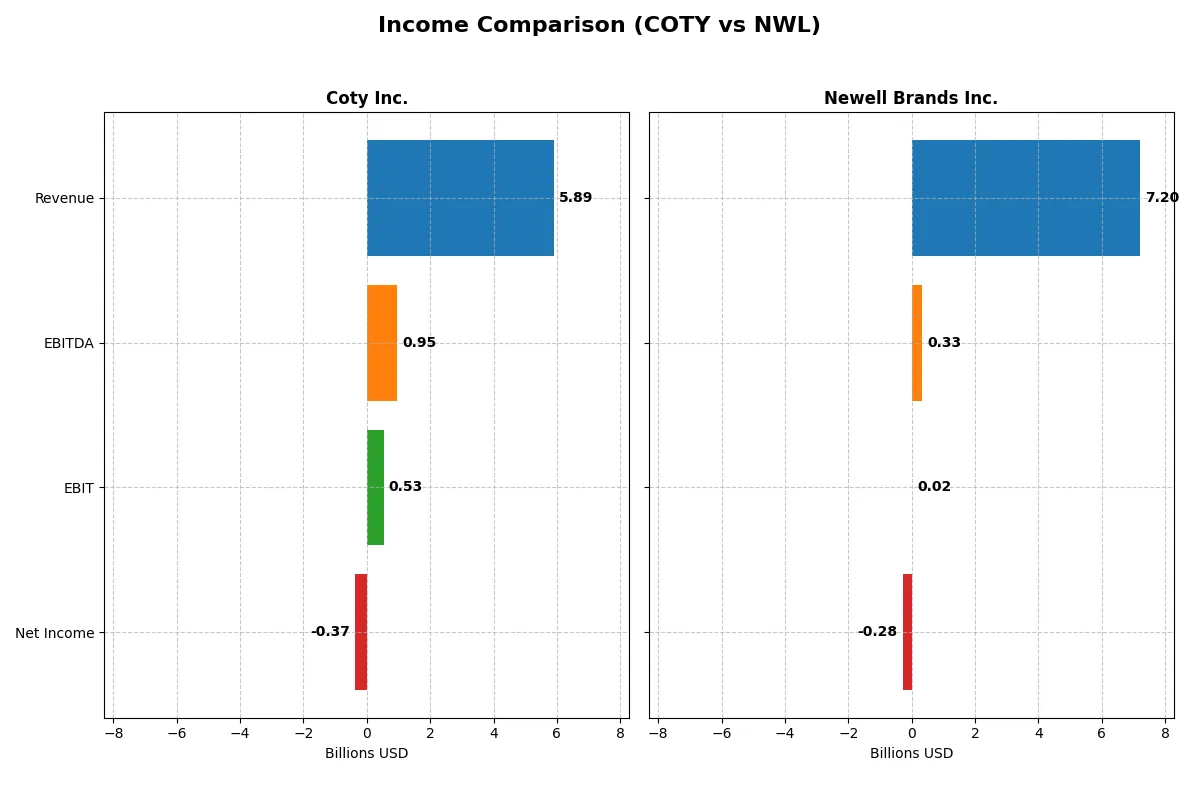
This data dissects the core profitability and scalability of both corporate engines to reveal who dominates the bottom line:
| Metric | Coty Inc. (COTY) | Newell Brands Inc. (NWL) |
|---|---|---|
| Revenue | 5.89B | 7.20B |
| Cost of Revenue | 2.07B | 4.77B |
| Operating Expenses | 3.58B | 1.99B |
| Gross Profit | 3.82B | 2.43B |
| EBITDA | 950M | 331M |
| EBIT | 530M | 20M |
| Interest Expense | 227M | 321M |
| Net Income | -368M | -285M |
| EPS | -0.44 | -0.68 |
| Fiscal Year | 2025 | 2025 |
Income Statement Analysis: The Bottom-Line Duel
This income statement comparison reveals which company drives profitability and operational efficiency more effectively through recent market cycles.
Coty Inc. Analysis
Coty’s revenue grew 27% from 2021 to 2025 but declined 3.7% in the latest year to $5.9B. The firm maintains a robust gross margin near 65%, signaling efficient cost control. However, net income plunged to a -$381M loss in 2025, reflecting margin pressures and deteriorating bottom-line momentum.
Newell Brands Inc. Analysis
Newell’s revenue declined nearly 32% over five years, with a 5% drop in 2025 to $7.2B. Its gross margin halved compared to Coty at 34%, indicating a thinner profit buffer. Despite a slight positive EBIT margin, Newell posted a -$285M net loss in 2025, highlighting ongoing challenges in converting scale into profits.
Margin Strength vs. Revenue Contraction
Coty’s superior gross margin and historical revenue growth contrast with Newell’s shrinking sales and compressed margins. Both companies reported net losses in 2025, but Coty’s higher gross profit suggests better cost efficiency. Investors seeking operational leverage may favor Coty’s profile, while Newell’s scale faces headwinds undermining profitability.
Financial Ratios Comparison
These vital ratios act as a diagnostic tool to expose the underlying fiscal health, valuation premiums, and capital efficiency of the companies compared below:
| Ratios | Coty Inc. (COTY) | Newell Brands Inc. (NWL) |
|---|---|---|
| ROE | -9.98% (2025) | -11.92% (2025) |
| ROIC | 2.55% (2025) | 5.09% (2025) |
| P/E | -11.0 (2025) | -5.46 (2025) |
| P/B | 1.10 (2025) | 0.65 (2025) |
| Current Ratio | 0.77 (2025) | 1.07 (2025) |
| Quick Ratio | 0.46 (2025) | 0.57 (2025) |
| D/E | 1.15 (2025) | 2.32 (2025) |
| Debt-to-Assets | 35.7% (2025) | 51.7% (2025) |
| Interest Coverage | 1.06 (2025) | 1.39 (2025) |
| Asset Turnover | 0.49 (2025) | 0.67 (2025) |
| Fixed Asset Turnover | 6.04 (2025) | 4.33 (2025) |
| Payout Ratio | -3.6% (2025) | -42.1% (2025) |
| Dividend Yield | 0.33% (2025) | 7.71% (2025) |
| Fiscal Year | 2025 | 2025 |
Efficiency & Valuation Duel: The Vital Signs
Ratios act as a company’s DNA, revealing hidden risks and operational excellence behind headline financials.
Coty Inc.
Coty’s profitability metrics show weakness, with a negative ROE of -9.98% and a net margin of -6.24%, signaling operational challenges. The stock appears undervalued with a favorable P/E of -11.02 and P/B of 1.1. Shareholder returns are modest, offering a low 0.33% dividend yield amid reinvestment in fixed assets.
Newell Brands Inc.
Newell posts even lower profitability, with ROE at -11.92% and net margin at -3.96%, reflecting ongoing headwinds. Its valuation looks more attractive, featuring a favorable P/E of -5.46 and a P/B of 0.65. The firm yields a higher 7.71% dividend, balancing weak profitability with steady income for shareholders.
Valuation Stretch vs. Profitability Struggles
Both companies suffer negative returns on equity and margins, but Newell offers a higher dividend and better valuation metrics. Coty trades at a slightly higher valuation but reinvests in assets for potential growth. Investors seeking income might prefer Newell, while those focused on asset-backed value may lean toward Coty.
Which one offers the Superior Shareholder Reward?
I compare Coty Inc. (COTY) and Newell Brands Inc. (NWL) on dividends, payout ratios, and buybacks. Coty pays a minimal 0.33% dividend with a low payout ratio (~15%) but suffers negative net margins and weak cash flow coverage, signaling distribution risk. Newell yields a robust 7.7% dividend with a negative payout ratio due to losses, indicating dividend coverage issues. Coty’s buybacks are limited by financial leverage and negative profitability, while Newell maintains active buybacks despite debt strain. Historically, sustainable shareholder rewards require solid earnings and cash flow. I conclude Newell offers superior total shareholder return potential in 2026, thanks to its higher yield and aggressive buybacks, but investors must monitor its financial leverage and earnings volatility closely.
Comparative Score Analysis: The Strategic Profile
The radar chart reveals the fundamental DNA and trade-offs of Coty Inc. and Newell Brands Inc., highlighting their financial strengths and strategic exposures:
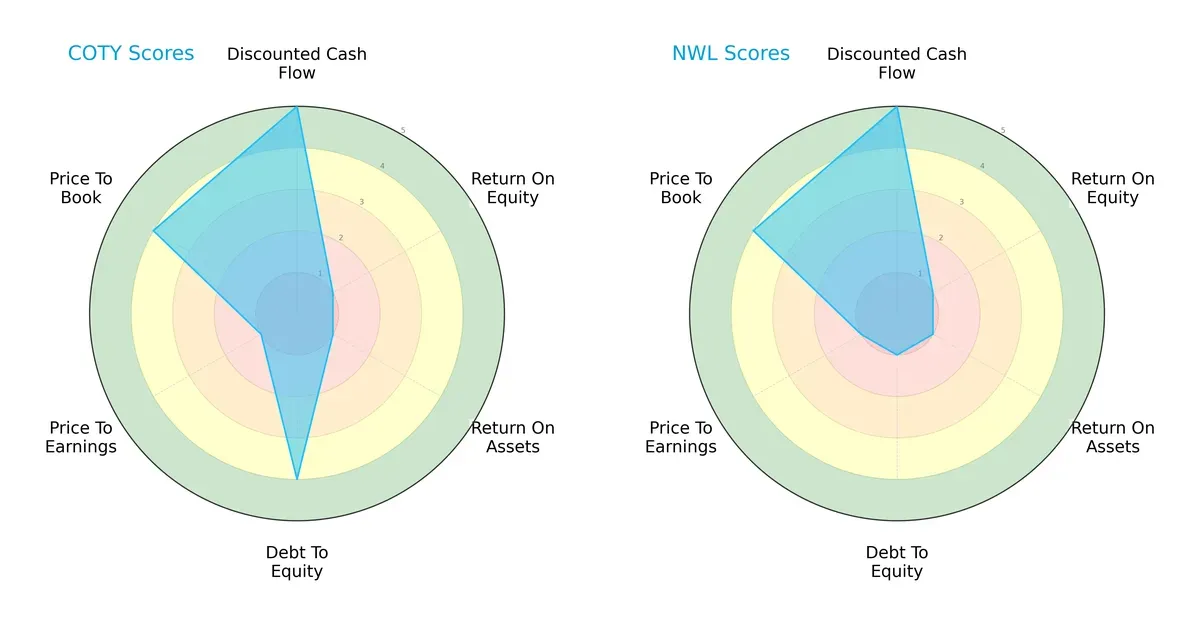
Coty shows a more balanced profile, excelling in discounted cash flow (5) and debt-to-equity (4), signaling disciplined capital structure management. Newell matches Coty’s DCF score but suffers from a weak debt-to-equity score (1), indicating higher financial risk. Both firms struggle with return on equity (1) and return on assets (1), reflecting operational challenges. Coty’s valuation metrics (PE 1, PB 4) suggest undervaluation with solid book value support, while Newell’s low PE and favorable PB signal market skepticism and potential bargain territory.
Bankruptcy Risk: Solvency Showdown
The Altman Z-Scores place both companies in the distress zone, with Coty at -0.06 and Newell at 0.84, implying elevated bankruptcy risk in this cycle:
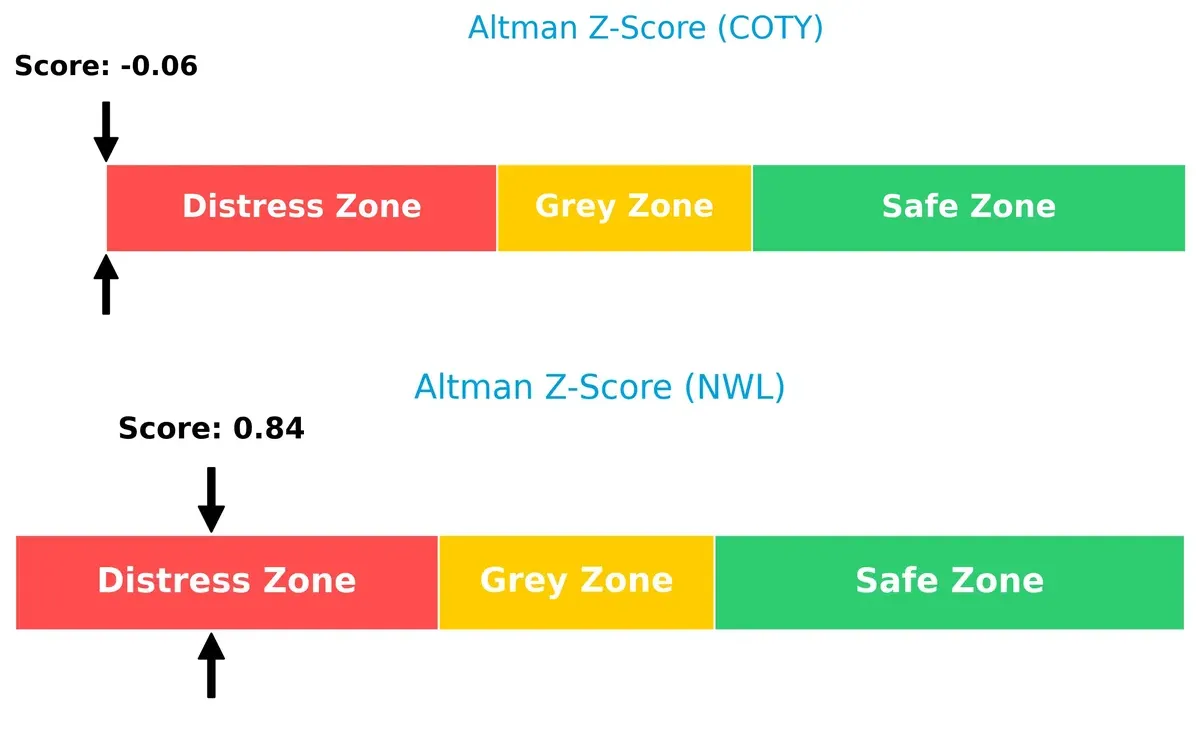
Coty’s negative score is a red flag, signaling acute financial distress. Newell, while slightly better, remains vulnerable with a sub-1.8 score, meaning both firms require urgent balance sheet improvements to ensure survival.
Financial Health: Quality of Operations
Coty’s Piotroski F-Score of 4 outperforms Newell’s weak 2, indicating better but still moderate operational quality and internal financial health:
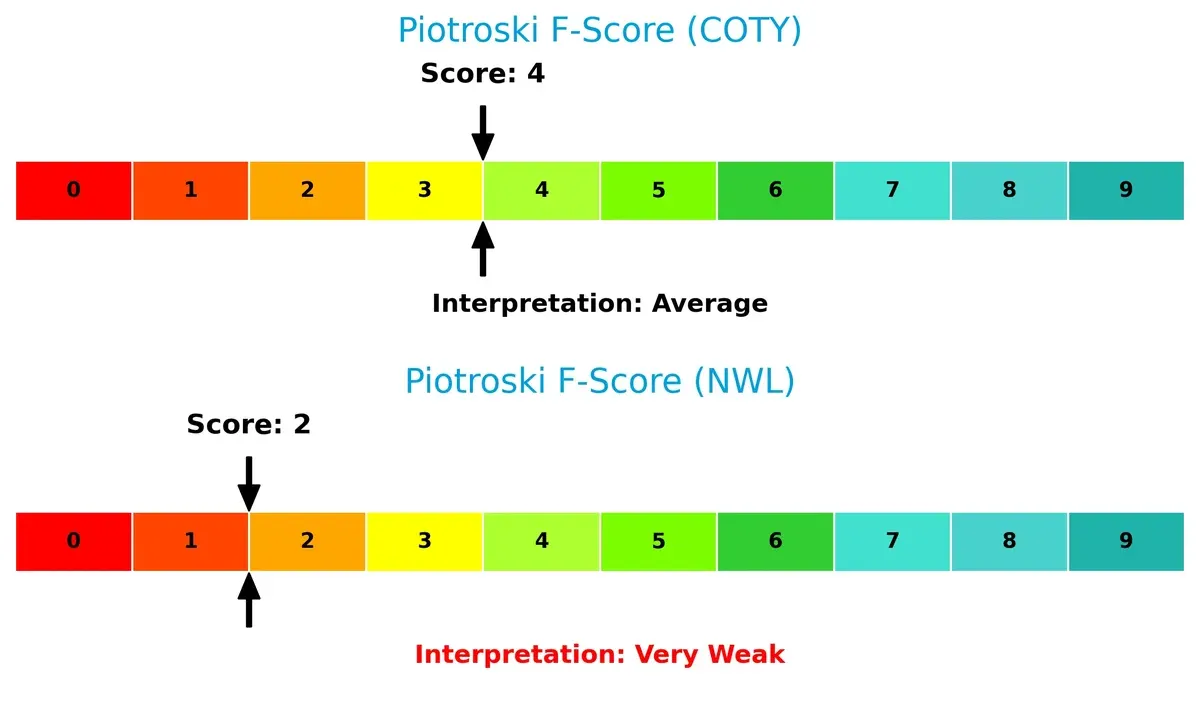
Coty demonstrates average financial strength, avoiding severe red flags. Newell’s very weak score warns of internal inefficiencies and deteriorating fundamentals, heightening investment risk.
—
In summary, Coty offers a more balanced and financially disciplined profile but faces significant operational and solvency risks. Newell’s deeper financial distress and poorer operational health make it a riskier proposition despite attractive valuation. Investors must weigh these vulnerabilities carefully against sector benchmarks.
How are the two companies positioned?
This section dissects the operational DNA of Coty and Newell by comparing their revenue distribution by segment and internal dynamics, including strengths and weaknesses. The final objective confronts their economic moats to reveal which model offers the most resilient competitive advantage today.
Revenue Segmentation: The Strategic Mix
The following visual comparison dissects how Coty Inc. and Newell Brands Inc. diversify their income streams and where their primary sector bets lie:
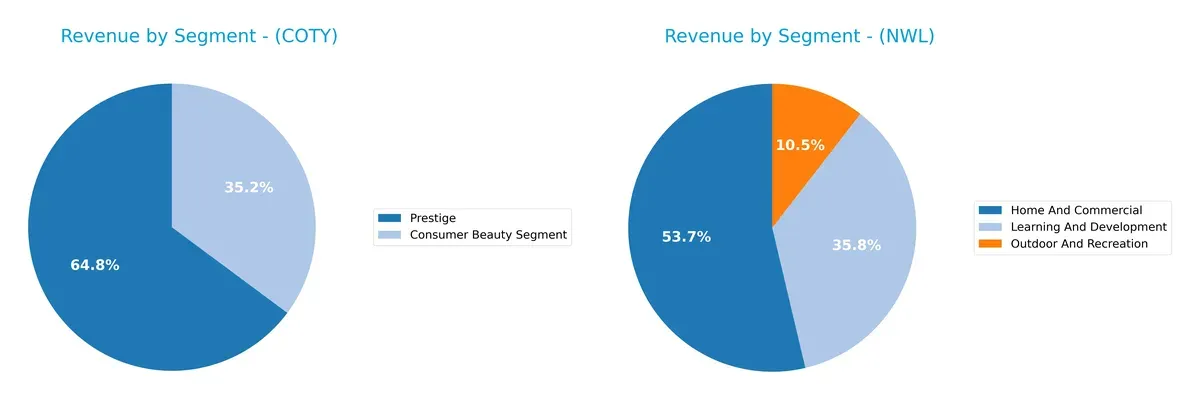
Coty anchors its revenue in two dominant segments: Prestige at $3.8B and Consumer Beauty at $2.1B, showing a concentrated focus on beauty and luxury. Newell Brands displays a more diversified mix, with Home and Commercial at $4.1B and Learning and Development at $2.7B, plus a meaningful Outdoor and Recreation segment at $794M. Coty’s concentration risks contrast with Newell’s broader ecosystem, which may provide better resilience.
Strengths and Weaknesses Comparison
This table compares the strengths and weaknesses of Coty Inc. and Newell Brands Inc.:
Coty Inc. Strengths
- Favorable fixed asset turnover at 6.04 indicating efficient use of fixed assets
- Favorable WACC at 5.35 supporting capital cost management
- Price-to-book ratio at 1.1 suggests reasonable valuation
- Diversified product segments with Consumer Beauty and Prestige
- Global presence including Americas, Asia Pacific, and EMEA regions
Newell Brands Inc. Strengths
- Favorable WACC at 5.81 supports cost-effective capital deployment
- Favorable price-to-earnings and price-to-book ratios indicate market confidence
- Diversified product portfolio across Home, Learning, and Outdoor segments
- Strong revenue concentration in North America with significant foreign country sales
- Favorable fixed asset turnover at 4.33 showing asset productivity
Coty Inc. Weaknesses
- Negative net margin (-6.24%) and ROE (-9.98%) highlight profitability issues
- Low current (0.77) and quick ratios (0.46) signal liquidity constraints
- Above-par debt-to-equity ratio (1.15) and unfavorable asset turnover (0.49)
- Negative price-to-earnings ratio (-11.02) despite some favorable ratios
- Dividend yield is low at 0.33% reflecting limited shareholder returns
Newell Brands Inc. Weaknesses
- Negative net margin (-3.96%) and ROE (-11.92%) demonstrate profitability challenges
- High debt-to-equity (2.32) and debt-to-assets (51.69%) ratios raise leverage concerns
- Very weak interest coverage ratio (0.06) indicates difficulty servicing debt
- Quick ratio is unfavorable at 0.57 affecting short-term liquidity
- Negative price-to-earnings ratio (-5.46) despite some favorable valuation metrics
Both companies exhibit challenges in profitability and leverage management despite favorable capital costs and product diversification. Coty shows liquidity risks, while Newell faces more severe debt servicing issues. These factors will shape their strategic focus on operational efficiency and financial stability.
The Moat Duel: Analyzing Competitive Defensibility
A structural moat is the only defense guarding long-term profits from relentless competitive erosion. Here’s how Coty Inc. and Newell Brands Inc. stack up:
Coty Inc.: Intangible Assets Powerhouse
Coty’s moat centers on strong brand equity and portfolio of prestige and mass-market beauty brands. This drives margin stability and a rising ROIC, despite recent net losses. New product launches in skincare could deepen its moat in 2026.
Newell Brands Inc.: Diversified Product Ecosystem
Newell leans on a broad product lineup across consumer and commercial segments, with scale advantages contrasting Coty’s brand focus. However, its declining ROIC signals weakening capital efficiency. Opportunities lie in innovation and international expansion.
Prestige Branding vs. Scale Diversification: The Moat Face-Off
Coty’s growing ROIC amid value erosion suggests a more resilient moat than Newell’s declining profitability and capital destruction. Coty appears better positioned to defend market share through brand strength and innovation in 2026.
Which stock offers better returns?
The past year reveals stark divergences in trading dynamics and price action between Coty Inc. and Newell Brands Inc., with both showing significant shifts in investor sentiment and market momentum.
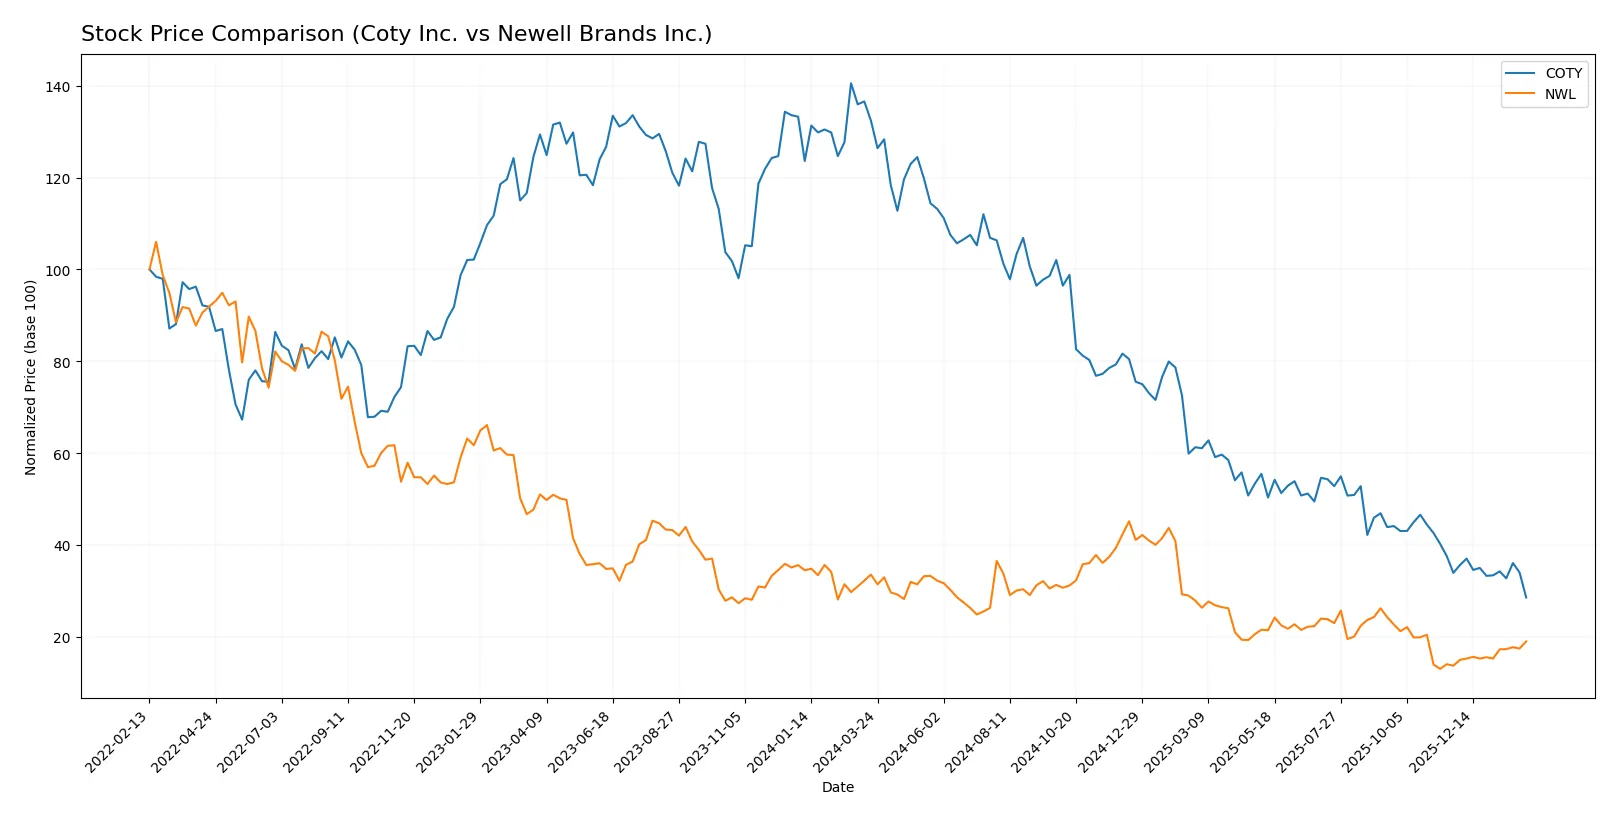
Trend Comparison
Coty Inc.’s stock declined sharply by 78.44% over the past 12 months, marking a bearish trend with accelerating losses and a high price volatility of 2.71, hitting a low of 2.66 from a 12.34 peak.
Newell Brands Inc. also faced a bearish trend with a 43.4% drop over the same period, though it showed accelerating losses. Recently, it rebounded 38.62%, reflecting buyer dominance and rising momentum.
Newell Brands outperformed Coty in market returns over the year, suffering less overall decline and demonstrating a recent strong recovery, while Coty continued accelerating its downtrend.
Target Prices
Analysts present a cautious but optimistic target consensus for Coty Inc. and Newell Brands Inc.
| Company | Target Low | Target High | Consensus |
|---|---|---|---|
| Coty Inc. | 3.00 | 10.00 | 4.76 |
| Newell Brands Inc. | 4.25 | 8.00 | 5.58 |
The target consensus for Coty Inc. sits well above its current price of 2.66, indicating potential upside. Newell Brands’ consensus of 5.58 exceeds its current 4.63 price, suggesting moderate growth expectations.

Don’t Let Luck Decide Your Entry Point
Optimize your entry points with our advanced ProRealTime indicators. You’ll get efficient buy signals with precise price targets for maximum performance. Start outperforming now!
How do institutions grade them?
The following tables summarize recent grades assigned to Coty Inc. and Newell Brands Inc. by reputable grading firms:
Coty Inc. Grades
This table displays recent grades from established financial institutions for Coty Inc.:
| Grading Company | Action | New Grade | Date |
|---|---|---|---|
| RBC Capital | maintain | Outperform | 2026-02-03 |
| TD Cowen | maintain | Hold | 2026-01-21 |
| Evercore ISI Group | downgrade | In Line | 2025-12-23 |
| Citigroup | maintain | Neutral | 2025-12-17 |
| TD Cowen | maintain | Hold | 2025-12-12 |
| Berenberg | downgrade | Hold | 2025-09-10 |
| Morgan Stanley | maintain | Equal Weight | 2025-08-25 |
| Canaccord Genuity | maintain | Hold | 2025-08-22 |
| B of A Securities | maintain | Underperform | 2025-08-22 |
| Goldman Sachs | maintain | Neutral | 2025-08-22 |
Newell Brands Inc. Grades
This table shows recent grades issued by respected firms for Newell Brands Inc.:
| Grading Company | Action | New Grade | Date |
|---|---|---|---|
| Canaccord Genuity | maintain | Buy | 2026-01-26 |
| UBS | maintain | Neutral | 2026-01-14 |
| Citigroup | maintain | Neutral | 2026-01-14 |
| Citigroup | maintain | Neutral | 2025-12-17 |
| UBS | maintain | Neutral | 2025-12-02 |
| JP Morgan | maintain | Overweight | 2025-11-03 |
| RBC Capital | maintain | Sector Perform | 2025-11-03 |
| Citigroup | maintain | Neutral | 2025-11-03 |
| Canaccord Genuity | maintain | Buy | 2025-11-03 |
| JP Morgan | maintain | Overweight | 2025-10-23 |
Which company has the best grades?
Newell Brands consistently receives Buy and Overweight ratings, indicating stronger institutional confidence than Coty. Coty’s grades range from Underperform to Outperform, showing mixed sentiment. Investors may view Newell as having a more favorable consensus outlook.
Risks specific to each company
In the challenging 2026 market environment, these categories highlight the critical pressure points and systemic threats confronting both Coty Inc. and Newell Brands Inc.:
1. Market & Competition
Coty Inc.
- Faces intense competition in prestige and mass beauty segments, risking margin pressure.
Newell Brands Inc.
- Competes in diverse consumer product lines with pressure from innovation and private labels.
2. Capital Structure & Debt
Coty Inc.
- Moderate leverage with debt-to-equity 1.15; interest coverage at 2.33 signals manageable but cautious debt risk.
Newell Brands Inc.
- High leverage at 2.32 debt-to-equity; interest coverage near zero is a red flag for financial distress.
3. Stock Volatility
Coty Inc.
- Beta 0.918 indicates slightly less volatility than broader market; range $2.44-$7.10 shows wide price swings.
Newell Brands Inc.
- Beta 0.929 implies similar market volatility; price fluctuates between $3.07-$7.53, reflecting uncertainty.
4. Regulatory & Legal
Coty Inc.
- Exposure to international regulations in cosmetics, with risks from product safety and labeling laws.
Newell Brands Inc.
- Faces regulatory scrutiny across multiple consumer product categories, increasing compliance complexity.
5. Supply Chain & Operations
Coty Inc.
- Relies on global third-party distributors; supply chain disruptions could impact 150 countries.
Newell Brands Inc.
- Broad product portfolio increases operational complexity; supply chain challenges could affect multiple segments.
6. ESG & Climate Transition
Coty Inc.
- Increasing pressure to adopt sustainable packaging and reduce carbon footprint in beauty industry.
Newell Brands Inc.
- Faces ESG demands across household and outdoor products; carbon transition costs and reputational risks present.
7. Geopolitical Exposure
Coty Inc.
- Global footprint exposes it to trade tensions and currency volatility impacting revenues and costs.
Newell Brands Inc.
- US-based but with international sales; geopolitical risks include tariffs and supply chain disruptions.
Which company shows a better risk-adjusted profile?
Coty’s most impactful risk is its weak profitability and average liquidity, but it maintains better debt serviceability. Newell’s critical risk lies in its high leverage and near-zero interest coverage, signaling acute financial distress. Coty’s lower debt-to-equity and manageable interest coverage give it a better risk-adjusted profile amid 2026’s volatility. Notably, Newell’s interest coverage at 0.06 alarms me, reflecting substantial risk of default under tightening credit conditions.
Final Verdict: Which stock to choose?
Coty Inc. wields a superpower in its improving profitability trajectory despite current value destruction. Its aggressive capital structure and weak liquidity remain points of vigilance. This stock might suit investors with a high-risk tolerance seeking turnaround potential in an aggressive growth portfolio.
Newell Brands Inc. offers a strategic moat in its diversified consumer staples presence and relatively safer balance sheet. While profitability declines and debt levels raise caution, its stable cash flow profile could fit investors looking for GARP – growth at a reasonable price – strategies with moderate risk appetites.
If you prioritize aggressive growth with a bet on operational recovery, Coty’s improving ROIC trend outshines due to its rising profitability momentum. However, if you seek better stability and income consistency, Newell Brands offers a more conservative investment scenario, albeit with structural challenges. Both stocks carry notable risks, demanding careful portfolio fit analysis.
Disclaimer: Investment carries a risk of loss of initial capital. The past performance is not a reliable indicator of future results. Be sure to understand risks before making an investment decision.
Go Further
I encourage you to read the complete analyses of Coty Inc. and Newell Brands Inc. to enhance your investment decisions: