Home > Comparison > Consumer Defensive > KMB vs COTY
The strategic rivalry between Kimberly-Clark Corporation and Coty Inc. shapes the competitive landscape of the Household & Personal Products sector. Kimberly-Clark operates as a capital-intensive leader focused on personal care and consumer tissue products. Coty, by contrast, emphasizes high-margin beauty and fragrance products with a global retail footprint. This analysis evaluates which company’s operational model offers superior risk-adjusted returns for a diversified portfolio seeking exposure in consumer defensive industries.
Table of contents
Companies Overview
Kimberly-Clark and Coty shape the global household and personal products market with distinct scales and strategies.
Kimberly-Clark Corporation: Global Leader in Personal and Consumer Tissue Products
Kimberly-Clark dominates the household and personal care industry with a portfolio of trusted brands like Huggies and Kleenex. It generates revenue by manufacturing and marketing disposable diapers, tissues, and professional hygiene products worldwide. In 2026, the company focuses on expanding its consumer tissue and away-from-home professional segments, leveraging strong brand equity and broad retail distribution.
Coty Inc.: Prestige and Mass Beauty Products Powerhouse
Coty operates as a major player in beauty and cosmetics, offering fragrance, skincare, and color cosmetics. Its revenue stems from a dual-channel approach targeting both prestige retailers and mass-market outlets globally under brands like Gucci and CoverGirl. The company’s 2026 strategy centers on scaling its direct-to-consumer platforms and optimizing brand portfolios to enhance market penetration.
Strategic Collision: Similarities & Divergences
Both firms compete within the personal care sector but diverge sharply in business models—Kimberly-Clark relies on a staple consumer goods approach, while Coty pursues beauty and luxury product innovation. The primary battleground lies in global brand recognition and retail channel dominance. Kimberly-Clark offers a stable dividend and lower beta, contrasting Coty’s higher volatility and growth-focused momentum.
Income Statement Comparison
This data dissects the core profitability and scalability of both corporate engines to reveal who dominates the bottom line:

| Metric | Kimberly-Clark Corporation (KMB) | Coty Inc. (COTY) |
|---|---|---|
| Revenue | 17.2B | 5.9B |
| Cost of Revenue | 11.1B | 2.1B |
| Operating Expenses | 3.6B | 3.6B |
| Gross Profit | 6.1B | 3.8B |
| EBITDA | 3.1B | 950M |
| EBIT | 2.5B | 530M |
| Interest Expense | 256M | 227M |
| Net Income | 2.0B | -368M |
| EPS | 6.08 | -0.44 |
| Fiscal Year | 2025 | 2025 |
Income Statement Analysis: The Bottom-Line Duel
This income statement comparison reveals which company runs its financial engine with more efficiency and sustainable profitability.
Kimberly-Clark Corporation Analysis
Kimberly-Clark’s revenue dropped 14% in 2025 to 17.2B, yet net income remained strong at 2.0B, reflecting resilient operations. Its gross margin holds firm at 35.6%, while a net margin of 11.7% signals solid profitability. Despite recent revenue decline, the company sustains favorable margins and steady bottom-line growth.
Coty Inc. Analysis
Coty’s revenue fell 3.7% to 5.9B in 2025, with a net loss of 367M marking continued profitability challenges. Coty boasts a high gross margin of 64.8%, but its negative net margin of -6.2% reveals heavy costs eroding profits. The company struggles with declining earnings and negative net income momentum.
Margin Strength vs. Profit Resilience
Kimberly-Clark delivers consistent profits despite shrinking revenue, showcasing operational discipline. Coty’s higher gross margin fails to translate into net profits, undermined by elevated expenses. Kimberly-Clark’s profile suits investors favoring stable, margin-driven earnings. Coty’s riskier path appeals less to those seeking durable profitability.
Financial Ratios Comparison
These vital ratios act as a diagnostic tool to expose the underlying fiscal health, valuation premiums, and capital efficiency of the companies compared:
| Ratios | Kimberly-Clark Corporation (KMB) | Coty Inc. (COTY) |
|---|---|---|
| ROE | 3.03% (2024) | -9.98% (2025) |
| ROIC | 25.33% (2024) | 2.55% (2025) |
| P/E | 17.35 (2024) | -11.02 (2025) |
| P/B | 52.57 (2024) | 1.10 (2025) |
| Current Ratio | 0.80 (2024) | 0.77 (2025) |
| Quick Ratio | 0.54 (2024) | 0.46 (2025) |
| D/E | 9.42 (2024) | 1.15 (2025) |
| Debt-to-Assets | 47.8% (2024) | 35.7% (2025) |
| Interest Coverage | 11.89 (2024) | 1.06 (2025) |
| Asset Turnover | 1.21 (2024) | 0.49 (2025) |
| Fixed Asset Turnover | 2.67 (2024) | 6.04 (2025) |
| Payout Ratio | 64.0% (2024) | -3.62% (2025) |
| Dividend Yield | 3.69% (2024) | 0.33% (2025) |
| Fiscal Year | 2024 | 2025 |
Efficiency & Valuation Duel: The Vital Signs
Financial ratios serve as a company’s DNA, exposing hidden risks and operational strengths critical for investment decisions.
Kimberly-Clark Corporation
Kimberly-Clark reports a favorable 11.74% net margin but an unfavorable zero ROE and ROIC, signaling weak profitability from equity and invested capital. The P/E of 16.63 suggests a neutral valuation. The 4.94% dividend yield rewards shareholders steadily, reflecting a balanced capital allocation despite some liquidity concerns.
Coty Inc.
Coty suffers from a negative net margin (-6.24%) and ROE (-9.98%), highlighting operational challenges and shareholder value erosion. Its negative P/E indicates losses, though a low P/B of 1.1 and WACC at 5.61% are favorable. Coty’s minimal 0.33% dividend yield and high leverage underscore riskier financial footing and restrained returns.
Premium Valuation vs. Operational Safety
Kimberly-Clark balances moderate valuation with healthier profitability and a robust dividend, offering a more stable risk-reward profile. Coty’s distressed profitability and high debt elevate risk, despite some favorable cost of capital metrics. Investors seeking income and operational steadiness may prefer Kimberly-Clark’s profile.
Which one offers the Superior Shareholder Reward?
I find Kimberly-Clark (KMB) offers superior shareholder reward compared to Coty (COTY) in 2026. KMB yields 4.9% dividends with a sustainable 82% payout, backed by strong free cash flow (FCF) coverage above 1.6x. Its aggressive buyback program further boosts total returns. Coty pays negligible dividends (0.3% yield) with an inconsistent payout and weak profitability. Coty reinvests heavily in growth but suffers from negative net margins and lower FCF conversion. KMB’s balanced distribution—high yield plus share repurchases—delivers a more reliable and attractive total return profile. I favor KMB for long-term investors seeking steady income and capital appreciation.
Comparative Score Analysis: The Strategic Profile
The radar chart reveals the fundamental DNA and trade-offs of Kimberly-Clark Corporation and Coty Inc., highlighting their distinctive financial strengths and weaknesses:

Kimberly-Clark shows a balanced profile with top scores in DCF, ROE, and ROA, indicating efficient capital allocation and asset use. Coty relies heavily on its discounted cash flow score but suffers from weak profitability and financial leverage metrics. Kimberly-Clark’s moderate valuation scores contrast with Coty’s undervalued book price, suggesting differing market perceptions.
Bankruptcy Risk: Solvency Showdown
The Altman Z-Score delta highlights Kimberly-Clark’s safer financial footing in the current cycle compared to Coty’s distress zone risk profile:
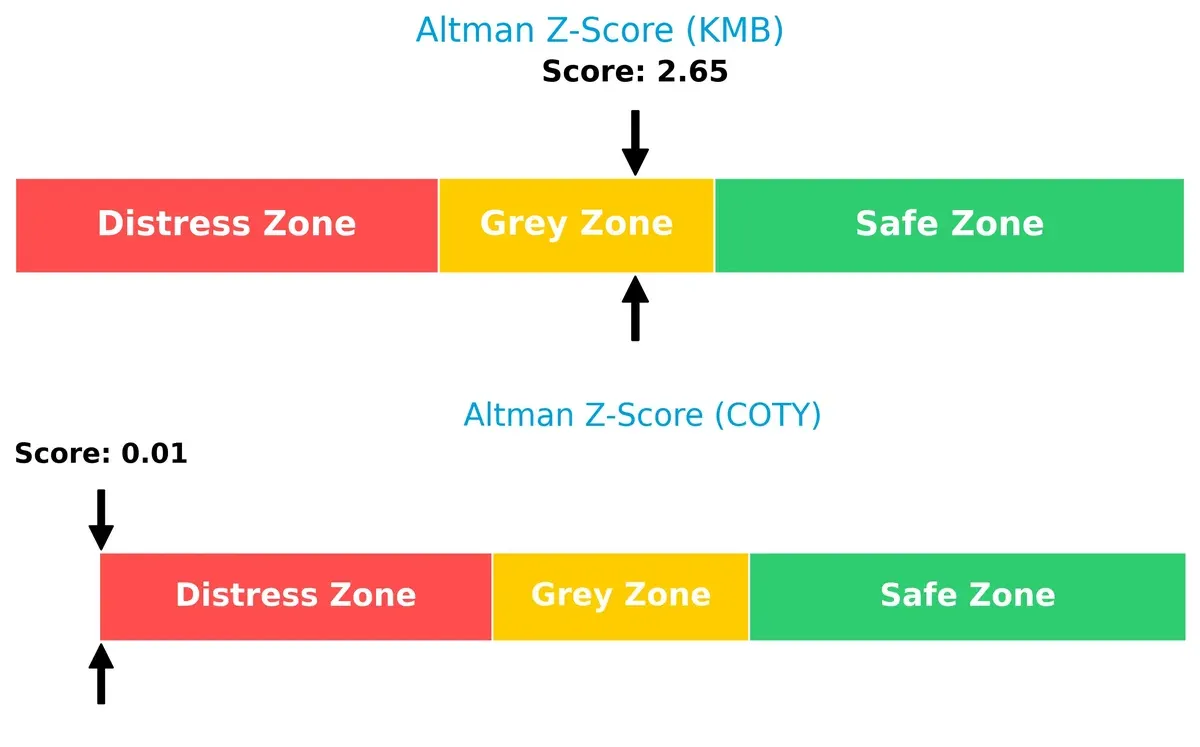
Kimberly-Clark’s score of 2.65 places it in the grey zone, signaling moderate bankruptcy risk but relative stability. Coty’s near-zero score signals severe financial distress and heightened bankruptcy probability, a critical red flag for long-term investors.
Financial Health: Quality of Operations
Kimberly-Clark’s Piotroski F-Score of 7 signals strong financial health, outperforming Coty’s average score of 4, which raises caution on operational efficiency and balance sheet quality:
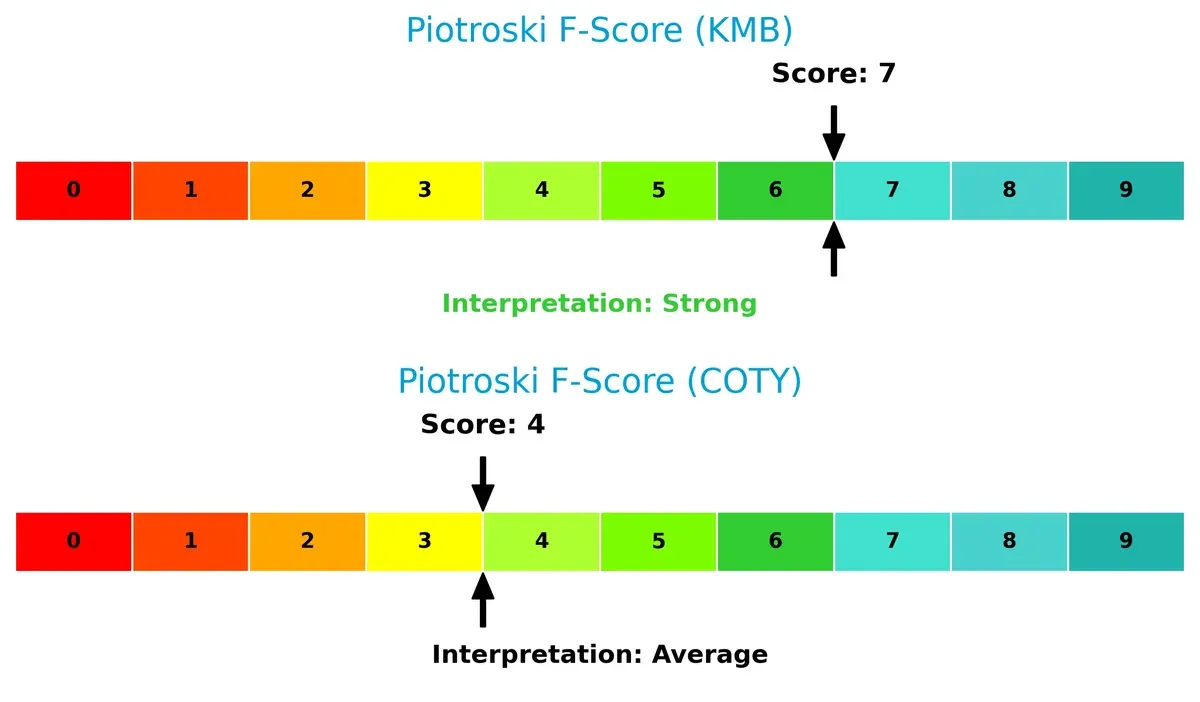
Kimberly-Clark demonstrates robust internal metrics and profitability. Coty’s lower score reveals potential red flags in earnings quality and financial leverage, underscoring the need for careful risk assessment before investing.
How are the two companies positioned?
This section dissects KMB and COTY’s operational DNA by comparing revenue distribution and internal dynamics. The goal is to confront their economic moats and identify which model offers the most resilient competitive advantage today.
Revenue Segmentation: The Strategic Mix
The following visual comparison dissects how Kimberly-Clark Corporation and Coty Inc. diversify their income streams and where their primary sector bets lie:

Kimberly-Clark anchors its revenue in Personal Care, generating over $10B in 2023, complemented by Consumer Tissue and K-C Professional segments. Coty relies mainly on two segments: Prestige at $3.8B and Consumer Beauty at $2.1B in 2024. Kimberly-Clark’s broader mix reduces concentration risk, while Coty’s focus on prestige beauty brands signals heavy reliance on brand-driven consumer demand and potential vulnerability to market shifts.
Strengths and Weaknesses Comparison
This table compares the Strengths and Weaknesses of Kimberly-Clark Corporation and Coty Inc.:
Kimberly-Clark Corporation Strengths
- Diversified revenue streams including Consumer Tissue, Professional, and Personal Care segments
- Favorable net margin of 11.74%
- Strong interest coverage ratio at 9.73
- Dividend yield of 4.94%
Coty Inc. Strengths
- Presence in Consumer Beauty, Prestige, and Luxury segments
- Favorable WACC of 5.61%
- Solid fixed asset turnover at 6.04
- Favorable price-to-book ratio of 1.1
Kimberly-Clark Corporation Weaknesses
- Unfavorable ROE and ROIC at 0%
- Poor liquidity indicated by zero current and quick ratios
- Unfavorable asset and fixed asset turnover
- Neutral P/E ratio at 16.63
Coty Inc. Weaknesses
- Negative net margin (-6.24%) and ROE (-9.98%)
- Unfavorable debt-to-equity ratio of 1.15
- Low current (0.77) and quick ratios (0.46)
- Low dividend yield at 0.33%
Both companies display diverse product segments, but Kimberly-Clark shows stronger profitability and liquidity ratios. Coty faces challenges in profitability and leverage, affecting its financial stability.
The Moat Duel: Analyzing Competitive Defensibility
A structural moat shields long-term profits from competitive erosion. Only companies with durable moats sustain value creation in volatile markets:
Kimberly-Clark Corporation: Intangible Assets Fortress
Kimberly-Clark’s moat stems from iconic brands and stable margins, reflected in 35.6% gross margin and 11.7% net margin. Despite revenue declines in 2025, brand loyalty supports enduring pricing power. New product innovation in personal care could deepen its moat but requires vigilance amid shifting consumer preferences.
Coty Inc.: Brand Portfolio and Innovation Edge
Coty’s competitive edge lies in a diverse prestige brand portfolio, unlike Kimberly-Clark’s consumer staples focus. With a high gross margin of 64.8%, Coty shows improving ROIC trends despite current value destruction. Expansion in emerging markets and digital channels offers growth pathways, though margin pressure and cash flow risks persist.
Legacy Brands vs. Innovation-Driven Growth
Kimberly-Clark boasts a deeper moat through established brand equity and consistent profitability. Coty’s growing ROIC signals potential but its negative value creation flags structural risks. Kimberly-Clark remains better equipped to defend market share amid evolving consumer landscapes.
Which stock offers better returns?
The past year showed distinct bearish trends for both Kimberly-Clark and Coty, with Kimberly-Clark’s decline decelerating while Coty’s loss accelerated sharply.
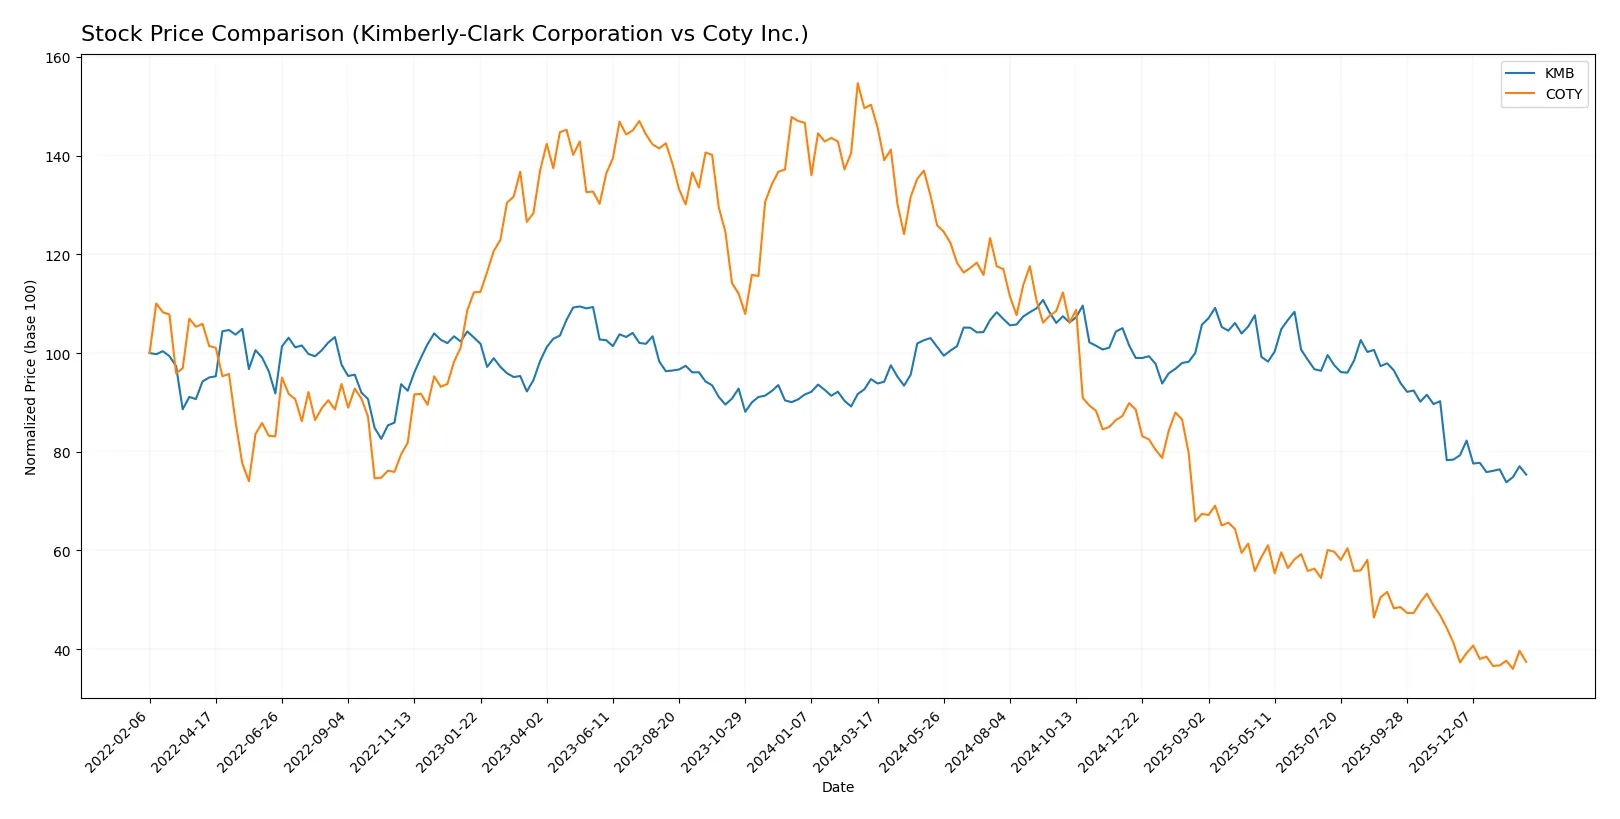
Trend Comparison
Kimberly-Clark’s stock fell 20.42% over the last 12 months, marking a bearish trend with decelerating losses and notable volatility (std dev 12.48). The price ranged between 146.91 and 97.92.
Coty’s stock plunged 75.1% in the same period, an accelerating bearish trend with lower volatility (std dev 2.74). Its price fluctuated between 12.73 and 3.05, indicating deeper market distress.
Comparing trends, Kimberly-Clark outperformed Coty, delivering a smaller decline and showing signs of loss deceleration versus Coty’s sharp accelerating downtrend.
Target Prices
Analysts present a cautious but optimistic consensus on Kimberly-Clark Corporation and Coty Inc.
| Company | Target Low | Target High | Consensus |
|---|---|---|---|
| Kimberly-Clark Corporation | 102 | 162 | 122.38 |
| Coty Inc. | 3 | 10 | 4.83 |
The consensus target for Kimberly-Clark exceeds its current price of 99.99, signaling upside potential. Coty’s target consensus of 4.83 suggests moderate appreciation from the current 3.17 price.

Don’t Let Luck Decide Your Entry Point
Optimize your entry points with our advanced ProRealTime indicators. You’ll get efficient buy signals with precise price targets for maximum performance. Start outperforming now!
How do institutions grade them?
Kimberly-Clark Corporation Grades
Here are the recent grades from reputable financial institutions for Kimberly-Clark:
| Grading Company | Action | New Grade | Date |
|---|---|---|---|
| UBS | maintain | Neutral | 2026-01-28 |
| Citigroup | maintain | Sell | 2026-01-14 |
| UBS | maintain | Neutral | 2026-01-14 |
| TD Cowen | maintain | Hold | 2026-01-08 |
| Wells Fargo | maintain | Equal Weight | 2026-01-05 |
| Citigroup | maintain | Sell | 2025-12-17 |
| BNP Paribas Exane | maintain | Neutral | 2025-12-01 |
| Argus Research | upgrade | Buy | 2025-11-13 |
| Wells Fargo | maintain | Equal Weight | 2025-11-04 |
| Evercore ISI Group | downgrade | In Line | 2025-11-04 |
Coty Inc. Grades
Below are the recent grades from recognized grading firms for Coty Inc.:
| Grading Company | Action | New Grade | Date |
|---|---|---|---|
| TD Cowen | maintain | Hold | 2026-01-21 |
| Evercore ISI Group | downgrade | In Line | 2025-12-23 |
| Citigroup | maintain | Neutral | 2025-12-17 |
| TD Cowen | maintain | Hold | 2025-12-12 |
| Berenberg | downgrade | Hold | 2025-09-10 |
| Morgan Stanley | maintain | Equal Weight | 2025-08-25 |
| RBC Capital | maintain | Outperform | 2025-08-22 |
| Wells Fargo | maintain | Equal Weight | 2025-08-22 |
| Barclays | maintain | Underweight | 2025-08-22 |
| B of A Securities | maintain | Underperform | 2025-08-22 |
Which company has the best grades?
Kimberly-Clark holds a mix of Neutral, Hold, and Sell ratings with one Buy upgrade. Coty mostly receives Hold and Equal Weight ratings, with more downgrades and Underweight opinions. Kimberly-Clark’s slightly stronger Buy signals may offer cautious optimism, but investors should weigh the overall Neutral to Sell trend.
Risks specific to each company
The following categories identify the critical pressure points and systemic threats facing Kimberly-Clark Corporation and Coty Inc. in the 2026 market environment:
1. Market & Competition
Kimberly-Clark Corporation
- Dominates personal care and tissue markets with strong brand portfolio and stable demand.
Coty Inc.
- Faces intense competition in beauty sector; struggles with profitability and market share loss.
2. Capital Structure & Debt
Kimberly-Clark Corporation
- Maintains favorable debt-to-equity and strong interest coverage, signaling financial stability.
Coty Inc.
- High debt-to-equity (1.15) and weak interest coverage (2.33) increase financial risk.
3. Stock Volatility
Kimberly-Clark Corporation
- Low beta (0.276) shows limited volatility; attracts risk-averse investors.
Coty Inc.
- Higher beta (0.958) indicates greater stock price volatility and market sensitivity.
4. Regulatory & Legal
Kimberly-Clark Corporation
- Faces standard consumer product regulations with predictable compliance costs.
Coty Inc.
- Subject to regulatory scrutiny in multiple jurisdictions due to global beauty product sales.
5. Supply Chain & Operations
Kimberly-Clark Corporation
- Benefits from diversified supply chain and strong operational controls.
Coty Inc.
- Vulnerable to supply disruptions and operational inefficiencies impacting margins.
6. ESG & Climate Transition
Kimberly-Clark Corporation
- Increasing ESG initiatives support brand reputation and regulatory alignment.
Coty Inc.
- ESG efforts lag behind peers, posing reputational and compliance risks.
7. Geopolitical Exposure
Kimberly-Clark Corporation
- Moderate exposure with stable US base and global distribution.
Coty Inc.
- Greater geopolitical risk due to wider global footprint and emerging market reliance.
Which company shows a better risk-adjusted profile?
Kimberly-Clark’s strongest risk is operational efficiency amid low liquidity ratios but benefits from superior financial stability and low stock volatility. Coty’s high leverage and weak profitability expose it to financial distress, highlighted by its Altman Z-score in the distress zone. Kimberly-Clark’s balanced risk and strong dividend yield position it as the safer investment. Recent data confirm Coty’s struggle with debt servicing and operational setbacks, underpinning my caution.
Final Verdict: Which stock to choose?
Kimberly-Clark’s superpower lies in its resilient cash generation and solid dividend yield, making it a dependable income engine. A point of vigilance is its declining revenue trend, which could pressure future growth. It fits well in income-focused or defensive portfolios aiming for steady returns.
Coty’s strategic moat is its high gross margin and improving ROIC trend, signaling operational improvements despite current profitability challenges. Compared to Kimberly-Clark, Coty carries higher financial risk but offers a turnaround potential. It suits investors seeking contrarian plays with a value-growth blend.
If you prioritize stable cash flow and dividend income, Kimberly-Clark is the compelling choice due to its consistent cash generation and strong income profile. However, if you seek a higher-risk, high-reward scenario with improving operational efficiency, Coty offers better upside potential despite ongoing volatility. Both require cautious risk management given their sector headwinds.
Disclaimer: Investment carries a risk of loss of initial capital. The past performance is not a reliable indicator of future results. Be sure to understand risks before making an investment decision.
Go Further
I encourage you to read the complete analyses of Kimberly-Clark Corporation and Coty Inc. to enhance your investment decisions: