Kenvue Inc. and Coty Inc. are two prominent players in the household and personal products industry, each carving distinct paths in health and beauty markets. Kenvue focuses on consumer health with trusted brands in self-care and skin health, while Coty thrives in prestige and mass beauty products worldwide. This comparison highlights their market approaches and innovation strategies to help you identify the most compelling investment opportunity today. Let’s explore which company deserves a place in your portfolio.
Table of contents
Companies Overview
I will begin the comparison between Kenvue and Coty by providing an overview of these two companies and their main differences.
Kenvue Overview
Kenvue Inc. operates globally in consumer health, focusing on three segments: Self Care, Skin Health and Beauty, and Essential Health. Its portfolio includes well-known brands such as Tylenol, Neutrogena, and Band-Aid. Incorporated in 2022, Kenvue is a subsidiary of Johnson & Johnson, positioning itself as a key player in household and personal products with a market cap of 32.6B USD.
Coty Overview
Coty Inc. manufactures and markets beauty products worldwide, including prestige fragrances, skin care, and color cosmetics. It owns a diverse brand portfolio featuring Calvin Klein, Gucci, and CoverGirl. Founded in 1904 and based in New York, Coty operates through multiple retail channels and third-party distributors, serving around 150 countries. Coty’s market cap is 2.8B USD, reflecting its established presence in the consumer defensive sector.
Key similarities and differences
Both Kenvue and Coty operate in the household and personal products industry, focusing on health, beauty, and personal care. Kenvue is more recent and operates as a subsidiary of a larger healthcare conglomerate, emphasizing consumer health products, while Coty has a longer history and a broader brand range spanning prestige and mass-market cosmetics. Kenvue’s market cap and employee base significantly exceed Coty’s, highlighting differences in scale and market positioning.
Income Statement Comparison
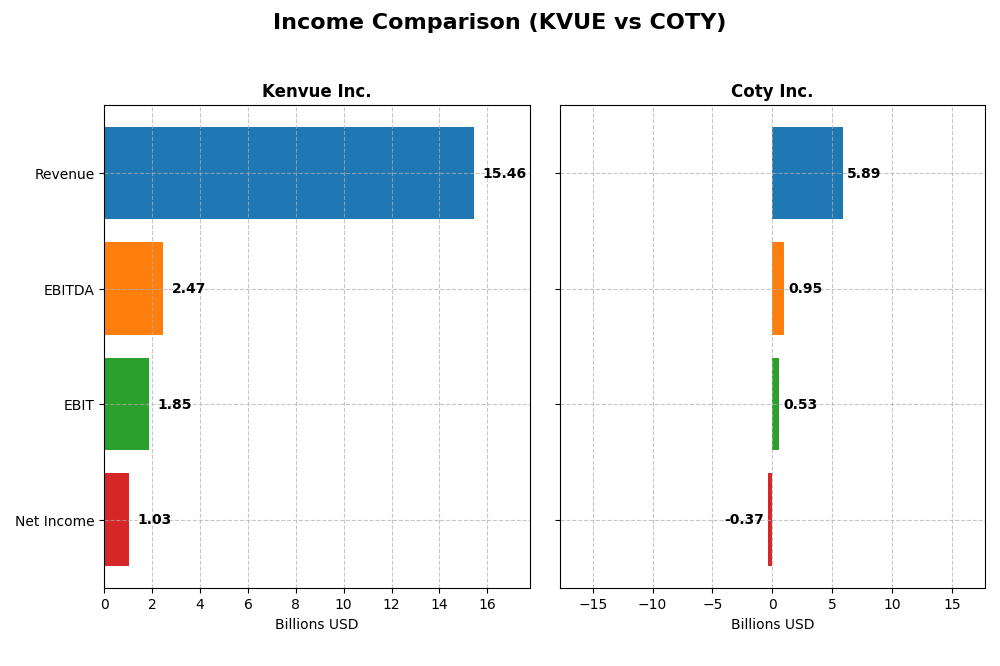
The following table presents a side-by-side comparison of key income statement metrics for Kenvue Inc. and Coty Inc. based on their most recent fiscal year data.
| Metric | Kenvue Inc. (KVUE) | Coty Inc. (COTY) |
|---|---|---|
| Market Cap | 32.6B | 2.79B |
| Revenue | 15.5B | 5.89B |
| EBITDA | 2.47B | 950M |
| EBIT | 1.85B | 530M |
| Net Income | 1.03B | -368M |
| EPS | 0.54 | -0.44 |
| Fiscal Year | 2024 | 2025 |
Income Statement Interpretations
Kenvue Inc.
Kenvue Inc. saw stable revenue growth of 6.83% over 2020-2024, with net income increasing strongly by 217.18%. Margins remained favorable, with a gross margin near 58% and net margin at 6.66%. However, in 2024, revenue growth slowed to 0.07%, and net margin declined by 38.15%, reflecting some pressure on profitability despite solid overall fundamentals.
Coty Inc.
Coty Inc. experienced a favorable revenue growth of 27.28% from 2021 to 2025, yet net income fell sharply by 82.76%, accompanied by a negative net margin of -6.24%. Margins showed mixed signals with a strong gross margin near 65% but only a neutral EBIT margin. The latest year saw declining revenue (-3.68%) and worsening net margin, highlighting recent profitability challenges.
Which one has the stronger fundamentals?
Kenvue presents stronger fundamentals with consistent net income growth and overall favorable margin trends despite recent margin compression. Coty’s strong revenue growth contrasts with significant net income declines and unfavorable margin trends over the period. The income statement evaluation rates Kenvue as favorable and Coty as unfavorable, indicating more robust earnings quality for Kenvue.
Financial Ratios Comparison
The table below presents key financial ratios for Kenvue Inc. and Coty Inc. based on their most recent fiscal year data, providing a concise comparison for investors.
| Ratios | Kenvue Inc. (2024) | Coty Inc. (2025) |
|---|---|---|
| ROE | 10.7% | -9.98% |
| ROIC | 6.25% | 2.55% |
| P/E | 39.4 | -11.0 |
| P/B | 4.20 | 1.10 |
| Current Ratio | 0.96 | 0.77 |
| Quick Ratio | 0.69 | 0.46 |
| D/E (Debt-to-Equity) | 0.90 | 1.15 |
| Debt-to-Assets | 34.1% | 35.7% |
| Interest Coverage | 4.27 | 1.06 |
| Asset Turnover | 0.60 | 0.49 |
| Fixed Asset Turnover | 8.36 | 6.04 |
| Payout Ratio | 151% | -3.6% |
| Dividend Yield | 3.83% | 0.33% |
Interpretation of the Ratios
Kenvue Inc.
Kenvue’s financial ratios present a mixed picture with a slightly unfavorable overall assessment. While the company benefits from a favorable weighted average cost of capital (WACC) and strong fixed asset turnover, it faces challenges with high price-to-earnings (PE) and price-to-book (PB) ratios, and weak liquidity ratios. Its dividend yield is favorable at 3.83%, indicating consistent shareholder returns supported by dividend payments.
Coty Inc.
Coty’s ratios are generally unfavorable, reflecting operational and profitability difficulties. Negative net margin and return on equity highlight ongoing losses, while liquidity ratios remain weak. Although the company shows favorable PE and PB ratios, its dividend yield is very low at 0.33%, and it does not currently pay dividends, likely prioritizing reinvestment and debt management over distributions to shareholders.
Which one has the best ratios?
Comparing both, Kenvue offers a more balanced and slightly unfavorable ratio profile with positive dividend yield and solid asset turnover, despite valuation and liquidity concerns. Coty exhibits a more unfavorable stance with persistent losses, weaker returns, and minimal shareholder returns, suggesting Kenvue holds relatively stronger financial ratios.
Strategic Positioning
This section compares the strategic positioning of Kenvue Inc. and Coty Inc., including market position, key segments, and exposure to technological disruption:
Kenvue Inc.
- Large market cap (32.6B), operating in consumer health with moderate competitive pressure.
- Diversified segments: Self Care, Skin Health and Beauty, Essential Health driving revenues.
- No explicit mention of exposure to technological disruption in consumer health fields.
Coty Inc.
- Smaller market cap (2.8B), focused on beauty products facing competitive pressure.
- Concentrated in prestige and consumer beauty segments, with wide brand portfolio.
- No explicit mention of exposure to technological disruption in beauty product segments.
Kenvue Inc. vs Coty Inc. Positioning
Kenvue adopts a diversified strategy across health and beauty segments, while Coty concentrates on prestige and consumer beauty products. Kenvue’s broader portfolio may offer stability; Coty’s focus targets niche markets but may face higher volatility.
Which has the best competitive advantage?
Kenvue shows slightly favorable moat status with growing profitability but still shedding value. Coty is shedding value with a slightly unfavorable moat despite improving profitability, indicating Kenvue currently has a marginally stronger competitive advantage.
Stock Comparison
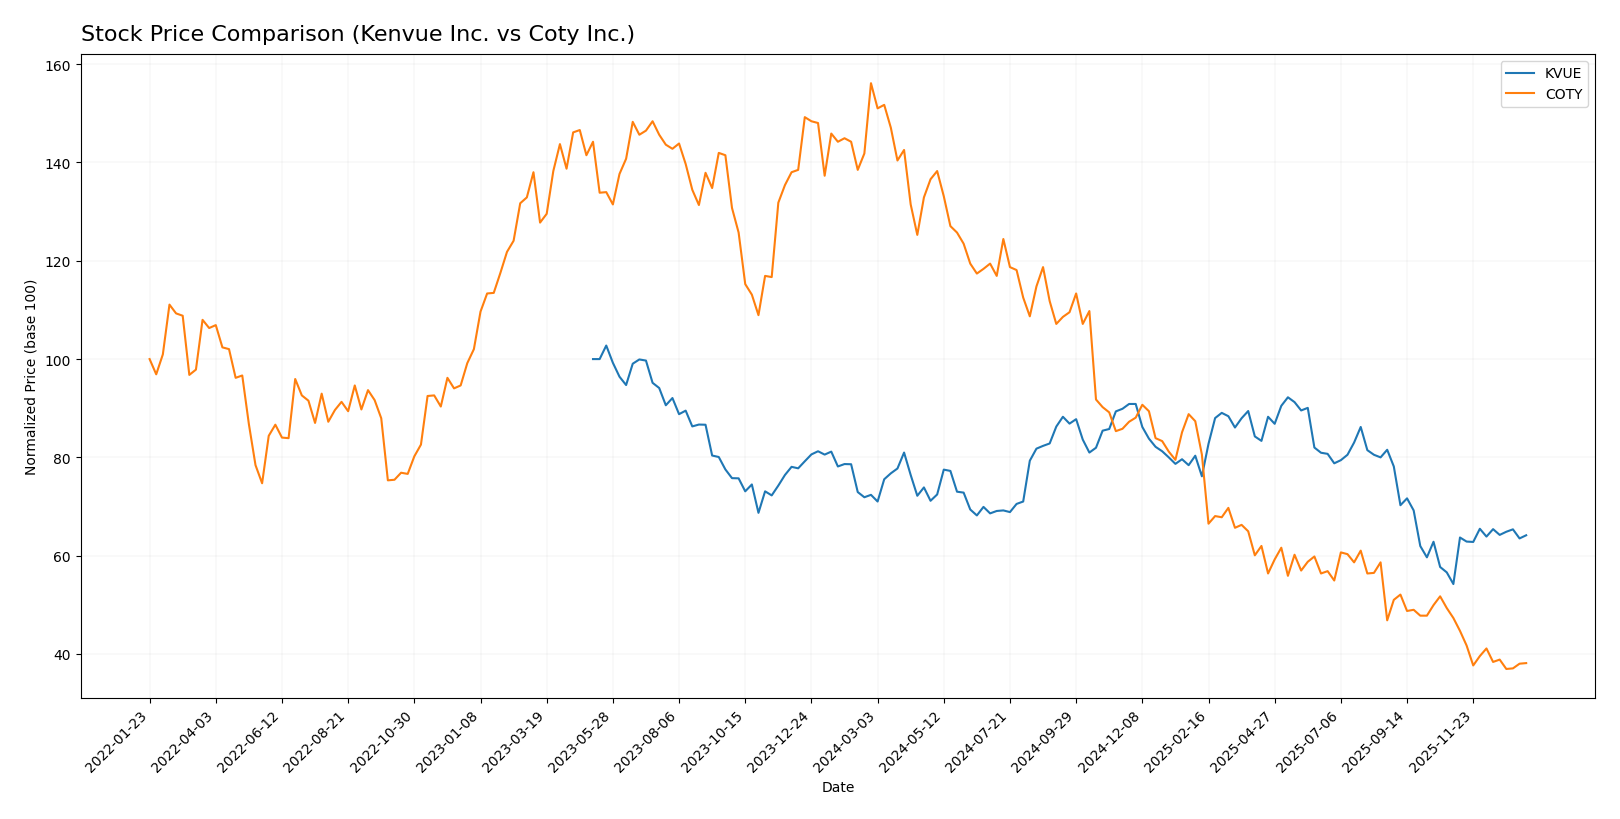
The past year revealed contrasting stock movements for Kenvue Inc. and Coty Inc., with both experiencing bearish trends but differing in volatility and recent trading dynamics.
Trend Analysis
Kenvue Inc. (KVUE) shows a bearish trend with an 11.37% price decline over the past 12 months, marked by accelerating downward momentum and a notable price range from 14.37 to 24.44. Recent months indicate a bullish reversal with an 18.3% price increase.
Coty Inc. (COTY) experienced a more pronounced bearish trend, declining 75.57% over the same period with accelerating losses and a wider price range between 3.1 and 13.1. The recent trend remains bearish, falling an additional 19.4%.
Comparatively, Kenvue’s stock delivered a significantly stronger market performance than Coty’s, showing less severe losses and a recent upward correction, while Coty’s stock faced steeper declines and continued weakness.
Target Prices
The latest analyst consensus provides a clear outlook on target prices for Kenvue Inc. and Coty Inc.
| Company | Target High | Target Low | Consensus |
|---|---|---|---|
| Kenvue Inc. | 23 | 15 | 18.57 |
| Coty Inc. | 10 | 3.5 | 4.95 |
Analysts expect Kenvue’s stock to trade moderately above its current price of 17 USD, indicating potential upside. Coty’s consensus target of 4.95 USD suggests limited upside from its current 3.2 USD price, reflecting cautious market sentiment.
Analyst Opinions Comparison
This section compares analysts’ ratings and financial grades for Kenvue Inc. and Coty Inc.:
Rating Comparison
Kenvue Inc. Rating
- Rating: B+, considered very favorable by analysts
- Discounted Cash Flow Score: 4, favorable valuation
- ROE Score: 4, favorable efficiency in equity use
- ROA Score: 4, favorable asset utilization
- Debt To Equity Score: 2, moderate financial risk
- Overall Score: 3, moderate financial standing
Coty Inc. Rating
- Rating: C+, also rated very favorable
- Discounted Cash Flow Score: 5, very favorable
- ROE Score: 1, very unfavorable efficiency
- ROA Score: 1, very unfavorable asset utilization
- Debt To Equity Score: 1, very unfavorable risk
- Overall Score: 2, moderate financial standing
Which one is the best rated?
Based strictly on the data, Kenvue Inc. holds a higher overall rating (B+) and stronger scores in ROE, ROA, and debt-to-equity, while Coty excels only in discounted cash flow valuation but scores poorly in other key metrics.
Scores Comparison
Below is a comparison of the financial health scores for Kenvue and Coty:
Kenvue Scores
- Altman Z-Score: 1.95, in the grey zone indicating moderate bankruptcy risk.
- Piotroski Score: 5, reflecting average financial strength.
Coty Scores
- Altman Z-Score: 0.01, in the distress zone showing high bankruptcy risk.
- Piotroski Score: 4, reflecting average financial strength.
Which company has the best scores?
Kenvue’s Altman Z-Score places it in the grey zone, indicating moderate risk, while Coty is in distress with a much lower score. Both companies have average Piotroski Scores, but Kenvue’s Altman Z-Score suggests relatively better financial stability.
Grades Comparison
Here is a detailed comparison of the latest grades assigned to Kenvue Inc. and Coty Inc. by reputable grading companies:
Kenvue Inc. Grades
The following table summarizes recent grades assigned to Kenvue Inc. by major financial institutions:
| Grading Company | Action | New Grade | Date |
|---|---|---|---|
| Barclays | maintain | Equal Weight | 2025-11-10 |
| Canaccord Genuity | downgrade | Hold | 2025-10-29 |
| Jefferies | maintain | Buy | 2025-10-27 |
| JP Morgan | maintain | Overweight | 2025-10-10 |
| Citigroup | maintain | Neutral | 2025-10-09 |
| B of A Securities | maintain | Buy | 2025-10-08 |
| UBS | maintain | Neutral | 2025-10-08 |
| Goldman Sachs | maintain | Neutral | 2025-10-02 |
| Barclays | maintain | Equal Weight | 2025-10-01 |
| Rothschild & Co | upgrade | Buy | 2025-09-26 |
Overall, Kenvue’s grades show a balanced mix of Buy, Hold, and Neutral ratings, with no recent downgrades below Hold, indicating a relatively stable outlook.
Coty Inc. Grades
The following table summarizes recent grades assigned to Coty Inc. by major financial institutions:
| Grading Company | Action | New Grade | Date |
|---|---|---|---|
| Evercore ISI Group | downgrade | In Line | 2025-12-23 |
| Citigroup | maintain | Neutral | 2025-12-17 |
| TD Cowen | maintain | Hold | 2025-12-12 |
| Berenberg | downgrade | Hold | 2025-09-10 |
| Morgan Stanley | maintain | Equal Weight | 2025-08-25 |
| RBC Capital | maintain | Outperform | 2025-08-22 |
| Wells Fargo | maintain | Equal Weight | 2025-08-22 |
| Goldman Sachs | maintain | Neutral | 2025-08-22 |
| Barclays | maintain | Underweight | 2025-08-22 |
| B of A Securities | maintain | Underperform | 2025-08-22 |
Coty’s grades reflect a wider range of ratings, including some downgrades and underperform designations, suggesting a more cautious or negative view by certain analysts.
Which company has the best grades?
Kenvue Inc. has generally received better grades than Coty Inc., with multiple Buy and Overweight ratings compared to Coty’s mix of Hold, Neutral, and several Underperform or Underweight grades. This difference may influence investors’ perceptions of relative stability and growth potential.
Strengths and Weaknesses
Below is a comparison of Kenvue Inc. (KVUE) and Coty Inc. (COTY) across key criteria reflecting their current market and financial standing as of 2026.
| Criterion | Kenvue Inc. (KVUE) | Coty Inc. (COTY) |
|---|---|---|
| Diversification | Strong diversification with three main segments: Essential Health (4.69B), Self Care (6.53B), and Skin Health and Beauty (4.24B) | Moderate diversification mainly in Consumer Beauty (2.07B) and Prestige (3.82B) segments |
| Profitability | Neutral profitability with a net margin of 6.66%, ROIC 6.25%, and ROE 10.65% | Unfavorable profitability: negative net margin (-6.24%), ROIC 2.55%, and ROE (-9.98%) |
| Innovation | Slightly favorable with growing ROIC trend (261%) but no strong moat | Slightly unfavorable due to value destruction but improving ROIC trend (2220%) indicating ongoing turnaround efforts |
| Global presence | Strong global footprint supported by diversified product lines in health and beauty | Global presence focused on beauty segments but shrinking revenues in some categories |
| Market Share | Solid market presence in health and self-care sectors with stable revenue growth | Declining market share in consumer beauty, reflected in revenue decreases since 2019 |
Key takeaways: Kenvue shows a more balanced and diversified portfolio with stable profitability and improving returns on capital, suggesting moderate investment appeal. Coty faces profitability challenges and higher financial risk despite signs of operational improvement, warranting cautious consideration.
Risk Analysis
Below is a comparative table of key risks for Kenvue Inc. (KVUE) and Coty Inc. (COTY) based on the most recent fiscal data:
| Metric | Kenvue Inc. (KVUE) | Coty Inc. (COTY) |
|---|---|---|
| Market Risk | Moderate beta of 0.55, lower volatility than market | Higher beta of 0.96, more sensitive to market swings |
| Debt level | Debt-to-equity 0.9 (neutral), interest coverage 4.28 | Debt-to-equity 1.15 (unfavorable), interest coverage 2.33 |
| Regulatory Risk | Moderate, consumer health products face regulatory oversight | High, cosmetics industry subject to evolving regulations globally |
| Operational Risk | Diversified product segments, solid operational metrics | Operational challenges with lower asset turnover and margins |
| Environmental Risk | Exposure to sustainability pressures in personal care | Similar exposure, with increasing demand for eco-friendly products |
| Geopolitical Risk | Moderate, global supply chain exposure | Moderate, sells in 150 countries with potential geopolitical disruptions |
The most impactful and likely risks are Coty’s elevated financial leverage and negative profitability, increasing its vulnerability to market downturns and operational disruptions. Kenvue’s moderate debt and stable market profile present lower immediate risk but require monitoring of regulatory and environmental compliance.
Which Stock to Choose?
Kenvue Inc. (KVUE) shows a generally favorable income statement with a 6.66% net margin and positive overall income growth despite some recent declines. Financial ratios are slightly unfavorable overall, with a neutral debt profile and a very favorable B+ rating. The company’s ROIC is growing but still below WACC, indicating slight value shedding but improving profitability.
Coty Inc. (COTY) has an unfavorable income statement marked by negative net margin and declining earnings, despite favorable valuation ratios like P/E and P/B. Its financial ratios are mostly unfavorable, with a weaker debt situation and a C+ rating. The company’s ROIC trend is improving, yet it remains below WACC, signaling ongoing value destruction despite some profitability gains.
Investors focused on stability and improving profitability might find Kenvue’s profile more appealing due to its favorable income and rating, while those with a tolerance for higher risk and interest in potential turnaround scenarios could consider Coty, given its improving ROIC trend but weaker current financial standing.
Disclaimer: Investment carries a risk of loss of initial capital. The past performance is not a reliable indicator of future results. Be sure to understand risks before making an investment decision.
Go Further
I encourage you to read the complete analyses of Kenvue Inc. and Coty Inc. to enhance your investment decisions: