In the competitive world of beauty and personal care, e.l.f. Beauty, Inc. (ELF) and Coty Inc. (COTY) stand out as influential players shaping industry trends. Both companies compete in the household and personal products sector, leveraging innovation and diverse brand portfolios to capture market share globally. This comparison will explore their strategies, market positions, and growth potential to help you identify which stock could be the smarter addition to your investment portfolio.
Table of contents
Companies Overview
I will begin the comparison between e.l.f. Beauty and Coty by providing an overview of these two companies and their main differences.
e.l.f. Beauty Overview
e.l.f. Beauty, Inc. operates in the Household & Personal Products sector, offering cosmetic and skin care products under brands like e.l.f. Cosmetics and Keys Soulcare. Founded in 2004 and headquartered in Oakland, California, the company sells through national and international retailers and direct-to-consumer channels, including e-commerce platforms. e.l.f. Beauty had a market cap of 4.9B USD in 2026.
Coty Overview
Coty Inc., based in New York City and founded in 1904, manufactures and markets beauty products globally. It provides prestige and mass-market fragrances, skin care, and cosmetics through various retail outlets and e-commerce. Coty operates under numerous brands, reaching around 150 countries via third-party distributors. The company’s market cap stood at 2.8B USD in 2026.
Key similarities and differences
Both companies operate in the consumer defensive sector focusing on beauty and personal care products, distributing globally through retailers and e-commerce. e.l.f. Beauty emphasizes direct-to-consumer sales alongside retail, while Coty has a broader portfolio with prestigious and mass-market brands and a larger global reach. Coty employs significantly more people, reflecting its scale compared to e.l.f. Beauty.
Income Statement Comparison
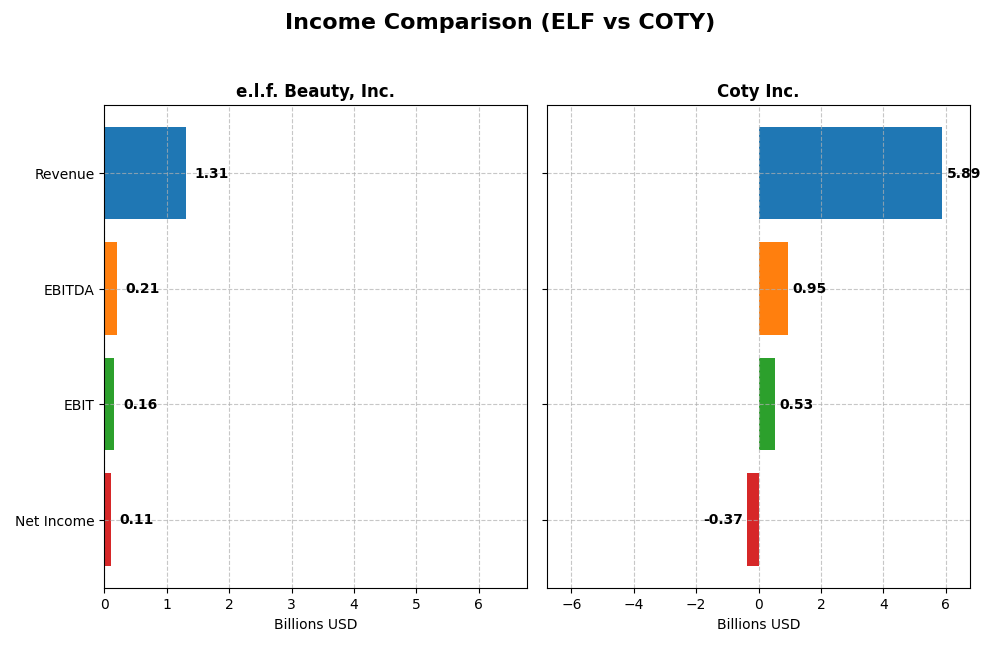
This table presents a side-by-side comparison of the latest fiscal year income statement metrics for e.l.f. Beauty, Inc. and Coty Inc., highlighting key financial performance indicators.
| Metric | e.l.f. Beauty, Inc. | Coty Inc. |
|---|---|---|
| Market Cap | 4.92B | 2.79B |
| Revenue | 1.31B | 5.89B |
| EBITDA | 206M | 950M |
| EBIT | 162M | 530M |
| Net Income | 112M | -368M |
| EPS | 1.99 | -0.44 |
| Fiscal Year | 2025 | 2025 |
Income Statement Interpretations
e.l.f. Beauty, Inc.
e.l.f. Beauty, Inc. has demonstrated robust growth in revenue and net income from 2021 to 2025, with revenue surging over 300% and net income increasing by nearly 1700%. Margins have generally improved, highlighted by a gross margin of 71.24% and an EBIT margin of 12.34% in 2025. However, despite strong top-line growth, net margin and EPS declined in the most recent year, signaling some pressure on profitability.
Coty Inc.
Coty Inc. has experienced modest revenue growth of 27.28% over the 2021-2025 period but suffered a significant decline in net income by over 80%. The company’s gross margin remains healthy at 64.84%, yet its EBIT margin is neutral and net margin negative at -6.24%. The latest fiscal year saw decreases in revenue, gross profit, EBIT, net margin, and EPS, indicating ongoing operational and profitability challenges.
Which one has the stronger fundamentals?
Based on the income statement analysis, e.l.f. Beauty, Inc. exhibits stronger fundamentals with favorable growth in revenue, net income, and margins over the long term, despite some recent margin compression. In contrast, Coty Inc. shows weaker fundamentals due to declining profitability and net income, despite stable gross margins and a larger scale. The overall financial health favors e.l.f. Beauty, with its more consistent positive momentum.
Financial Ratios Comparison
The table below presents a side-by-side comparison of key financial ratios for e.l.f. Beauty, Inc. and Coty Inc. based on their most recent fiscal year data available.
| Ratios | e.l.f. Beauty, Inc. (2025) | Coty Inc. (2025) |
|---|---|---|
| ROE | 14.7% | -10.0% |
| ROIC | 11.2% | 2.6% |
| P/E | 31.5 | -11.0 |
| P/B | 4.64 | 1.10 |
| Current Ratio | 3.05 | 0.77 |
| Quick Ratio | 2.00 | 0.46 |
| D/E (Debt to Equity) | 0.41 | 1.15 |
| Debt-to-Assets | 25.1% | 35.7% |
| Interest Coverage | 9.20 | 1.06 |
| Asset Turnover | 1.05 | 0.49 |
| Fixed Asset Turnover | 45.6 | 6.04 |
| Payout ratio | 0 | -3.6% |
| Dividend yield | 0% | 0.33% |
Interpretation of the Ratios
e.l.f. Beauty, Inc.
e.l.f. Beauty presents a balanced ratio profile with 42.86% favorable and unfavorable ratios each, and 14.29% neutral, leading to a neutral overall view. Strong points include a high quick ratio (2.0), low debt-to-equity (0.41), and solid interest coverage (9.44). However, the company shows concerns with an elevated price-to-earnings (31.49), price-to-book (4.64), and current ratio (3.05). e.l.f. Beauty does not pay dividends, likely prioritizing reinvestment in its brands and operations.
Coty Inc.
Coty’s ratios are generally weak, with 57.14% unfavorable metrics and only 28.57% favorable, resulting in an unfavorable global evaluation. The firm suffers from negative net margin (-6.24%), negative return on equity (-9.98%), and poor liquidity ratios (current 0.77, quick 0.46). Favorable aspects include a low price-to-book (1.1) and weighted average cost of capital (5.62%). Coty does not distribute dividends, possibly due to negative earnings and substantial reinvestment needs.
Which one has the best ratios?
Comparing both, e.l.f. Beauty exhibits a more balanced and generally stronger financial ratio profile, especially in liquidity and leverage measures, despite some valuation concerns. Coty faces significant challenges with profitability, liquidity, and leverage, reflected in a mostly unfavorable ratio assessment. Overall, e.l.f. Beauty has the more robust ratios based on the provided data.
Strategic Positioning
This section compares the strategic positioning of e.l.f. Beauty, Inc. and Coty Inc., focusing on Market position, Key segments, and exposure to technological disruption:
e.l.f. Beauty, Inc.
- Mid-sized market cap of 4.9B with higher beta indicating more volatility and competitive pressure.
- Focuses on cosmetics and skin care products, selling primarily through retailers and direct e-commerce channels.
- No explicit data on technological disruption exposure provided.
Coty Inc.
- Smaller market cap of 2.8B with lower beta, suggesting moderate competitive pressure.
- Diverse segments: prestige fragrances and consumer beauty, with broad global distribution.
- No explicit data on technological disruption exposure provided.
e.l.f. Beauty, Inc. vs Coty Inc. Positioning
e.l.f. Beauty has a more concentrated product focus on cosmetics and skin care with direct consumer sales, while Coty operates a diversified portfolio across prestige and mass-market beauty segments, leveraging extensive global distribution but with higher operational scale.
Which has the best competitive advantage?
Both companies are currently shedding value with ROIC below WACC, yet both show growing ROIC trends. Neither exhibits a strong economic moat; their competitive advantages remain slightly unfavorable based on recent profitability metrics.
Stock Comparison
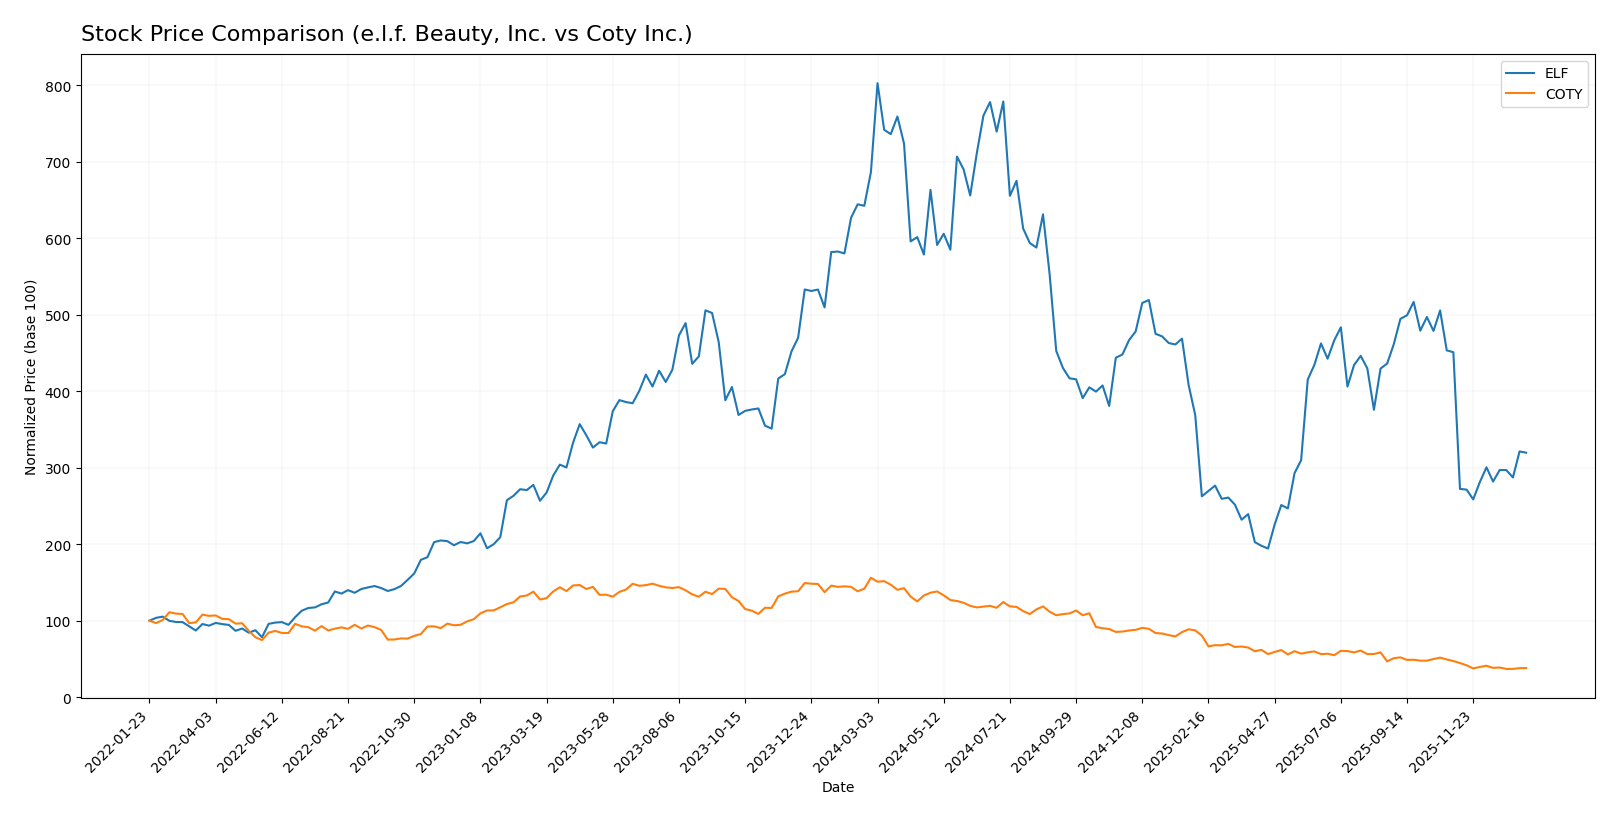
The stock prices of e.l.f. Beauty, Inc. and Coty Inc. have both exhibited significant declines over the past 12 months, with accelerating bearish trends and notable price range fluctuations shaping the trading dynamics.
Trend Analysis
e.l.f. Beauty, Inc. experienced a 53.44% price drop over the last year, indicating a bearish trend with accelerating decline. The stock showed high volatility with a 43.02 std deviation and ranged from 217.4 to 52.65.
Coty Inc. also displayed a bearish trend with a 75.57% decrease over the same period and accelerating downward momentum. Its volatility was low at 2.82 std deviation, with prices between 13.1 and 3.1.
Comparing both, Coty Inc. suffered a steeper decline, underperforming e.l.f. Beauty, Inc., which delivered the higher market performance despite its own significant losses.
Target Prices
Analysts present a clear target price consensus for both e.l.f. Beauty, Inc. and Coty Inc.
| Company | Target High | Target Low | Consensus |
|---|---|---|---|
| e.l.f. Beauty, Inc. | 165 | 85 | 128.17 |
| Coty Inc. | 10 | 3.5 | 4.95 |
For e.l.f. Beauty, the consensus target of 128.17 USD is significantly above the current price of 86.58 USD, indicating optimistic analyst expectations. Coty’s consensus target of 4.95 USD also exceeds its current 3.2 USD price, suggesting moderate upside potential.
Analyst Opinions Comparison
This section compares analysts’ ratings and grades for e.l.f. Beauty, Inc. and Coty Inc.:
Rating Comparison
e.l.f. Beauty, Inc. Rating
- Rating: C+, classified as Very Favorable
- Discounted Cash Flow Score: 3, Moderate
- ROE Score: 3, Moderate
- ROA Score: 3, Moderate
- Debt To Equity Score: 2, Moderate
- Overall Score: 2, Moderate
Coty Inc. Rating
- Rating: C+, classified as Very Favorable
- Discounted Cash Flow Score: 5, Very Favorable
- ROE Score: 1, Very Unfavorable
- ROA Score: 1, Very Unfavorable
- Debt To Equity Score: 1, Very Unfavorable
- Overall Score: 2, Moderate
Which one is the best rated?
Both e.l.f. Beauty and Coty share the same overall rating of C+ and overall score of 2, indicating a moderate assessment. Coty excels in discounted cash flow but scores very low in profitability and financial risk metrics compared to e.l.f. Beauty.
Scores Comparison
Here is a comparison of the financial scores for e.l.f. Beauty, Inc. (ELF) and Coty Inc. (COTY):
ELF Scores
- Altman Z-Score: 3.44, in the safe zone, indicating low bankruptcy risk.
- Piotroski Score: 5, classified as average financial strength.
COTY Scores
- Altman Z-Score: 0.01, in the distress zone, indicating high bankruptcy risk.
- Piotroski Score: 4, classified as average financial strength.
Which company has the best scores?
Based solely on the provided data, ELF has a significantly stronger Altman Z-Score, indicating better financial stability. Both companies have similar average Piotroski Scores, showing comparable financial strength in that metric.
Grades Comparison
Here is a comparison of the latest reliable grades for e.l.f. Beauty, Inc. and Coty Inc.:
e.l.f. Beauty, Inc. Grades
The following table summarizes recent grades assigned by established financial institutions for e.l.f. Beauty, Inc.:
| Grading Company | Action | New Grade | Date |
|---|---|---|---|
| Piper Sandler | Maintain | Neutral | 2025-12-22 |
| JP Morgan | Maintain | Overweight | 2025-12-18 |
| Goldman Sachs | Maintain | Buy | 2025-11-07 |
| Baird | Maintain | Outperform | 2025-11-06 |
| Jefferies | Maintain | Buy | 2025-11-06 |
| Piper Sandler | Downgrade | Neutral | 2025-11-06 |
| UBS | Maintain | Neutral | 2025-11-06 |
| Canaccord Genuity | Maintain | Buy | 2025-11-06 |
| JP Morgan | Maintain | Overweight | 2025-11-06 |
| Jefferies | Maintain | Buy | 2025-10-28 |
Overall, e.l.f. Beauty, Inc. exhibits predominantly positive ratings with multiple “Buy” and “Outperform” grades, alongside some neutral stances and a single recent downgrade.
Coty Inc. Grades
The following table presents recent ratings from recognized grading companies for Coty Inc.:
| Grading Company | Action | New Grade | Date |
|---|---|---|---|
| Evercore ISI Group | Downgrade | In Line | 2025-12-23 |
| Citigroup | Maintain | Neutral | 2025-12-17 |
| TD Cowen | Maintain | Hold | 2025-12-12 |
| Berenberg | Downgrade | Hold | 2025-09-10 |
| Morgan Stanley | Maintain | Equal Weight | 2025-08-25 |
| RBC Capital | Maintain | Outperform | 2025-08-22 |
| Wells Fargo | Maintain | Equal Weight | 2025-08-22 |
| Goldman Sachs | Maintain | Neutral | 2025-08-22 |
| Barclays | Maintain | Underweight | 2025-08-22 |
| B of A Securities | Maintain | Underperform | 2025-08-22 |
Coty Inc.’s ratings indicate a more cautious stance, with a mixture of “Hold,” “Neutral,” “Equal Weight,” and some lower grades such as “Underweight” and “Underperform.”
Which company has the best grades?
e.l.f. Beauty, Inc. has received predominantly positive grades including several “Buy” and “Outperform” ratings, while Coty Inc. shows a more conservative consensus with mostly “Hold” and neutral grades. This difference could influence investors seeking higher conviction from analysts’ endorsements.
Strengths and Weaknesses
Below is a comparison of key strengths and weaknesses for e.l.f. Beauty, Inc. (ELF) and Coty Inc. (COTY) based on the most recent financial and operational data.
| Criterion | e.l.f. Beauty, Inc. (ELF) | Coty Inc. (COTY) |
|---|---|---|
| Diversification | Moderate product range, focus on affordable cosmetics | Broader segment coverage with Consumer Beauty and Prestige segments |
| Profitability | Neutral net margin (8.53%), improving ROIC but slightly below WACC | Negative net margin (-6.24%), ROIC low but improving |
| Innovation | Growing ROIC trend signals improving efficiency | Growing ROIC trend, recovering profitability but still unfavorable |
| Global presence | Strong U.S. presence, less global diversification | Global footprint with strong presence in prestige beauty markets |
| Market Share | Smaller niche market share in affordable cosmetics | Larger market share in multiple beauty segments |
Key takeaways: Both companies are currently shedding value, though their profitability is on an upward trend. ELF shows a more balanced financial profile with better liquidity and leverage metrics, whereas Coty struggles with profitability and liquidity but benefits from a broader product and geographic diversification. Risk-averse investors should weigh these factors carefully.
Risk Analysis
Below is a comparison of key risks faced by e.l.f. Beauty, Inc. (ELF) and Coty Inc. (COTY) as of the most recent fiscal year 2025:
| Metric | e.l.f. Beauty, Inc. (ELF) | Coty Inc. (COTY) |
|---|---|---|
| Market Risk | High beta (1.72) indicates higher volatility and sensitivity to market swings. | Moderate beta (0.96) suggests relatively lower volatility. |
| Debt level | Moderate debt-to-equity ratio (0.41), favorable interest coverage (9.44). | High debt-to-equity ratio (1.15), limited interest coverage (2.33), signaling financial strain. |
| Regulatory Risk | Standard risks in consumer products, no recent major compliance issues. | Exposure to complex international regulations due to global footprint. |
| Operational Risk | Smaller scale (633 employees), reliance on e-commerce and retail partnerships. | Large scale (11,791 employees), complexity in managing multiple brands and distribution channels. |
| Environmental Risk | Moderate, with growing consumer demand for sustainability potentially impacting costs. | Similar moderate risk, with increasing pressure on sustainable sourcing and production. |
| Geopolitical Risk | Limited direct exposure, mainly US-based operations with some international distribution. | Higher exposure due to operations in ~150 countries, vulnerable to trade tensions and tariffs. |
The most impactful risks for these companies are market volatility for e.l.f. Beauty, due to its higher beta, and financial distress for Coty, as evidenced by its low Altman Z-score placing it in the distress zone. Coty’s high debt and weak profitability further elevate its risk profile, while e.l.f. shows more financial stability despite some unfavorable valuation ratios. Investors should weigh these aspects carefully in portfolio decisions.
Which Stock to Choose?
e.l.f. Beauty, Inc. (ELF) shows strong income growth with a 28.28% revenue increase in the last year and a favorable gross margin of 71.24%. Its profitability is solid, with an 8.53% net margin and a 14.73% return on equity, supported by manageable debt levels and a neutral overall financial ratios evaluation. The company’s rating is very favorable with a C+ score.
Coty Inc. (COTY) experienced a revenue decline of 3.68% last year and an unfavorable net margin of -6.24%. Profitability metrics such as return on equity are negative at -9.98%, and the company carries higher debt with a net debt to EBITDA ratio of 4.2. Its financial ratios evaluation is unfavorable despite a very favorable rating of C+, mostly due to strong discounted cash flow scores.
The choice between ELF and COTY could depend on investor profile: growth-oriented investors might find ELF’s improving income statement and stable ratios attractive, while risk-tolerant investors focusing on potential turnaround opportunities may see value in COTY’s improving ROIC trend despite current financial challenges.
Disclaimer: Investment carries a risk of loss of initial capital. The past performance is not a reliable indicator of future results. Be sure to understand risks before making an investment decision.
Go Further
I encourage you to read the complete analyses of e.l.f. Beauty, Inc. and Coty Inc. to enhance your investment decisions: