Texas Pacific Land Corporation (TPL) and Coterra Energy Inc. (CTRA) are two prominent players in the oil and gas exploration and production sector. While TPL focuses on land and resource management with a unique royalty-based model, CTRA emphasizes direct energy production across key U.S. basins. Their overlapping presence in energy innovation and resource management makes this comparison essential. Join me as we analyze which company offers the most compelling opportunity for investors in 2026.
Table of contents
Companies Overview
I will begin the comparison between Texas Pacific Land Corporation and Coterra Energy Inc. by providing an overview of these two companies and their main differences.
Texas Pacific Land Corporation Overview
Texas Pacific Land Corporation operates primarily in land and resource management alongside water services within the energy sector. It manages around 880,000 acres of land, holding various nonparticipating perpetual oil and gas royalty interests across its holdings in western Texas. The company also leases land for infrastructure and commercial usage while providing comprehensive water sourcing and treatment services to operators in the Permian Basin.
Coterra Energy Inc. Overview
Coterra Energy Inc. is an independent oil and gas company focused on the development, exploration, and production of hydrocarbons in the United States. With significant acreage in the Marcellus Shale, Permian Basin, and Anadarko Basin, it operates natural gas and disposal gathering systems and sells its production to a wide range of energy customers. The company maintains substantial proved reserves and operates mainly in natural gas, oil, and natural gas liquids.
Key similarities and differences
Both companies operate in the oil and gas exploration and production sector and are headquartered in Texas, but they differ in business focus and scale. Texas Pacific Land emphasizes land and resource management with royalties and water services, managing a smaller workforce of 111 employees. Coterra Energy concentrates on upstream oil and gas production with a larger employee base of 915, focusing heavily on natural gas development and extensive proved reserves.
Income Statement Comparison
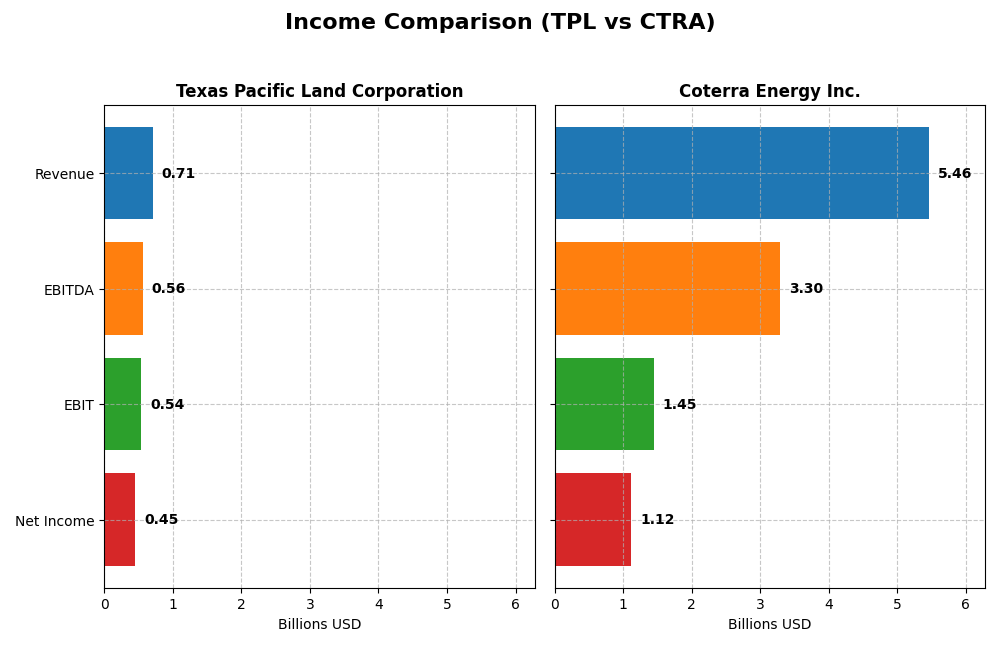
The table below presents a side-by-side comparison of the most recent income statement figures for Texas Pacific Land Corporation and Coterra Energy Inc. for the fiscal year 2024.
| Metric | Texas Pacific Land Corporation | Coterra Energy Inc. |
|---|---|---|
| Market Cap | 21.5B | 18.9B |
| Revenue | 706M | 5.46B |
| EBITDA | 564M | 3.30B |
| EBIT | 539M | 1.45B |
| Net Income | 454M | 1.12B |
| EPS | 6.58 | 1.51 |
| Fiscal Year | 2024 | 2024 |
Income Statement Interpretations
Texas Pacific Land Corporation
Texas Pacific Land Corporation (TPL) demonstrated consistent growth in revenue and net income from 2020 to 2024, with revenue rising from $303M to $706M and net income increasing from $176M to $454M. Margins remained robust, with a gross margin near 90% and net margin above 64%. The 2024 fiscal year showed favorable revenue growth of 11.75%, steady margin improvement, and a 12.1% increase in EPS, highlighting strong operational efficiency.
Coterra Energy Inc.
Coterra Energy Inc. (CTRA) experienced overall revenue growth from $1.4B in 2020 to $5.5B in 2024, alongside net income expanding from $201M to $1.12B. Margins stayed favorable but comparatively lower, with a gross margin around 31% and net margin near 21%. However, 2024 saw a decline in revenue (-3.9%) and net income (-29.1%) growth, reflecting short-term challenges despite positive long-term trends in profitability and EPS growth.
Which one has the stronger fundamentals?
Texas Pacific Land Corporation exhibits stronger fundamentals with consistently high margins, steady revenue and net income growth, and favorable yearly performance in 2024. Coterra Energy shows solid long-term growth but faces recent declines and lower margin levels. Overall, TPL’s income statement reflects more stable profitability and operational efficiency compared to CTRA’s more volatile recent results.
Financial Ratios Comparison
The table below presents a side-by-side comparison of key financial ratios for Texas Pacific Land Corporation (TPL) and Coterra Energy Inc. (CTRA) based on their most recent fiscal year data (2024).
| Ratios | Texas Pacific Land Corporation (TPL) | Coterra Energy Inc. (CTRA) |
|---|---|---|
| ROE | 40.1% | 8.54% |
| ROIC | 35.6% | 5.62% |
| P/E | 18.7 | 16.9 |
| P/B | 7.48 | 1.44 |
| Current Ratio | 8.33 | 2.92 |
| Quick Ratio | 8.33 | 2.88 |
| D/E (Debt-to-Equity) | 0.0004 | 0.29 |
| Debt-to-Assets | 0.04% | 17.6% |
| Interest Coverage | 0 (not reported) | 13.1 |
| Asset Turnover | 0.57 | 0.25 |
| Fixed Asset Turnover | 1.27 | 0.30 |
| Payout Ratio | 76.5% | 55.8% |
| Dividend Yield | 4.10% | 3.30% |
Interpretation of the Ratios
Texas Pacific Land Corporation
Texas Pacific Land Corporation shows strong profitability with a 64.32% net margin and a 40.09% return on equity, but its price-to-book of 7.48 and high current ratio of 8.33 are less favorable. The company pays a dividend with a 4.1% yield, supported by a healthy payout ratio and free cash flow coverage, indicating sustainable shareholder returns without excessive repurchases.
Coterra Energy Inc.
Coterra Energy exhibits a favorable net margin of 20.53% and a low debt-to-assets ratio at 17.58%, but its 8.54% return on equity and asset turnover ratios are weak. It pays a dividend yielding 3.3%, with a reasonable payout ratio and solid interest coverage, suggesting a balanced approach to shareholder returns amid moderate operational efficiency concerns.
Which one has the best ratios?
Both companies have overall favorable ratios; however, Texas Pacific Land Corporation displays stronger profitability and return metrics despite some liquidity concerns. Coterra Energy benefits from better leverage and liquidity ratios but suffers from weaker returns and asset efficiency. Each presents a distinct profile, with Texas Pacific Land showing more robust earnings performance.
Strategic Positioning
This section compares the strategic positioning of Texas Pacific Land Corporation and Coterra Energy Inc., including Market position, Key segments, and disruption:
Texas Pacific Land Corporation
- Manages 880K acres with royalties and land easements, faces moderate competitive pressure in oil & gas land management.
- Key segments are royalties from oil, gas, and water, plus land easements and water services driving revenue diversification.
- Limited exposure to technological disruption, focused on land/resource management and water services in Permian Basin.
Coterra Energy Inc.
- Independent oil & gas producer with 665K net acres in key US basins, operating in competitive exploration and production.
- Revenue driven mainly by oil, condensate, and natural gas liquids production across Marcellus, Permian, and Anadarko basins.
- Moderate exposure to technological shifts in exploration and production, with infrastructure for gas and saltwater disposal.
Texas Pacific Land Corporation vs Coterra Energy Inc. Positioning
TPL’s strategy centers on diversified land and resource management with royalty income and water services, while CTRA focuses on concentrated oil and gas production. TPL’s model provides revenue stability; CTRA’s depends on commodity prices and operational scale.
Which has the best competitive advantage?
TPL shows a very favorable moat with ROIC well above WACC and growing profitability, indicating a durable competitive advantage. CTRA has a slightly favorable moat with growing ROIC but currently sheds value, showing less competitive strength.
Stock Comparison
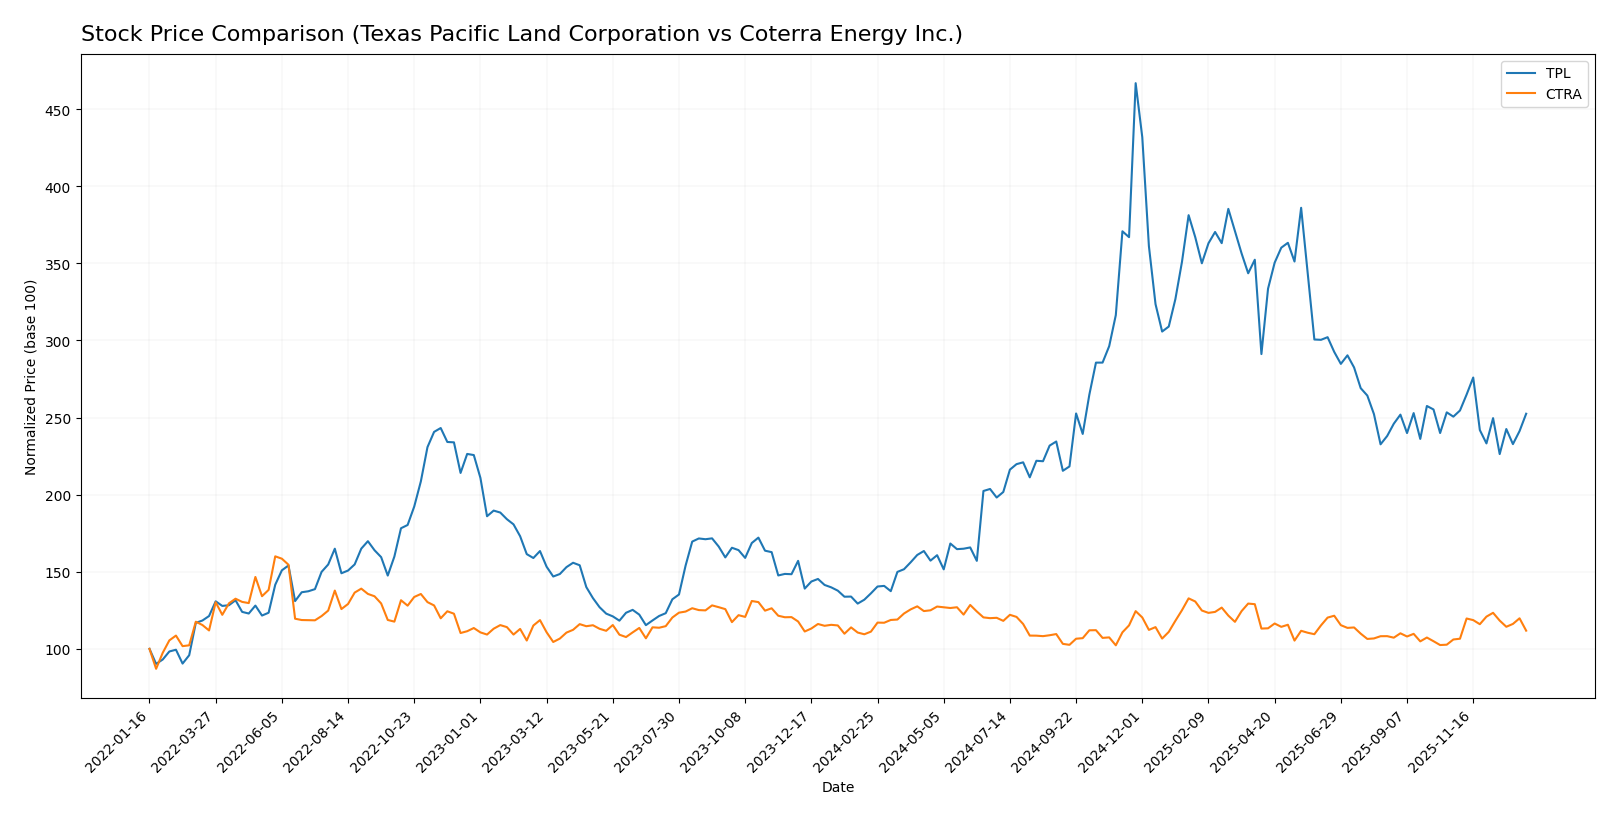
The stock price movements of Texas Pacific Land Corporation and Coterra Energy Inc. over the past 12 months reveal contrasting dynamics, with Texas Pacific Land showing significant appreciation while Coterra Energy exhibits modest gains amid varying buyer dominance.
Trend Analysis
Texas Pacific Land Corporation’s stock price increased by 85.66% over the past year, indicating a strong bullish trend with deceleration. The price ranged from a low of 167.98 to a high of 576.67, with high volatility (std deviation 91.94). Recent trend shows a slight 0.75% increase, signaling near-neutral momentum.
Coterra Energy Inc. posted a 0.57% price rise over the same period, classifying as a neutral trend with accelerating momentum. The stock fluctuated between 22.71 and 29.47, exhibiting low volatility (std deviation 1.71). Recent gains accelerated to 5.39%, supported by stable buyer dominance.
Comparing the two, Texas Pacific Land delivered the highest market performance with an 85.66% increase compared to Coterra Energy’s marginal 0.57% gain, reflecting a more robust bullish trend over the past year.
Target Prices
The current analyst consensus presents clear target price estimates for Texas Pacific Land Corporation and Coterra Energy Inc.
| Company | Target High | Target Low | Consensus |
|---|---|---|---|
| Texas Pacific Land Corporation | 1050 | 1050 | 1050 |
| Coterra Energy Inc. | 38 | 27 | 32.5 |
Analysts expect Texas Pacific Land’s share price to rise significantly from its current 311.87 USD to 1050 USD, indicating strong confidence. Coterra Energy’s consensus target of 32.5 USD suggests moderate upside potential compared to its current price of 24.82 USD.
Analyst Opinions Comparison
This section compares analysts’ ratings and grades for Texas Pacific Land Corporation and Coterra Energy Inc.:
Rating Comparison
TPL Rating
- Rating: Both have an A- rating, considered very favorable.
- Discounted Cash Flow Score: TPL scores 4, indicating favorable DCF valuation.
- ROE Score: TPL with a 5, showing very favorable profit generation from equity.
- ROA Score: Both score 5, demonstrating very favorable asset utilization.
- Debt To Equity Score: TPL scores 3, indicating moderate financial risk.
- Overall Score: Both hold a 4, reflecting a favorable overall financial standing.
CTRA Rating
- Rating: Both have an A- rating, considered very favorable.
- Discounted Cash Flow Score: CTRA scores 5, signaling very favorable DCF valuation.
- ROE Score: CTRA scores 4, reflecting favorable profit generation from equity.
- ROA Score: Both score 5, demonstrating very favorable asset utilization.
- Debt To Equity Score: CTRA scores 2, indicating moderate but slightly higher financial risk.
- Overall Score: Both hold a 4, reflecting a favorable overall financial standing.
Which one is the best rated?
Both companies share the same A- rating and overall score of 4. CTRA leads slightly with a superior discounted cash flow score of 5, while TPL excels in return on equity with a top score of 5.
Scores Comparison
Here is a comparison of the Altman Z-Score and Piotroski Score for Texas Pacific Land Corporation and Coterra Energy Inc.:
TPL Scores
- Altman Z-Score: 29.77, indicating a very safe zone.
- Piotroski Score: 4, classified as average financial strength.
CTRA Scores
- Altman Z-Score: 2.30, placing it in the grey zone.
- Piotroski Score: 6, also reflecting average financial strength.
Which company has the best scores?
Based on the provided data, Texas Pacific Land Corporation has a significantly higher Altman Z-Score, indicating stronger financial stability, while Coterra Energy has a somewhat better Piotroski Score. Overall, TPL’s scores suggest a safer financial position.
Grades Comparison
Here is a detailed comparison of the recent grades assigned to Texas Pacific Land Corporation and Coterra Energy Inc.:
Texas Pacific Land Corporation Grades
The following table summarizes recent grades from established grading companies for Texas Pacific Land Corporation.
| Grading Company | Action | New Grade | Date |
|---|---|---|---|
| BWS Financial | Maintain | Buy | 2024-08-12 |
| BWS Financial | Maintain | Buy | 2024-05-10 |
| BWS Financial | Maintain | Buy | 2024-04-02 |
| Stifel | Maintain | Hold | 2024-01-23 |
| Stifel | Maintain | Hold | 2023-11-30 |
| Stifel | Maintain | Hold | 2023-05-22 |
| Stifel | Maintain | Hold | 2023-05-21 |
| Stifel | Maintain | Hold | 2023-04-27 |
| Stifel | Maintain | Hold | 2023-04-26 |
| Stifel | Maintain | Hold | 2023-04-12 |
Overall, Texas Pacific Land Corporation’s grades show a consistent Buy rating from BWS Financial, while Stifel maintains a Hold rating.
Coterra Energy Inc. Grades
Below is the summary of recent grades from reputable grading firms for Coterra Energy Inc.
| Grading Company | Action | New Grade | Date |
|---|---|---|---|
| UBS | Maintain | Buy | 2025-12-12 |
| Piper Sandler | Maintain | Overweight | 2025-11-18 |
| Piper Sandler | Maintain | Overweight | 2025-10-21 |
| Susquehanna | Maintain | Positive | 2025-10-20 |
| UBS | Maintain | Buy | 2025-10-14 |
| Morgan Stanley | Maintain | Equal Weight | 2025-10-14 |
| Scotiabank | Maintain | Sector Outperform | 2025-10-09 |
| Mizuho | Maintain | Outperform | 2025-09-15 |
| Raymond James | Maintain | Outperform | 2025-09-11 |
| Piper Sandler | Maintain | Overweight | 2025-08-14 |
Coterra Energy Inc. has received predominantly positive ratings, including Buy, Overweight, and Outperform from multiple major grading firms.
Which company has the best grades?
Coterra Energy Inc. has received a broader range of positive ratings, including many Buy and Outperform classifications, compared to Texas Pacific Land Corporation’s mix of Buy and Hold ratings. This suggests that Coterra’s outlook may be viewed more favorably by analysts, potentially impacting investor confidence and portfolio decisions accordingly.
Strengths and Weaknesses
Below is a comparison table highlighting the main strengths and weaknesses of Texas Pacific Land Corporation (TPL) and Coterra Energy Inc. (CTRA) based on the most recent financial and operational data.
| Criterion | Texas Pacific Land Corporation (TPL) | Coterra Energy Inc. (CTRA) |
|---|---|---|
| Diversification | Moderate: Revenue mainly from oil/gas royalties and water sales (~$373M and $151M respectively in 2024) | Low: Revenue concentrated in oil and condensate (~$2.95B in 2024) |
| Profitability | High: Net margin 64.3%, ROIC 35.6%, consistent value creation, strong dividend yield (4.1%) | Moderate: Net margin 20.5%, ROIC 5.6%, currently shedding value but improving profitability |
| Innovation | Limited innovation focus, traditional land and royalty management | Moderate innovation in exploration and production efficiency |
| Global presence | Limited: Mainly U.S. land assets in Texas | Moderate: Operates primarily in North America with potential for expansion |
| Market Share | Niche market leader in Texas land and mineral rights | Competitive player in oil and gas production with growing ROIC |
Key takeaways: TPL excels in profitability and value creation with a strong economic moat, driven by its unique land and royalty assets, though it lacks diversification. CTRA shows improving profitability and solid financial health but remains more vulnerable due to its concentrated exposure and lower ROIC. Investors should weigh TPL’s stability against CTRA’s growth potential and risk profile.
Risk Analysis
Below is a comparative table highlighting the key risks for Texas Pacific Land Corporation (TPL) and Coterra Energy Inc. (CTRA) as of 2026:
| Metric | Texas Pacific Land Corporation (TPL) | Coterra Energy Inc. (CTRA) |
|---|---|---|
| Market Risk | Moderate (Beta: 0.935) | Low (Beta: 0.333) |
| Debt Level | Very Low (Debt to Equity: 0.0) | Moderate (Debt to Equity: 0.29) |
| Regulatory Risk | Moderate (Energy sector regulations) | Moderate (Energy sector regulations) |
| Operational Risk | Low (Small workforce, focused operations) | Moderate (Larger operations across multiple basins) |
| Environmental Risk | Moderate (Land and water resource management) | Moderate to High (Oil & gas production, natural gas focus) |
| Geopolitical Risk | Low (Primarily US-based) | Low (Primarily US-based) |
The most impactful risks are Coterra’s moderate debt level combined with operational complexity across multiple basins, heightening financial and operational exposure. Texas Pacific Land’s risk profile benefits from very low debt and focused land/resource management but faces moderate regulatory and environmental scrutiny typical of the energy sector. Both companies operate primarily in the US, limiting geopolitical risk.
Which Stock to Choose?
Texas Pacific Land Corporation (TPL) shows strong income growth with a 133% revenue increase over 2020-2024 and a high net margin of 64.32%. Its financial ratios are largely favorable, highlighted by a 40% ROE and low debt, supported by a very favorable rating and a very favorable moat indicating durable competitive advantage.
Coterra Energy Inc. (CTRA) exhibits significant long-term income growth but reported a recent revenue decline of 3.92%. Its financial ratios are mixed, with a favorable net margin of 20.53% but a lower ROE of 8.54%. The company holds a very favorable rating and a slightly favorable moat, reflecting improving but currently modest profitability.
Investors prioritizing consistent profitability and strong competitive moats might find TPL more aligned with their goals, while those focusing on potential growth amidst current challenges could see CTRA as appealing. The choice may depend on the investor’s risk tolerance and preference for stability versus recovery potential.
Disclaimer: Investment carries a risk of loss of initial capital. The past performance is not a reliable indicator of future results. Be sure to understand risks before making an investment decision.
Go Further
I encourage you to read the complete analyses of Texas Pacific Land Corporation and Coterra Energy Inc. to enhance your investment decisions: