In the dynamic energy sector, Occidental Petroleum Corporation (OXY) and Coterra Energy Inc. (CTRA) stand out as influential players in oil and gas exploration and production. Both headquartered in Houston, Texas, they share a focus on U.S. energy resources yet differ in scale and operational scope. This comparison aims to uncover which company aligns best with investment goals, helping you make an informed choice in a competitive market.
Table of contents
Companies Overview
I will begin the comparison between Occidental Petroleum Corporation and Coterra Energy Inc. by providing an overview of these two companies and their main differences.
Occidental Petroleum Corporation Overview
Occidental Petroleum Corporation operates in the oil and gas exploration and production industry with a diversified business model including chemical manufacturing and midstream operations. Founded in 1920 and headquartered in Houston, Texas, the company focuses on acquiring, exploring, and developing oil and gas properties across the US, the Middle East, Africa, and Latin America. It is a major player with a market capitalization of approximately 42.2B USD.
Coterra Energy Inc. Overview
Coterra Energy Inc. is an independent oil and gas company concentrating on exploration, development, and production primarily in the United States. Headquartered in Houston, Texas, Coterra holds significant acreage in the Marcellus Shale, Permian Basin, and Anadarko Basin. It also operates natural gas and disposal gathering systems. The company, incorporated in 1989, has a market capitalization near 18.9B USD, focusing on natural gas and liquids production.
Key similarities and differences
Both Occidental and Coterra operate within the oil and gas exploration and production sector and are headquartered in Houston, Texas. Occidental has a more diversified business model with chemical manufacturing and midstream activities, while Coterra is more focused on upstream operations with a strong emphasis on specific US basins. Occidental’s scale is larger with over 13,000 employees compared to Coterra’s 915, and it operates internationally, unlike Coterra’s primarily domestic focus.
Income Statement Comparison
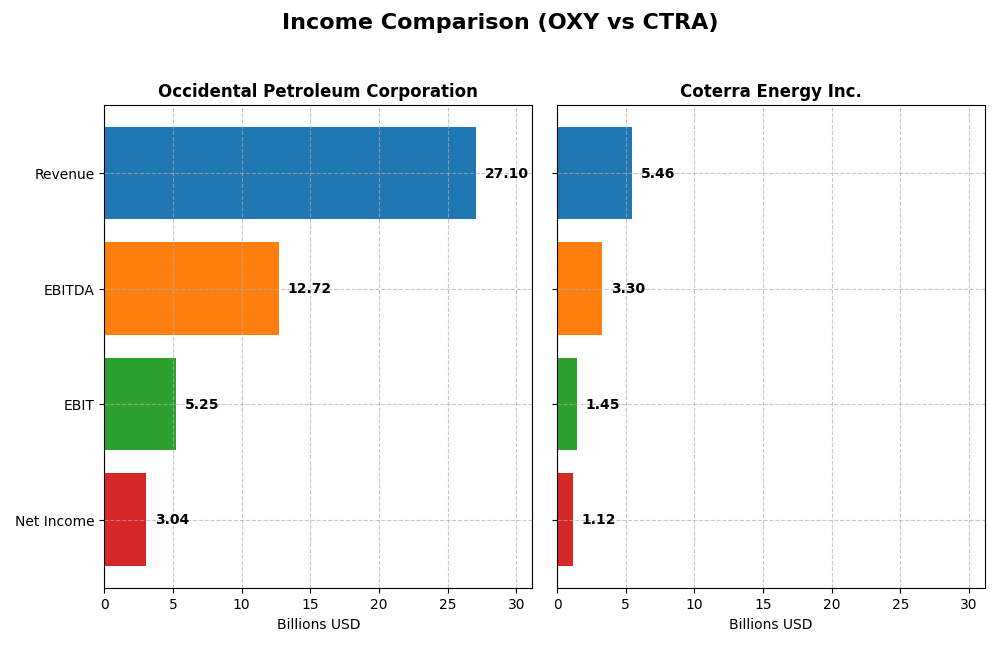
The following table presents a side-by-side comparison of the 2024 income statement metrics for Occidental Petroleum Corporation (OXY) and Coterra Energy Inc. (CTRA).
| Metric | Occidental Petroleum Corporation (OXY) | Coterra Energy Inc. (CTRA) |
|---|---|---|
| Market Cap | 42.2B | 18.9B |
| Revenue | 27.1B | 5.46B |
| EBITDA | 12.7B | 3.30B |
| EBIT | 5.25B | 1.45B |
| Net Income | 3.04B | 1.12B |
| EPS | 2.59 | 1.51 |
| Fiscal Year | 2024 | 2024 |
Income Statement Interpretations
Occidental Petroleum Corporation
Occidental Petroleum’s revenue and net income showed strong growth over the 2020-2024 period, with revenue up 58.12% and net income more than doubling by 120.52%. Margins remained favorable, with a gross margin of 35.61% and net margin of 11.23%. However, in 2024, revenue and earnings declined, with net margin shrinking by 31.92%, reflecting a slowdown in profitability despite solid overall fundamentals.
Coterra Energy Inc.
Coterra Energy experienced remarkable expansion from 2020 to 2024, with revenue surging 288.62% and net income growing 459.02%. Margins are solid, featuring a 30.97% gross margin and a strong 20.53% net margin. The most recent year saw a decline in revenue and earnings, with net margin falling 28.2%, indicating a contraction in profitability after several years of rapid growth.
Which one has the stronger fundamentals?
Both Occidental Petroleum and Coterra Energy show favorable overall income statement evaluations, with 57.14% of metrics positive. Occidental presents robust margins and consistent long-term growth but faced recent declines in profitability. Coterra stands out for explosive revenue and earnings growth and higher net margins, though it also experienced a notable dip in the latest year. Each company demonstrates strengths but also recent challenges in sustaining growth momentum.
Financial Ratios Comparison
The table below presents a side-by-side comparison of key financial ratios for Occidental Petroleum Corporation (OXY) and Coterra Energy Inc. (CTRA) based on their most recent fiscal year data for 2024.
| Ratios | Occidental Petroleum Corporation (OXY) | Coterra Energy Inc. (CTRA) |
|---|---|---|
| ROE | 8.91% | 8.54% |
| ROIC | 5.48% | 5.62% |
| P/E | 14.81 | 16.91 |
| P/B | 1.32 | 1.44 |
| Current Ratio | 0.95 | 2.92 |
| Quick Ratio | 0.73 | 2.88 |
| D/E (Debt-to-Equity) | 0.79 | 0.29 |
| Debt-to-Assets | 31.7% | 17.6% |
| Interest Coverage | 5.08 | 13.10 |
| Asset Turnover | 0.32 | 0.25 |
| Fixed Asset Turnover | 0.39 | 0.30 |
| Payout Ratio | 47.5% | 55.8% |
| Dividend Yield | 3.21% | 3.30% |
Interpretation of the Ratios
Occidental Petroleum Corporation
Occidental shows a mixed ratio profile with favorable net margin (11.23%) and valuation metrics such as PE (14.81) and PB (1.32), but concerns arise from its low current (0.95) and quick ratios (0.73), indicating liquidity pressure. The company maintains a dividend yield of 3.21%, supported by relatively stable payouts, though free cash flow coverage is tight, posing sustainability risks.
Coterra Energy Inc.
Coterra exhibits a stronger overall ratio set, with a favorable net margin (20.53%), solid liquidity ratios (current 2.92, quick 2.88), and low leverage (debt-to-assets 17.58%). Its dividend yield is slightly higher at 3.3%, with good free cash flow coverage and interest coverage of 13.69, suggesting better capacity to sustain shareholder returns amid moderate asset turnover concerns.
Which one has the best ratios?
Coterra Energy presents a more favorable ratio profile overall, with 64% of its ratios rated positively, including strong liquidity and solvency measures. Occidental’s ratios are more balanced but include several unfavorable liquidity and efficiency metrics, leading to a neutral global opinion. This contrast highlights Coterra’s comparatively stronger financial position in 2024.
Strategic Positioning
This section compares the strategic positioning of Occidental Petroleum Corporation and Coterra Energy Inc. across market position, key segments, and exposure to technological disruption:
Occidental Petroleum Corporation
- Large market cap of 42B with diversified segments faces moderate competitive pressure.
- Operates Oil & Gas, Chemical, Midstream segments with diversified revenue streams.
- No explicit exposure to technological disruption mentioned.
Coterra Energy Inc.
- Smaller market cap of 19B focusing on U.S. onshore assets under competitive pressure.
- Concentrates on oil, natural gas liquids, and gas production mainly from U.S. basins.
- No explicit exposure to technological disruption mentioned.
Occidental Petroleum vs Coterra Energy Positioning
Occidental has a diversified business model spanning chemicals, midstream, and oil & gas, providing multiple revenue drivers. Coterra focuses on concentrated U.S. shale assets, which may limit diversification but enhances operational focus. Both face competitive pressures in exploration and production.
Which has the best competitive advantage?
Both companies show slightly favorable moat evaluations due to growing ROIC trends, but neither currently demonstrates a strong competitive advantage, as both are shedding value relative to their cost of capital.
Stock Comparison
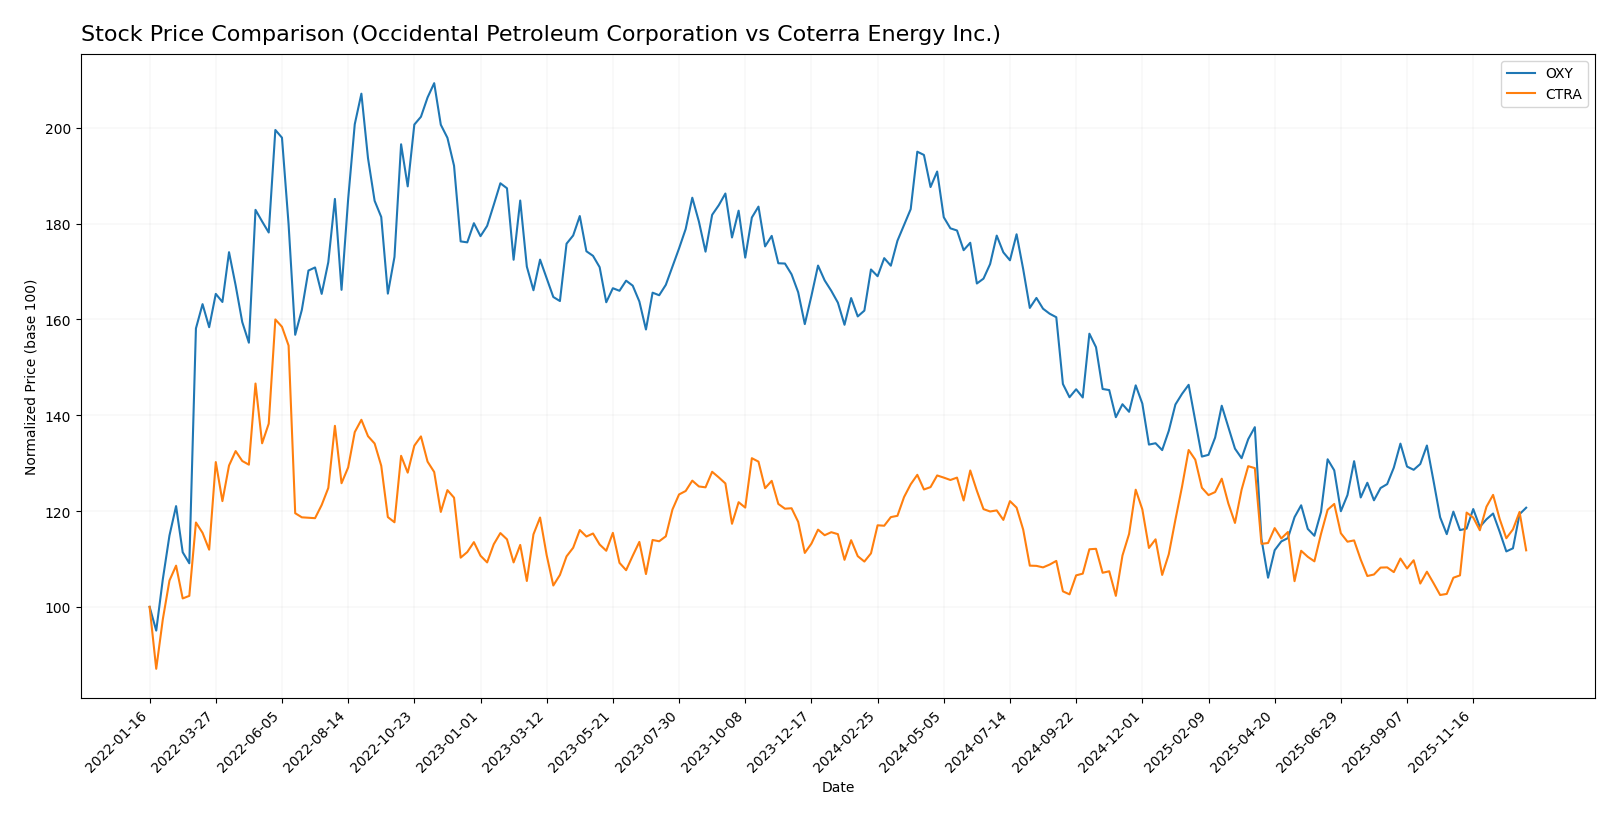
The stock price movements of Occidental Petroleum Corporation (OXY) and Coterra Energy Inc. (CTRA) over the past year reveal contrasting dynamics, with OXY showing a significant decline while CTRA maintains a modest upward trajectory.
Trend Analysis
Occidental Petroleum Corporation (OXY) exhibits a bearish trend over the past 12 months, with a 29.18% price decline and accelerating downward momentum. The stock’s price ranged between 69.25 and 37.67, showing high volatility with an 8.33 standard deviation.
Coterra Energy Inc. (CTRA) shows a bullish trend over the same period, with a 0.57% price increase and accelerating growth. The price fluctuated between 22.71 and 29.47, accompanied by a lower volatility of 1.71 standard deviation.
Comparing both, CTRA has delivered the highest market performance with a slight positive trend, contrasting with OXY’s pronounced bearish movement over the past year.
Target Prices
Analysts present a clear consensus on target prices for Occidental Petroleum Corporation and Coterra Energy Inc.
| Company | Target High | Target Low | Consensus |
|---|---|---|---|
| Occidental Petroleum Corporation | 64 | 38 | 49.36 |
| Coterra Energy Inc. | 38 | 27 | 32.5 |
The consensus targets for Occidental Petroleum suggest a moderate upside from the current price of $42.86, while Coterra Energy’s targets indicate potential growth above its current $24.82 price. Both stocks show analyst optimism relative to their latest market prices.
Analyst Opinions Comparison
This section compares the analysts’ ratings and grades for Occidental Petroleum Corporation (OXY) and Coterra Energy Inc. (CTRA):
Rating Comparison
OXY Rating
- Rating: B+, categorized as Very Favorable by analysts.
- Discounted Cash Flow Score: 5, indicating a very favorable valuation outlook.
- ROE Score: 3, showing moderate efficiency in generating profit from equity.
- ROA Score: 4, reflecting favorable asset utilization effectiveness.
- Debt To Equity Score: 1, considered very unfavorable due to higher financial risk.
- Overall Score: 3, a moderate overall financial standing assessment.
CTRA Rating
- Rating: A-, also categorized as Very Favorable by analysts.
- Discounted Cash Flow Score: 5, equally very favorable valuation outlook.
- ROE Score: 4, indicating favorable efficiency in profit generation.
- ROA Score: 5, demonstrating very favorable asset utilization.
- Debt To Equity Score: 2, moderate financial risk with a stronger balance sheet.
- Overall Score: 4, indicating a favorable overall financial standing.
Which one is the best rated?
Based on the ratings and scores, CTRA is better rated than OXY, with higher overall, ROE, ROA, and a more favorable debt to equity score. OXY’s strong DCF score is matched, but its debt risk is significantly higher.
Scores Comparison
Here is a comparison of the Altman Z-Score and Piotroski Score for Occidental Petroleum Corporation and Coterra Energy Inc.:
OXY Scores
- Altman Z-Score: 1.39, in distress zone, high bankruptcy risk
- Piotroski Score: 5, average financial strength
CTRA Scores
- Altman Z-Score: 2.30, in grey zone, moderate bankruptcy risk
- Piotroski Score: 6, average financial strength
Which company has the best scores?
CTRA has a higher Altman Z-Score indicating lower bankruptcy risk and a slightly better Piotroski Score than OXY. Both show average financial strength, but CTRA’s scores suggest comparatively better stability.
Grades Comparison
Here is a comparison of the latest grades from reputable grading companies for the two energy sector companies:
Occidental Petroleum Corporation Grades
This table summarizes recent grades and actions from major financial institutions for Occidental Petroleum Corporation:
| Grading Company | Action | New Grade | Date |
|---|---|---|---|
| UBS | Maintain | Neutral | 2025-12-12 |
| B of A Securities | Maintain | Neutral | 2025-12-11 |
| JP Morgan | Downgrade | Underweight | 2025-12-08 |
| Citigroup | Maintain | Neutral | 2025-11-19 |
| Piper Sandler | Maintain | Neutral | 2025-11-18 |
| Susquehanna | Maintain | Positive | 2025-11-13 |
| Wells Fargo | Maintain | Underweight | 2025-11-12 |
| Mizuho | Maintain | Outperform | 2025-11-11 |
| Piper Sandler | Maintain | Neutral | 2025-10-21 |
| Susquehanna | Maintain | Positive | 2025-10-20 |
Overall, the grades for Occidental Petroleum show a mixed but mainly neutral to slightly negative sentiment with some positive and outperform ratings balanced by underweight and neutral opinions.
Coterra Energy Inc. Grades
Below is a summary of recent grades and recommendations from credible financial firms for Coterra Energy Inc.:
| Grading Company | Action | New Grade | Date |
|---|---|---|---|
| UBS | Maintain | Buy | 2025-12-12 |
| Piper Sandler | Maintain | Overweight | 2025-11-18 |
| Piper Sandler | Maintain | Overweight | 2025-10-21 |
| Susquehanna | Maintain | Positive | 2025-10-20 |
| UBS | Maintain | Buy | 2025-10-14 |
| Morgan Stanley | Maintain | Equal Weight | 2025-10-14 |
| Scotiabank | Maintain | Sector Outperform | 2025-10-09 |
| Mizuho | Maintain | Outperform | 2025-09-15 |
| Raymond James | Maintain | Outperform | 2025-09-11 |
| Piper Sandler | Maintain | Overweight | 2025-08-14 |
The overall trend for Coterra Energy is decidedly more positive with predominant buy, overweight, and outperform ratings without any sell or underweight grades.
Which company has the best grades?
Coterra Energy Inc. has received consistently more favorable grades than Occidental Petroleum Corporation, with multiple buy and outperform recommendations versus Occidental’s largely neutral to mixed ratings. This difference suggests stronger analyst confidence in Coterra’s prospects, which may influence long-term investor sentiment and portfolio positioning.
Strengths and Weaknesses
Below is a comparative overview of key strengths and weaknesses for Occidental Petroleum Corporation (OXY) and Coterra Energy Inc. (CTRA) based on recent financial and operational data.
| Criterion | Occidental Petroleum Corporation (OXY) | Coterra Energy Inc. (CTRA) |
|---|---|---|
| Diversification | High revenue diversity across Chemical (4.92B), Midstream (1.65B), and Oil & Gas (21.7B) segments | Less diversified, primarily Oil and Condensate (2.95B) with some Natural Gas Liquids revenue |
| Profitability | Moderate net margin at 11.23%, neutral ROIC (5.48%), favorable P/E (14.81) | Stronger net margin at 20.53%, neutral ROIC (5.62%), slightly higher P/E (16.91) |
| Innovation | No explicit innovation metrics; stable midstream and chemical segments support operational efficiency | Limited innovation data; focus on upstream oil and gas production |
| Global presence | Operates globally with significant upstream and downstream activities | Primarily focused on upstream energy assets in North America |
| Market Share | Larger scale with ~27B total revenue across segments, established midstream infrastructure | Smaller scale with ~3B revenue, growth potential in upstream production |
Key takeaways: Occidental Petroleum offers greater diversification and scale, balancing upstream and downstream operations, but shows mixed profitability signals. Coterra Energy boasts higher net margins and a more favorable liquidity position, though with less diversification. Both companies show improving profitability trends but are currently slightly value-destroying based on ROIC vs. WACC. Investors should weigh diversification against margin strength and operational focus.
Risk Analysis
Below is a comparative table summarizing key risks for Occidental Petroleum Corporation (OXY) and Coterra Energy Inc. (CTRA) as of 2026:
| Metric | Occidental Petroleum Corporation (OXY) | Coterra Energy Inc. (CTRA) |
|---|---|---|
| Market Risk | Moderate (Beta 0.38, oil price sensitivity) | Moderate (Beta 0.33, commodity exposure) |
| Debt level | Moderate (Debt-to-Equity 0.79, Altman Z-score distress zone) | Low (Debt-to-Equity 0.29, Altman Z-score grey zone) |
| Regulatory Risk | Elevated (Operations in US, Middle East, Africa) | Moderate (Primarily US operations) |
| Operational Risk | Medium (Large scale, diversified segments) | Lower (Focused on US shale and gas) |
| Environmental Risk | High (Oil & gas production with chemical segment) | Moderate (Natural gas focus with disposal systems) |
| Geopolitical Risk | Significant (Middle East and Africa exposure) | Low to Moderate (US-centric assets) |
The most impactful and likely risks are Occidental’s elevated debt level combined with its geopolitical exposure, especially in volatile regions, which could affect operational continuity and financial stability. Conversely, Coterra shows stronger financial health with lower debt and concentrated US operations, reducing geopolitical and regulatory uncertainties. However, both companies face inherent market volatility due to commodity price fluctuations.
Which Stock to Choose?
Occidental Petroleum Corporation (OXY) shows a favorable income statement overall with a 58.12% revenue growth over five years but a recent 4.35% decline. Its profitability ratios are mixed: a decent net margin of 11.23% but an unfavorable ROE of 8.91%. Debt levels are moderate, with net debt to EBITDA near 2, and the rating stands at a strong B+.
Coterra Energy Inc. (CTRA) presents robust income growth of 288.62% over five years despite a recent 3.92% revenue drop. Its financial ratios are generally favorable, including a higher net margin of 20.53%, though ROE remains modest at 8.54%. The company maintains lower debt with net debt to EBITDA around 0.54 and holds an A- rating.
For investors, CTRA’s favorable rating and stronger income growth might appeal to those seeking growth with moderate risk, while OXY’s stable rating and balanced profitability might be more aligned with investors preferring established, moderate-return companies. Both firms show slightly favorable moats with growing ROIC but currently shed value versus WACC, suggesting cautious evaluation.
Disclaimer: Investment carries a risk of loss of initial capital. The past performance is not a reliable indicator of future results. Be sure to understand risks before making an investment decision.
Go Further
I encourage you to read the complete analyses of Occidental Petroleum Corporation and Coterra Energy Inc. to enhance your investment decisions: