In the dynamic world of energy, EQT Corporation and Coterra Energy Inc. stand out as key players in oil and gas exploration and production. Both companies focus heavily on natural gas assets within major U.S. basins, sharing overlapping markets and ambitious innovation strategies to enhance resource efficiency. This article will dissect their strengths and risks to help you decide which company could be the smarter addition to your investment portfolio.
Table of contents
Companies Overview
I will begin the comparison between EQT Corporation and Coterra Energy Inc. by providing an overview of these two companies and their main differences.
EQT Corporation Overview
EQT Corporation operates as a natural gas production company in the United States, focusing on the extraction of natural gas and natural gas liquids such as ethane, propane, and butane. Founded in 1878 and headquartered in Pittsburgh, Pennsylvania, EQT holds substantial proved reserves of 25.0 trillion cubic feet across roughly 2.0 million gross acres, including a significant presence in the Marcellus play. It is a key player in the Oil & Gas Exploration & Production industry.
Coterra Energy Inc. Overview
Coterra Energy Inc. is an independent oil and gas company engaged in the exploration, development, and production of oil, natural gas, and natural gas liquids within the United States. Incorporated in 1989 and based in Houston, Texas, Coterra holds net acreage in the Marcellus Shale, Permian Basin, and Anadarko Basin, with proved reserves totaling approximately 2.9 billion barrels of oil equivalent. The company serves diverse energy customers including industrial and power generation sectors.
Key similarities and differences
Both EQT and Coterra operate in the Oil & Gas Exploration & Production sector in the U.S. and have significant exposure to natural gas reserves, particularly in the Marcellus region. EQT emphasizes natural gas and NGLs with a larger scale of reserves, while Coterra maintains a more diversified footprint including oil and multiple basins. Their business models overlap in upstream production but differ in asset distribution and scale of operations.
Income Statement Comparison
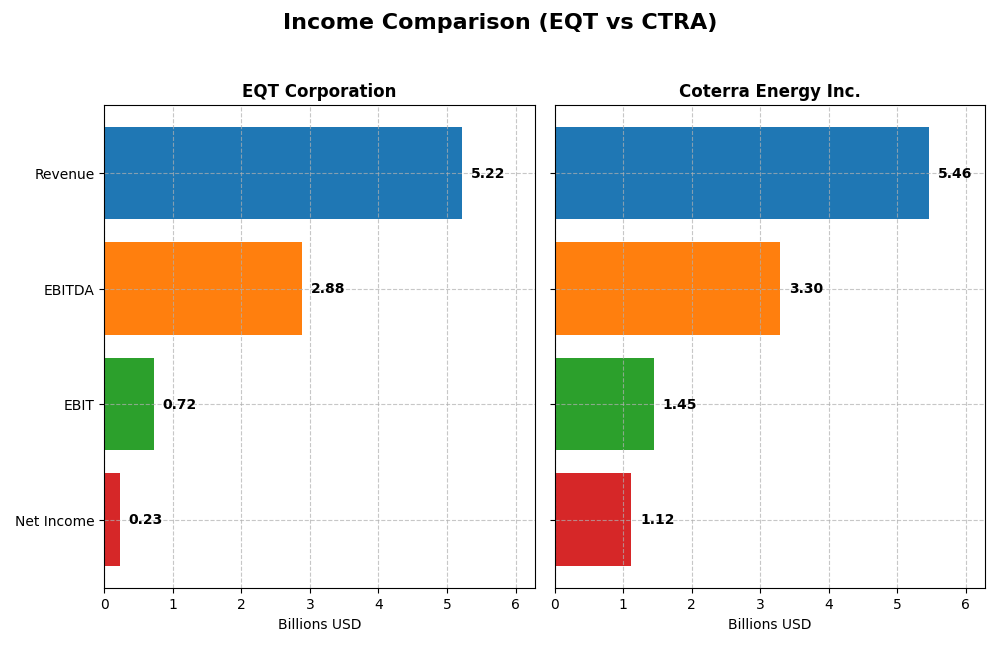
The table below compares key income statement metrics of EQT Corporation and Coterra Energy Inc. for the fiscal year 2024, providing a snapshot of their recent financial performance.
| Metric | EQT Corporation | Coterra Energy Inc. |
|---|---|---|
| Market Cap | 31.9B | 18.9B |
| Revenue | 5.22B | 5.46B |
| EBITDA | 2.88B | 3.30B |
| EBIT | 719M | 1.45B |
| Net Income | 231M | 1.12B |
| EPS | 0.45 | 1.51 |
| Fiscal Year | 2024 | 2024 |
Income Statement Interpretations
EQT Corporation
EQT Corporation’s revenue nearly doubled from 2020 to 2024, with net income also increasing by over 120%, reflecting a favorable long-term trend. However, the most recent year showed a slowdown, with revenue growth at 3% and net income declining sharply by 87%, leading to a significant contraction in margins. EBIT margin remains favorable at 13.77%, but gross profit and EPS suffered notable declines.
Coterra Energy Inc.
Coterra Energy experienced strong overall growth from 2020 to 2024, with revenue increasing by nearly 289% and net income surging over 450%. Margins are robust, highlighted by a gross margin of 30.97% and net margin above 20%. Yet, the latest fiscal year showed a revenue decline of nearly 4% and EPS falling about 29%, signaling some near-term pressure despite solid historical performance.
Which one has the stronger fundamentals?
Coterra Energy exhibits stronger fundamentals overall, with consistently favorable margins and more pronounced growth in revenue and net income over the full period. EQT shows moderate growth but faces recent earnings and margin contractions. While both companies saw unfavorable one-year trends, Coterra’s higher margins and greater long-term expansion suggest a more favorable income statement profile as of 2024.
Financial Ratios Comparison
This table presents the latest available financial ratios for EQT Corporation and Coterra Energy Inc. as of fiscal year 2024, providing a snapshot of their operational efficiency, profitability, liquidity, and leverage.
| Ratios | EQT Corporation (2024) | Coterra Energy Inc. (2024) |
|---|---|---|
| ROE | 1.12% | 8.54% |
| ROIC | 1.66% | 5.62% |
| P/E | 101.91 | 16.91 |
| P/B | 1.14 | 1.44 |
| Current Ratio | 0.70 | 2.92 |
| Quick Ratio | 0.70 | 2.88 |
| D/E (Debt-to-Equity) | 0.45 | 0.29 |
| Debt-to-Assets | 23.5% | 17.6% |
| Interest Coverage | 1.51 | 13.10 |
| Asset Turnover | 0.13 | 0.25 |
| Fixed Asset Turnover | 0.16 | 0.30 |
| Payout Ratio | 142% | 56% |
| Dividend Yield | 1.39% | 3.30% |
Interpretation of the Ratios
EQT Corporation
EQT’s ratios present several weaknesses with unfavorable net margin (4.42%), ROE (1.12%), and ROIC (1.66%), indicating limited profitability and capital efficiency. The company’s liquidity ratios are also weak, with a current ratio of 0.7. Dividend yield stands at 1.39%, a neutral signal, but coverage by free cash flow is negative, suggesting potential risks in sustaining distributions and buybacks.
Coterra Energy Inc.
Coterra displays stronger financial health with a favorable net margin of 20.53% and solid liquidity ratios, including a current ratio of 2.92 and quick ratio of 2.88. Debt levels are well-managed, and interest coverage is excellent at 13.69. The dividend yield is favorable at 3.3%, backed by manageable payout risks and stable shareholder returns.
Which one has the best ratios?
Coterra Energy Inc. clearly outperforms EQT Corporation in most key financial ratios, showing stronger profitability, liquidity, and interest coverage. EQT struggles with profitability and liquidity metrics, limiting its attractiveness based solely on ratios. Overall, Coterra’s ratios are more favorable, reflecting healthier financial stability and efficiency.
Strategic Positioning
This section compares the strategic positioning of EQT and Coterra Energy based on market position, key segments, and exposure to disruption:
EQT
- Larger market cap of $31.9B, moderate beta of 0.68, faces typical oil & gas sector competition.
- Focuses on natural gas and NGLs with $4.5B natural gas sales in 2023, significant Marcellus play acreage.
- Operates mainly in natural gas production, limited info on tech disruption exposure.
CTRA
- Market cap $18.9B with lower beta 0.33, competes in oil & gas with some risk mitigation.
- Diversified across Marcellus, Permian, Anadarko basins; oil and condensate sales $2.7B in 2023.
- No explicit information on technological disruption exposure provided.
EQT vs CTRA Positioning
EQT emphasizes natural gas with a strong presence in Marcellus, while Coterra has a broader geographic and resource diversification including oil and gas liquids. EQT’s scale offers market strength; Coterra’s diverse assets may spread operational risks.
Which has the best competitive advantage?
Both companies currently shed value relative to cost of capital but show growing ROIC trends. Coterra’s slightly favorable moat suggests improving profitability, whereas EQT’s slightly unfavorable moat indicates ongoing value destruction despite growth.
Stock Comparison
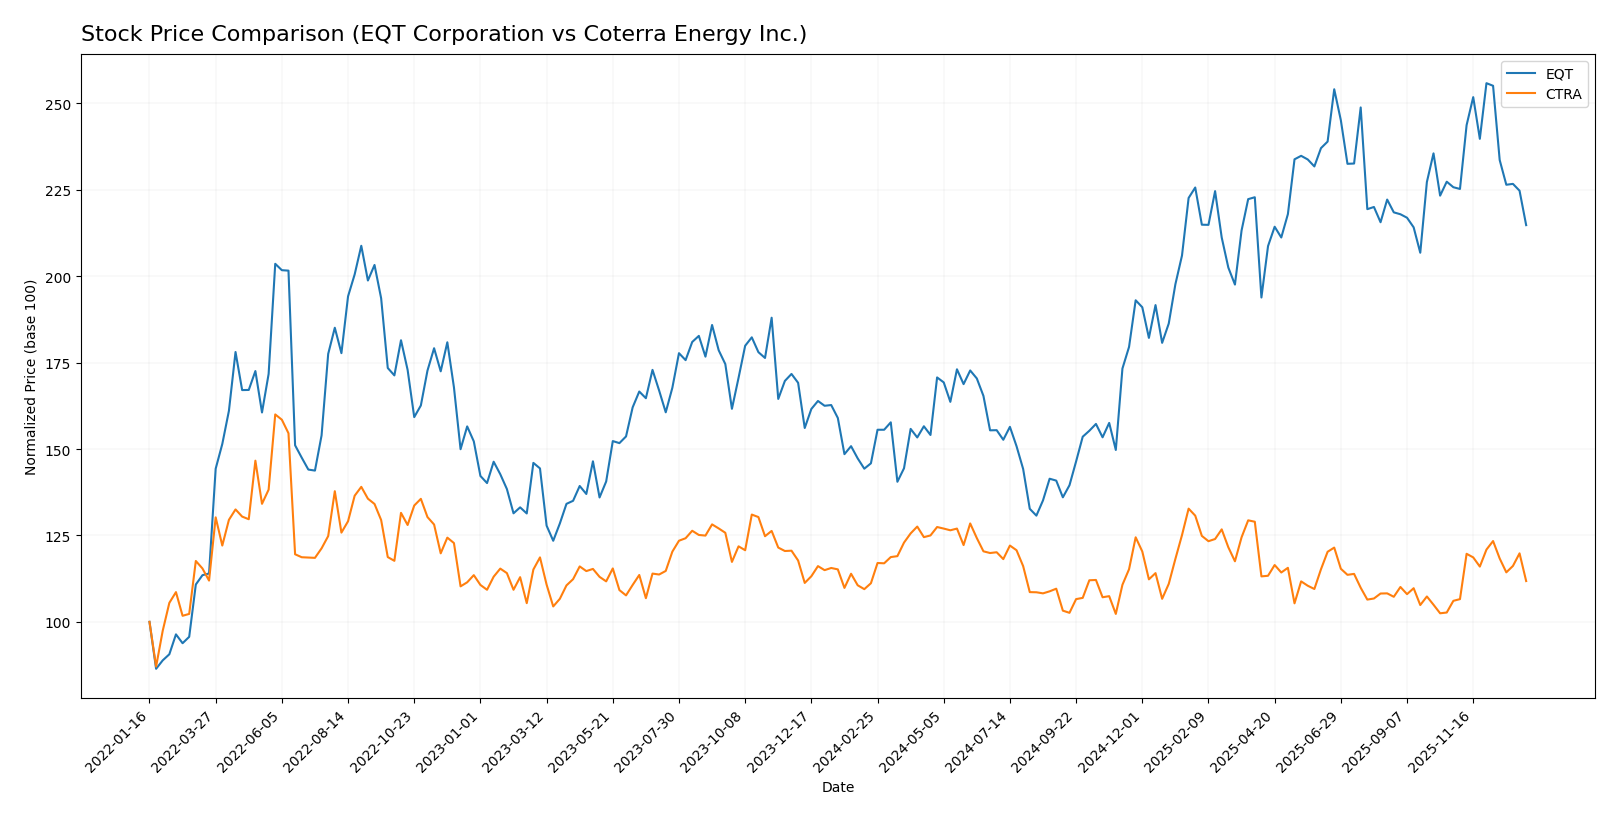
The stock price dynamics over the past year reveal a significant bullish trend for EQT Corporation with notable deceleration, while Coterra Energy Inc. presents a mild bullish trend with accelerating momentum.
Trend Analysis
EQT Corporation shows a strong bullish trend with a 47.23% price increase over the past 12 months, accompanied by a deceleration in momentum and a high volatility level (8.62 std deviation). The price ranged between 31.1 and 60.86.
Coterra Energy Inc. recorded a modest 0.57% price increase over the same period, indicating a neutral to mild bullish trend with accelerating momentum and lower volatility (1.71 std deviation). The price fluctuated between 22.71 and 29.47.
Comparing both stocks, EQT Corporation delivered the highest market performance with a substantially larger price increase, despite recent short-term weakness, while Coterra Energy maintained steady but limited gains.
Target Prices
Here is the current consensus on target prices for EQT Corporation and Coterra Energy Inc. based on reliable analyst data.
| Company | Target High | Target Low | Consensus |
|---|---|---|---|
| EQT Corporation | 55 | 23 | 41.11 |
| Coterra Energy Inc. | 38 | 27 | 32.5 |
Analysts expect EQT’s stock to trade near $41.11 on average, which is below its current price of $51.09, indicating potential downside. Coterra’s consensus target of $32.5 suggests significant upside from the current $24.82 price.
Analyst Opinions Comparison
This section compares analysts’ ratings and financial scores for EQT Corporation and Coterra Energy Inc.:
Rating Comparison
EQT Rating
- Rating: A-, classified as Very Favorable by analysts.
- Discounted Cash Flow Score: 5, indicating a very favorable valuation outlook.
- ROE Score: 4, showing favorable efficiency in generating profit from equity.
- ROA Score: 4, reflecting favorable asset utilization effectiveness.
- Debt To Equity Score: 2, suggesting moderate financial risk from leverage.
- Overall Score: 4, representing a favorable overall financial standing.
CTRA Rating
- Rating: A-, classified as Very Favorable by analysts.
- Discounted Cash Flow Score: 5, indicating a very favorable valuation outlook.
- ROE Score: 4, showing favorable efficiency in generating profit from equity.
- ROA Score: 5, reflecting very favorable asset utilization effectiveness.
- Debt To Equity Score: 2, suggesting moderate financial risk from leverage.
- Overall Score: 4, representing a favorable overall financial standing.
Which one is the best rated?
Both EQT and CTRA hold the same overall rating of A- with very favorable assessments. CTRA edges slightly ahead in ROA score, indicating superior asset utilization, while other scores are equal.
Scores Comparison
Here is a comparison of the key financial scores for EQT Corporation and Coterra Energy Inc.:
EQT Scores
- Altman Z-Score: 2.01, indicating grey zone with moderate bankruptcy risk.
- Piotroski Score: 8, classified as very strong financial strength.
CTRA Scores
- Altman Z-Score: 2.30, indicating grey zone with moderate bankruptcy risk.
- Piotroski Score: 6, classified as average financial strength.
Which company has the best scores?
EQT has a slightly lower Altman Z-Score but a notably higher Piotroski Score, showing stronger overall financial health compared to CTRA based on the provided data.
Grades Comparison
The following is a comparison of the latest grades and ratings assigned to EQT Corporation and Coterra Energy Inc.:
EQT Corporation Grades
This table shows recent grades assigned by established financial institutions for EQT Corporation.
| Grading Company | Action | New Grade | Date |
|---|---|---|---|
| Bernstein | Maintain | Outperform | 2026-01-05 |
| Citigroup | Maintain | Buy | 2025-12-19 |
| Mizuho | Maintain | Outperform | 2025-12-12 |
| UBS | Maintain | Buy | 2025-12-12 |
| Scotiabank | Maintain | Sector Perform | 2025-11-21 |
| Piper Sandler | Maintain | Neutral | 2025-11-18 |
| Wells Fargo | Maintain | Overweight | 2025-10-23 |
| UBS | Maintain | Buy | 2025-10-17 |
| Scotiabank | Maintain | Sector Perform | 2025-10-09 |
| Barclays | Maintain | Overweight | 2025-10-07 |
EQT Corporation’s grades predominantly range from Buy/Outperform to Sector Perform and Neutral, indicating a generally positive but varied analyst sentiment.
Coterra Energy Inc. Grades
Below is a summary of recent grades given by recognized grading firms for Coterra Energy Inc.
| Grading Company | Action | New Grade | Date |
|---|---|---|---|
| UBS | Maintain | Buy | 2025-12-12 |
| Piper Sandler | Maintain | Overweight | 2025-11-18 |
| Piper Sandler | Maintain | Overweight | 2025-10-21 |
| Susquehanna | Maintain | Positive | 2025-10-20 |
| UBS | Maintain | Buy | 2025-10-14 |
| Morgan Stanley | Maintain | Equal Weight | 2025-10-14 |
| Scotiabank | Maintain | Sector Outperform | 2025-10-09 |
| Mizuho | Maintain | Outperform | 2025-09-15 |
| Raymond James | Maintain | Outperform | 2025-09-11 |
| Piper Sandler | Maintain | Overweight | 2025-08-14 |
Coterra Energy Inc. shows consistently positive grades centered around Buy, Overweight, and Outperform, reflecting strong confidence from multiple analysts.
Which company has the best grades?
Both EQT Corporation and Coterra Energy Inc. receive predominantly positive grades with consensus ratings of “Buy.” However, Coterra’s grades are more consistently in the higher Buy-to-Outperform range, suggesting relatively stronger analyst enthusiasm, which may influence investor perceptions of growth and stability potential.
Strengths and Weaknesses
Below is a comparison of key strengths and weaknesses for EQT Corporation and Coterra Energy Inc. based on their recent financial and operational data.
| Criterion | EQT Corporation | Coterra Energy Inc. |
|---|---|---|
| Diversification | Primarily natural gas sales with minor oil and NGLs segments | Mainly oil and condensate sales with NGLs exposure |
| Profitability | Low net margin (4.42%), ROIC below WACC, value destroying | Strong net margin (20.53%), ROIC near WACC, improving profitability |
| Innovation | Limited data on innovation; focus on efficiency improvements | No major innovation highlights; steady operational improvements |
| Global presence | Primarily US-based operations | Primarily US-based operations |
| Market Share | Significant in natural gas market | Growing presence in oil and condensate |
Key takeaways: EQT struggles with profitability and value creation despite improving returns, relying heavily on natural gas. Coterra shows better profitability metrics and balance sheet strength with a focus on oil, making it slightly more favorable for investors cautious about value creation and financial health.
Risk Analysis
Below is a comparative overview of key risks for EQT Corporation and Coterra Energy Inc. based on the latest 2024 financial and operational data:
| Metric | EQT Corporation | Coterra Energy Inc. |
|---|---|---|
| Market Risk | Moderate (Beta 0.68, volatile energy prices impact) | Lower (Beta 0.33, more stable) |
| Debt level | Moderate (Debt/Equity 0.45, interest coverage low at 1.58) | Low (Debt/Equity 0.29, strong interest coverage 13.69) |
| Regulatory Risk | High (Environmental regulations on natural gas) | High (Similar exposure, with diverse assets in multiple basins) |
| Operational Risk | Moderate (Low asset turnover, operational efficiency concerns) | Moderate (Better liquidity but still operational efficiency challenges) |
| Environmental Risk | Elevated (Natural gas production with methane emission concerns) | Elevated (Oil and gas exploration with similar environmental scrutiny) |
| Geopolitical Risk | Moderate (US-focused, less global exposure) | Moderate (US-focused but with operations in multiple basins) |
The most impactful risks are regulatory and environmental, given increasing US policies targeting emissions in fossil fuel sectors. EQT’s weaker interest coverage and operational efficiency pose additional financial risks. Coterra benefits from stronger liquidity and debt metrics, reducing financial distress probability despite similar sector risks. Both companies fall in the Altman Z-score grey zone, indicating moderate bankruptcy risk, but EQT shows stronger Piotroski score strength. Investors should weigh these risks carefully, prioritizing robust risk management amid energy transition uncertainties.
Which Stock to Choose?
EQT Corporation shows a mixed income evolution with favorable long-term revenue and net income growth but recent declines in profitability. Its financial ratios are mostly unfavorable, including low returns and liquidity, though debt levels are moderate and rating stands at A- (very favorable).
Coterra Energy Inc. demonstrates strong income fundamentals with favorable margins and growth over the long term despite recent declines. Its financial ratios are largely favorable, especially liquidity and leverage, supported by a slightly favorable MOAT and an A- rating (very favorable).
For investors, Coterra Energy may appear more attractive for those prioritizing financial stability and quality given its favorable ratios and income profile, while EQT might appeal to those seeking potential value creation amid improving profitability but with higher risk. The choice could depend on individual risk tolerance and investment strategy.
Disclaimer: Investment carries a risk of loss of initial capital. The past performance is not a reliable indicator of future results. Be sure to understand risks before making an investment decision.
Go Further
I encourage you to read the complete analyses of EQT Corporation and Coterra Energy Inc. to enhance your investment decisions: