In the dynamic world of energy, EOG Resources, Inc. and Coterra Energy Inc. stand out as key players in oil and gas exploration and production. Both headquartered in Houston, Texas, they operate with overlapping market interests yet distinct strategies, positioning themselves as innovators amid fluctuating commodity prices. This comparison aims to unveil which company offers the most compelling opportunity for investors seeking growth and stability in the energy sector. Let’s explore which is the better pick for your portfolio.
Table of contents
Companies Overview
I will begin the comparison between EOG Resources, Inc. and Coterra Energy Inc. by providing an overview of these two companies and their main differences.
EOG Overview
EOG Resources, Inc. focuses on exploring, developing, producing, and marketing crude oil, natural gas, and natural gas liquids. Headquartered in Houston, Texas, it operates primarily in New Mexico, Texas, and Trinidad and Tobago. With substantial proved reserves totaling 3.7B barrels of oil equivalent, EOG is a significant player in the oil and gas exploration and production industry.
Coterra Overview
Coterra Energy Inc. is an independent oil and gas company engaged in exploration, development, and production primarily in the United States. It holds large acreage in the Marcellus Shale, Permian Basin, and Anadarko Basin. Also based in Houston, Texas, Coterra has proved reserves of approximately 2.9B barrels of oil equivalent and operates natural gas and disposal gathering systems in Texas.
Key similarities and differences
Both EOG and Coterra operate in oil and gas exploration and production, with headquarters in Houston and focus on natural gas and liquids. EOG has a larger market cap and reserves, with more diverse geographic exposure, including international operations. Coterra concentrates on U.S. basins with substantial acreage. Their business models emphasize resource development, but differ in scale and regional focus.
Income Statement Comparison
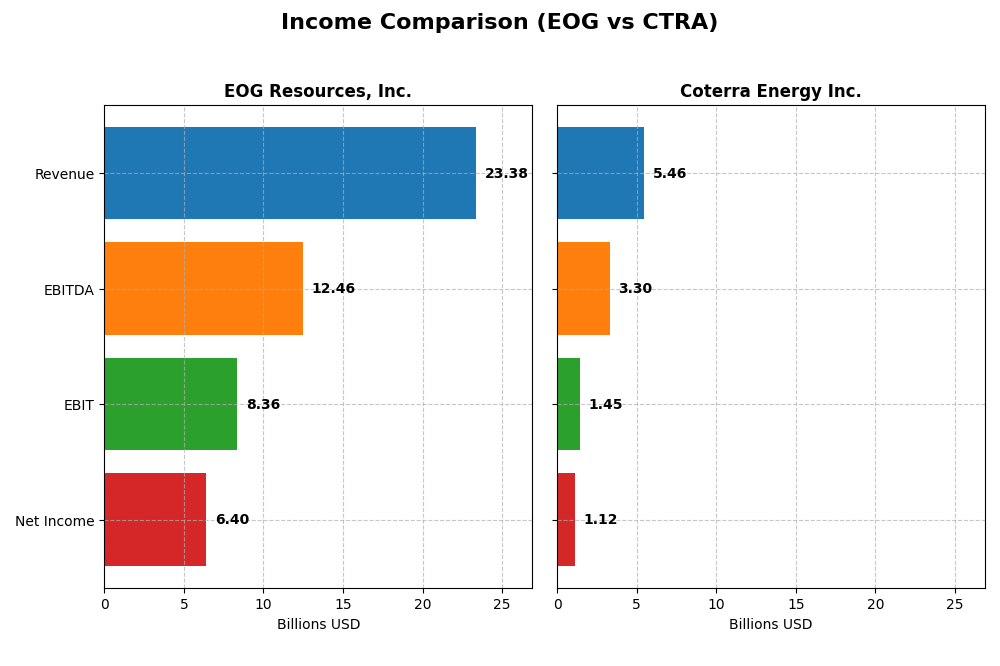
The table below presents a side-by-side comparison of key income statement metrics for EOG Resources, Inc. and Coterra Energy Inc. for the fiscal year 2024.
| Metric | EOG Resources, Inc. | Coterra Energy Inc. |
|---|---|---|
| Market Cap | 57.5B | 18.9B |
| Revenue | 23.4B | 5.5B |
| EBITDA | 12.5B | 3.3B |
| EBIT | 8.4B | 1.5B |
| Net Income | 6.4B | 1.1B |
| EPS | 11.31 | 1.51 |
| Fiscal Year | 2024 | 2024 |
Income Statement Interpretations
EOG Resources, Inc.
EOG Resources showed strong revenue growth from 2020 to 2024, increasing from 9.9B to 23.4B USD, with net income rising dramatically from a loss of 605M USD in 2020 to 6.4B USD in 2024. Margins remain robust, with a gross margin of 75.7% and net margin near 27.4%. The latest year saw revenue growth slow to 0.85%, accompanied by a 16.4% decline in net margin.
Coterra Energy Inc.
Coterra Energy’s revenue expanded impressively over five years, from 1.4B USD in 2020 to 5.5B USD in 2024, with net income rising from 201M to 1.1B USD. Gross and net margins are stable at around 31% and 20.5%, respectively. However, the most recent year showed a 3.9% revenue decline and a 28.2% drop in net margin, signaling pressure on profitability.
Which one has the stronger fundamentals?
Both EOG and Coterra report favorable overall income statements with over 57% positive metrics. EOG exhibits higher margins and more substantial net income growth over the period, despite recent margin compression. Coterra shows significant revenue growth but with lower margins and sharper recent declines. EOG’s stronger profitability metrics suggest more resilient fundamentals based on income statement performance.
Financial Ratios Comparison
This table presents a side-by-side comparison of key financial ratios for EOG Resources, Inc. and Coterra Energy Inc. based on their most recent fiscal year data for 2024.
| Ratios | EOG Resources, Inc. | Coterra Energy Inc. |
|---|---|---|
| ROE | 21.82% | 8.54% |
| ROIC | 14.75% | 5.62% |
| P/E | 10.84 | 16.91 |
| P/B | 2.36 | 1.44 |
| Current Ratio | 2.10 | 2.92 |
| Quick Ratio | 1.91 | 2.88 |
| D/E (Debt-to-Equity) | 0.17 | 0.29 |
| Debt-to-Assets | 10.74% | 17.58% |
| Interest Coverage | 58.57 | 13.10 |
| Asset Turnover | 0.50 | 0.25 |
| Fixed Asset Turnover | 0.68 | 0.30 |
| Payout ratio | 32.59% | 55.75% |
| Dividend yield | 3.01% | 3.30% |
Interpretation of the Ratios
EOG Resources, Inc.
EOG Resources displays predominantly strong financial ratios in 2024, including a favorable net margin of 27.39% and return on equity at 21.82%. The company maintains a solid liquidity position with a current ratio of 2.1 and low leverage, debt-to-equity at 0.17. However, asset turnover ratios remain weak, signaling potential efficiency issues. EOG pays dividends with a 3.01% yield, supported by free cash flow coverage, although cautious monitoring of payout sustainability is advised.
Coterra Energy Inc.
Coterra Energy’s 2024 ratios are mostly favorable, highlighted by a solid net margin of 20.53% and good liquidity ratios above 2.8. However, return on equity is weak at 8.54%, with return on invested capital neutral at 5.62%, indicating moderate profitability. The company has a higher debt level compared to peers but retains favorable interest coverage. Coterra pays dividends yielding 3.3%, with prudent balance between distributions and financial health.
Which one has the best ratios?
EOG Resources presents a superior overall ratios profile with 78.57% favorable metrics, including stronger profitability and leverage management than Coterra, which has 64.29% favorable ratios. While both companies face challenges in asset turnover, EOG’s higher returns and liquidity ratios suggest a more robust financial position in 2024.
Strategic Positioning
This section compares the strategic positioning of EOG Resources, Inc. and Coterra Energy Inc. in terms of market position, key segments, and exposure to technological disruption:
EOG
- Leading market cap of $57.5B with moderate beta, facing standard industry competition.
- Diversified revenue streams: oil, natural gas liquids, and gas gathering dominate.
- Limited explicit exposure to technological disruption mentioned.
CTRA
- Smaller market cap of $18.9B with lower beta, operating in competitive US basins.
- Focused on US shale plays, primarily Marcellus and Permian basins.
- No specific details on technological disruption exposure provided.
EOG vs CTRA Positioning
EOG demonstrates a diversified business model with significant oil and gas liquids production across multiple regions, while CTRA concentrates on specific US shale basins with a narrower operational focus, which may affect risk and growth dynamics.
Which has the best competitive advantage?
EOG has a very favorable moat with growing ROIC well above WACC, indicating durable competitive advantage. CTRA shows only a slightly favorable moat with ROIC near WACC, suggesting weaker but improving profitability.
Stock Comparison
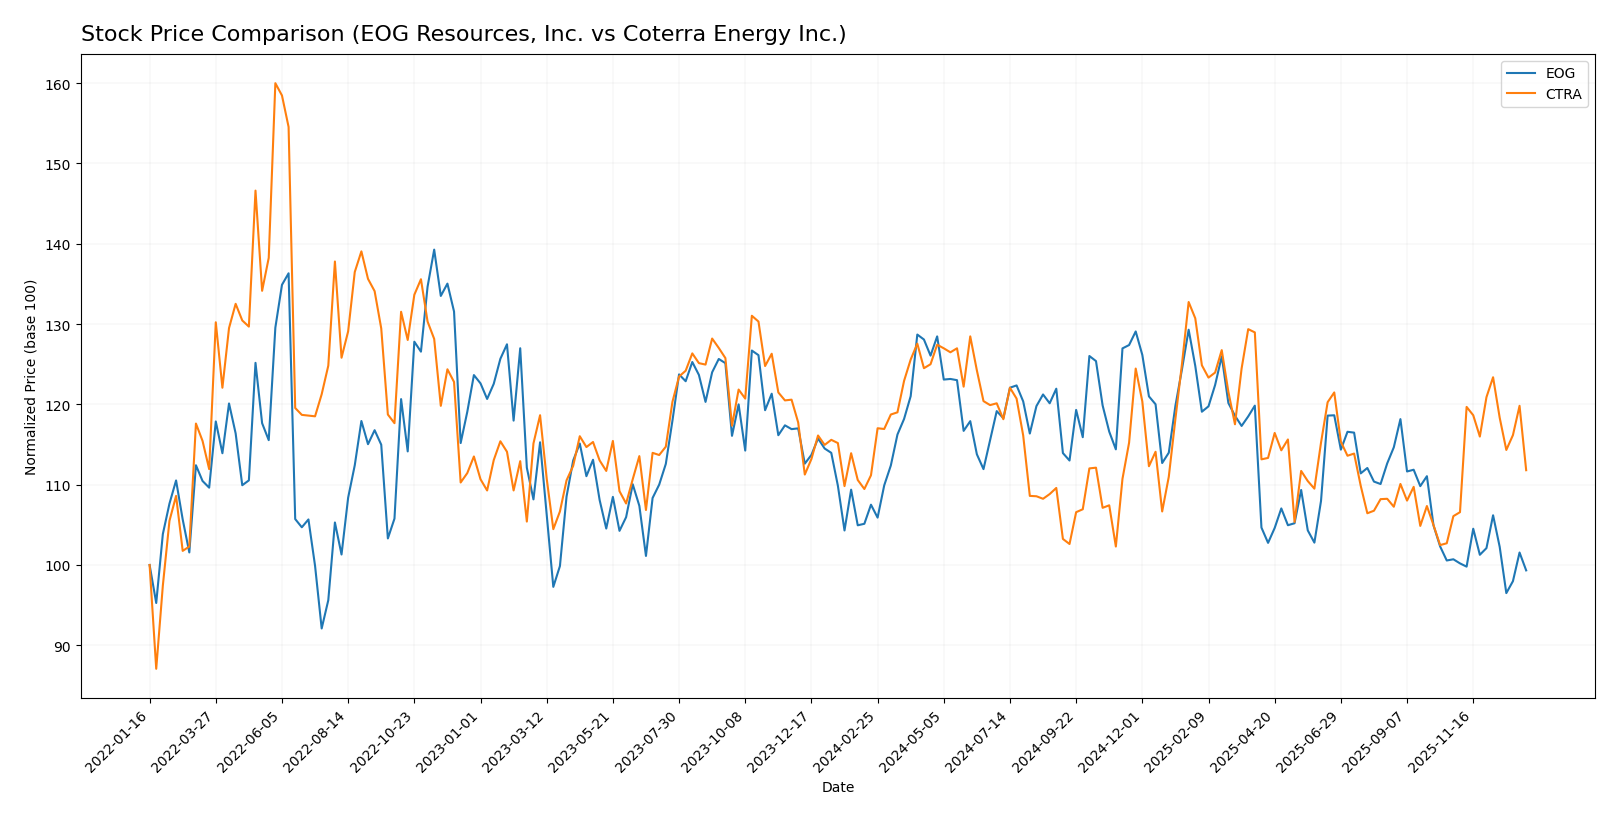
The stock price chart highlights significant movements and contrasting trading dynamics over the past 12 months, with EOG Resources showing a clear downward trajectory while Coterra Energy exhibits mild upward momentum.
Trend Analysis
EOG Resources, Inc. experienced a bearish trend over the past year with a price decline of -7.61%, showing acceleration in the downward movement and a high volatility level with an 8.9 standard deviation. The highest and lowest prices recorded were 136.58 and 101.93 respectively.
Coterra Energy Inc. demonstrated a bullish trend with a slight 0.57% price increase over the same period, accompanied by accelerating momentum and lower volatility at a 1.71 standard deviation. Its price fluctuated between 22.71 and 29.47.
Comparing both stocks, Coterra Energy delivered the highest market performance over the last year, maintaining a positive trend while EOG Resources faced a notable decline.
Target Prices
Analysts provide a clear target price consensus for both EOG Resources, Inc. and Coterra Energy Inc., indicating expected price ranges and averages.
| Company | Target High | Target Low | Consensus |
|---|---|---|---|
| EOG Resources, Inc. | 170 | 124 | 139.45 |
| Coterra Energy Inc. | 38 | 27 | 32.5 |
The target consensus for EOG Resources at 139.45 USD is significantly above its current price of 104.92 USD, suggesting potential upside. For Coterra Energy, the consensus price of 32.5 USD also exceeds its current price of 24.82 USD, indicating analyst optimism for future gains.
Analyst Opinions Comparison
This section compares analysts’ ratings and grades for EOG Resources, Inc. and Coterra Energy Inc.:
Rating Comparison
EOG Rating
- Rating: A- (Very Favorable)
- Discounted Cash Flow Score: 5, indicating very favorable valuation prospects.
- ROE Score: 5, showing very efficient profit generation from equity.
- ROA Score: 5, reflecting very effective asset utilization.
- Debt To Equity Score: 2, representing moderate financial risk.
- Overall Score: 4, denoting a favorable overall financial standing.
CTRA Rating
- Rating: A- (Very Favorable)
- Discounted Cash Flow Score: 5, indicating very favorable valuation prospects.
- ROE Score: 4, indicating favorable but lower efficiency in profit generation.
- ROA Score: 5, reflecting very effective asset utilization.
- Debt To Equity Score: 2, representing moderate financial risk.
- Overall Score: 4, denoting a favorable overall financial standing.
Which one is the best rated?
Both companies share the same overall rating of A- and a favorable overall score of 4. EOG has a higher ROE score, indicating more efficient equity use, while CTRA matches or closely trails EOG in other key metrics.
Scores Comparison
Here is a comparison of the Altman Z-Score and Piotroski Score for both companies:
EOG Scores
- Altman Z-Score: 3.34, indicating a safe zone with low bankruptcy risk.
- Piotroski Score: 5, reflecting average financial strength.
CTRA Scores
- Altman Z-Score: 2.30, indicating a grey zone with moderate bankruptcy risk.
- Piotroski Score: 6, reflecting average financial strength.
Which company has the best scores?
EOG has a higher Altman Z-Score, placing it in the safe zone, while CTRA is in the grey zone. CTRA’s Piotroski Score is slightly better, but both are rated average. Overall, EOG shows stronger bankruptcy safety.
Grades Comparison
Here is a comparison of the recent grades assigned to EOG Resources, Inc. and Coterra Energy Inc.:
EOG Resources, Inc. Grades
This table summarizes recent analyst grades and actions for EOG Resources, Inc.:
| Grading Company | Action | New Grade | Date |
|---|---|---|---|
| Bernstein | Maintain | Market Perform | 2026-01-05 |
| Citigroup | Maintain | Neutral | 2025-12-17 |
| Mizuho | Maintain | Neutral | 2025-12-12 |
| UBS | Maintain | Buy | 2025-12-12 |
| Piper Sandler | Maintain | Neutral | 2025-11-18 |
| Wells Fargo | Maintain | Overweight | 2025-11-11 |
| Piper Sandler | Maintain | Neutral | 2025-10-21 |
| Susquehanna | Maintain | Positive | 2025-10-20 |
| Wells Fargo | Maintain | Overweight | 2025-10-17 |
| Morgan Stanley | Maintain | Equal Weight | 2025-10-14 |
Overall, EOG Resources shows a stable trend with mostly neutral to positive grades and no recent downgrades.
Coterra Energy Inc. Grades
This table summarizes recent analyst grades and actions for Coterra Energy Inc.:
| Grading Company | Action | New Grade | Date |
|---|---|---|---|
| UBS | Maintain | Buy | 2025-12-12 |
| Piper Sandler | Maintain | Overweight | 2025-11-18 |
| Piper Sandler | Maintain | Overweight | 2025-10-21 |
| Susquehanna | Maintain | Positive | 2025-10-20 |
| UBS | Maintain | Buy | 2025-10-14 |
| Morgan Stanley | Maintain | Equal Weight | 2025-10-14 |
| Scotiabank | Maintain | Sector Outperform | 2025-10-09 |
| Mizuho | Maintain | Outperform | 2025-09-15 |
| Raymond James | Maintain | Outperform | 2025-09-11 |
| Piper Sandler | Maintain | Overweight | 2025-08-14 |
Coterra Energy exhibits a consistently positive grading trend, with multiple outperform and buy ratings maintained over recent months.
Which company has the best grades?
Both EOG Resources, Inc. and Coterra Energy Inc. hold a consensus “Buy” rating, but Coterra Energy has received a higher frequency of outperform and overweight grades, indicating stronger analyst confidence which may suggest comparatively higher growth expectations for investors.
Strengths and Weaknesses
Below is a comparative overview of key strengths and weaknesses for EOG Resources, Inc. (EOG) and Coterra Energy Inc. (CTRA) based on their recent financial and operational data.
| Criterion | EOG Resources, Inc. (EOG) | Coterra Energy Inc. (CTRA) |
|---|---|---|
| Diversification | Highly diversified product mix: oil, natural gas, liquids, and marketing segments | Less diversified, primarily focused on oil and condensate |
| Profitability | Strong profitability with 27.39% net margin and 21.82% ROE; very favorable ROIC | Moderate profitability with 20.53% net margin but lower ROE at 8.54%; neutral ROIC |
| Innovation | Demonstrates durable competitive advantage with growing ROIC (Very Favorable moat) | Improving ROIC but still slightly favorable moat; less clear innovation edge |
| Global presence | Large U.S. base with international operations, including Trinidad and Tobago | Mainly U.S.-focused with limited global footprint |
| Market Share | Significant market share in oil and gas production, with $13.9B in oil and condensate revenue | Smaller market share, $2.95B oil and condensate revenue in 2024 |
EOG Resources stands out with its diversified product portfolio, strong profitability, and a durable competitive advantage reflected in a very favorable moat rating. Coterra Energy is improving its profitability and operational efficiency but remains less diversified and has a smaller market presence, suggesting higher risk but potential for growth.
Risk Analysis
Below is a comparative risk table for EOG Resources, Inc. and Coterra Energy Inc. based on the most recent data from 2024-2026:
| Metric | EOG Resources, Inc. | Coterra Energy Inc. |
|---|---|---|
| Market Risk | Moderate (Beta 0.50) | Low (Beta 0.33) |
| Debt Level | Low (D/E 0.17) | Moderate (D/E 0.29) |
| Regulatory Risk | Moderate | Moderate |
| Operational Risk | Moderate | Moderate |
| Environmental Risk | Elevated (Oil & Gas sector exposure) | Elevated (Oil & Gas sector exposure) |
| Geopolitical Risk | Moderate (US & Trinidad exposure) | Moderate (US focus) |
EOG Resources shows stronger financial stability with low debt and favorable coverage ratios, reducing bankruptcy risk (Altman Z-score 3.34, safe zone). Coterra’s Z-score (2.30, grey zone) signals moderate financial risk. Both face significant environmental and regulatory pressures typical in oil & gas, with geopolitical risks linked to operational regions. Market volatility is higher for EOG given its broader asset base. Investors should weigh financial strength against sector-specific risks.
Which Stock to Choose?
EOG Resources, Inc. displays a favorable income evolution with a 136.76% revenue growth over 2020-2024 and robust profitability metrics, including a 27.39% net margin. Its financial ratios are mostly very favorable, supported by low debt levels and a strong A- rating, indicating solid financial health and efficient capital use.
Coterra Energy Inc. shows a favorable overall income trend with a 288.62% revenue growth in the same period but lower profitability, with a 20.53% net margin. Its financial ratios are favorable but include some unfavorable metrics, higher debt levels than EOG, and also an A- rating, reflecting moderate financial stability and improving profitability.
For investors, EOG might appear more attractive for those prioritizing strong profitability and efficient capital management, while Coterra could be seen as suitable for those favoring higher growth potential despite some financial risks. The choice could depend on an investor’s risk tolerance and preference for stability versus growth.
Disclaimer: Investment carries a risk of loss of initial capital. The past performance is not a reliable indicator of future results. Be sure to understand risks before making an investment decision.
Go Further
I encourage you to read the complete analyses of EOG Resources, Inc. and Coterra Energy Inc. to enhance your investment decisions: