In the competitive landscape of oil and gas exploration, Diamondback Energy, Inc. (FANG) and Coterra Energy Inc. (CTRA) stand out as prominent players. Both companies focus on unconventional resource development across key U.S. basins, sharing a commitment to innovation and operational efficiency. This article will delve into their strategies and financials to reveal which stock could be the most compelling addition to your investment portfolio today.
Table of contents
Companies Overview
I will begin the comparison between Diamondback Energy, Inc. and Coterra Energy Inc. by providing an overview of these two companies and their main differences.
Diamondback Energy Overview
Diamondback Energy, Inc. is an independent oil and natural gas company focused on acquiring, developing, and exploiting unconventional and onshore reserves in the Permian Basin, West Texas. It emphasizes the Midland and Delaware basins, holding approximately 525K gross acres and significant proved reserves. The company also operates midstream infrastructure, including pipelines and water systems, positioning itself as a key player in oil & gas exploration and production.
Coterra Energy Overview
Coterra Energy Inc. is an independent oil and gas company engaged in exploration, development, and production across several U.S. regions, including the Marcellus Shale, Permian Basin, and Anadarko Basin. It holds around 665K net acres and operates natural gas and saltwater disposal gathering systems. Coterra focuses on selling natural gas and liquids to diverse customers such as industrial clients and pipeline companies, reflecting a broad operational footprint in the energy sector.
Key similarities and differences
Both Diamondback and Coterra operate in the oil & gas exploration and production industry within the U.S., focusing on unconventional resources. Diamondback is more concentrated on the Permian Basin with a larger acreage position and midstream assets, while Coterra has a more diversified geographic presence including Marcellus and Anadarko Basins with an emphasis on natural gas. Both companies manage significant reserves but differ in scale, asset distribution, and customer base diversity.
Income Statement Comparison
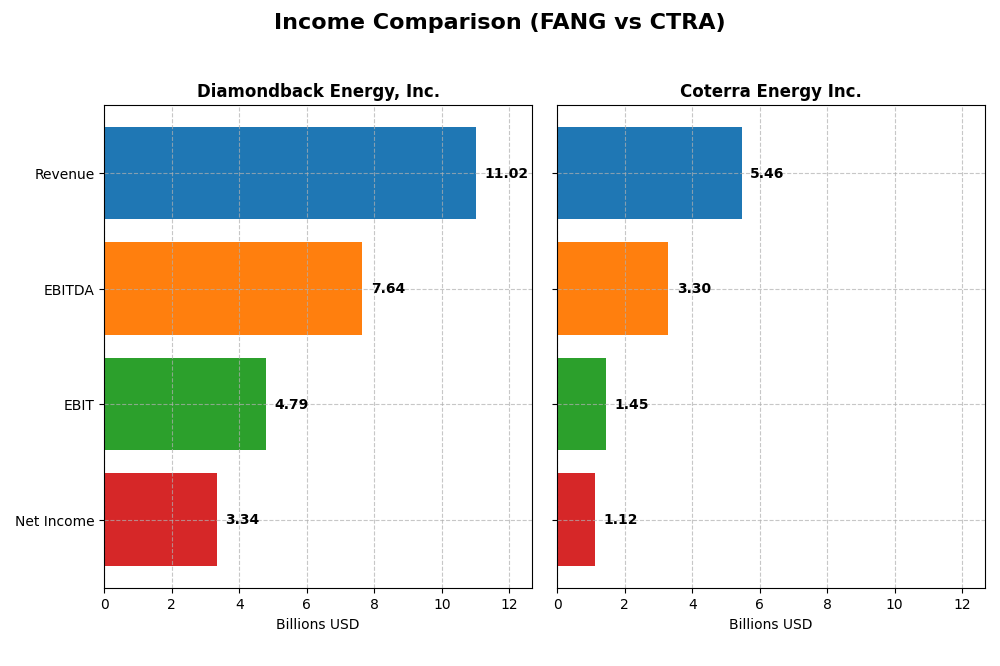
This table presents the key income statement metrics for Diamondback Energy, Inc. and Coterra Energy Inc. for the fiscal year 2024, providing a straightforward financial snapshot of both companies.
| Metric | Diamondback Energy, Inc. (FANG) | Coterra Energy Inc. (CTRA) |
|---|---|---|
| Market Cap | 42.9B | 18.9B |
| Revenue | 11.0B | 5.5B |
| EBITDA | 7.6B | 3.3B |
| EBIT | 4.8B | 1.5B |
| Net Income | 3.3B | 1.1B |
| EPS | 15.53 | 1.51 |
| Fiscal Year | 2024 | 2024 |
Income Statement Interpretations
Diamondback Energy, Inc.
Diamondback Energy showed strong revenue growth from 2020 to 2024, increasing from $2.8B to $11.0B, with net income rising notably from a loss in 2020 to $3.3B in 2024. Margins improved overall, with a gross margin around 45%, and EBIT margin favorable at 43%. However, in 2024, net margin declined by nearly 20%, reflecting margin pressure despite revenue growth.
Coterra Energy Inc.
Coterra Energy experienced revenue growth from $1.4B in 2020 to $5.5B in 2024 but faced a slight revenue decline of about 4% in the last year. Net income surged overall but fell to $1.1B in 2024 from $1.6B in 2023. Margins remained favorable, with gross margin near 31% and EBIT margin at 27%, yet recent year declines in profitability and EPS growth were unfavorable.
Which one has the stronger fundamentals?
Diamondback Energy exhibits stronger fundamentals overall, with higher margins and more consistent revenue and net income growth across the period. Coterra, while showing impressive overall net income growth, has recently experienced declines in revenue and profitability margins. Both maintain favorable income statements, but Diamondback’s margin stability and recent growth metrics appear more robust.
Financial Ratios Comparison
The table below presents a side-by-side comparison of key financial ratios for Diamondback Energy, Inc. (FANG) and Coterra Energy Inc. (CTRA) based on their most recent fiscal year data from 2024.
| Ratios | Diamondback Energy, Inc. (FANG) | Coterra Energy Inc. (CTRA) |
|---|---|---|
| ROE | 8.85% | 8.54% |
| ROIC | 5.75% | 5.62% |
| P/E | 10.48 | 16.91 |
| P/B | 0.93 | 1.44 |
| Current Ratio | 0.44 | 2.92 |
| Quick Ratio | 0.41 | 2.88 |
| D/E | 0.33 | 0.29 |
| Debt-to-Assets | 18.47% | 17.58% |
| Interest Coverage | 15.11 | 13.10 |
| Asset Turnover | 0.16 | 0.25 |
| Fixed Asset Turnover | 0.17 | 0.30 |
| Payout Ratio | 47.27% | 55.75% |
| Dividend Yield | 4.51% | 3.30% |
Interpretation of the Ratios
Diamondback Energy, Inc.
Diamondback Energy shows a generally favorable ratio profile with strong net margin (30.28%) and solid coverage ratios, though its return on equity (8.85%) and liquidity ratios (current ratio 0.44, quick ratio 0.41) appear weak. The dividend yield is attractive at 4.51%, indicating shareholder returns supported by a stable payout, but liquidity concerns could pose risks to sustaining dividends and buybacks.
Coterra Energy Inc.
Coterra Energy displays a favorable overall ratio set with good liquidity ratios (current ratio 2.92, quick ratio 2.88) and reasonable leverage (debt to equity 0.29). Its net margin (20.53%) and dividend yield (3.3%) are solid, though return on equity (8.54%) is also low. The company’s dividend appears sustainable given the coverage and cash flow, with fewer liquidity risks than its peer.
Which one has the best ratios?
Coterra Energy’s ratios are more balanced with stronger liquidity and fewer unfavorable metrics, while Diamondback’s higher net margin and dividend yield are somewhat offset by weaker liquidity and return on equity. Both companies maintain favorable global opinions, but Coterra’s lower risk profile in solvency and cash management could be viewed as more stable overall.
Strategic Positioning
This section compares the strategic positioning of Diamondback Energy, Inc. and Coterra Energy Inc., focusing on market position, key segments, and exposure to technological disruption:
Diamondback Energy, Inc.
- Strong presence in Permian Basin with 524,700 gross acres, facing competitive pressure in oil & gas E&P sector.
- Key focus on upstream oil and natural gas development, plus midstream infrastructure assets like pipelines and water systems.
- Exposure to technological disruption limited to conventional oil & gas exploration and midstream operations in established basins.
Coterra Energy Inc.
- Operates in Marcellus, Permian, and Anadarko Basins with 665,000 net acres, competing in a broad US market.
- Emphasis on oil, natural gas liquids, and natural gas sales with integrated natural gas and saltwater disposal gathering.
- Similar exposure with operations in shale plays and gas gathering but diversified across multiple basins and product types.
Diamondback Energy, Inc. vs Coterra Energy Inc. Positioning
Diamondback is concentrated mainly in the Permian Basin with integrated midstream assets, offering operational control but geographic concentration. Coterra is more diversified across basins and products, potentially spreading operational risk but managing more complex assets.
Which has the best competitive advantage?
Both companies show slightly favorable MOAT status with growing ROIC but are currently shedding value relative to WACC. Neither demonstrates a strong competitive advantage yet, though profitability trends are improving for both.
Stock Comparison
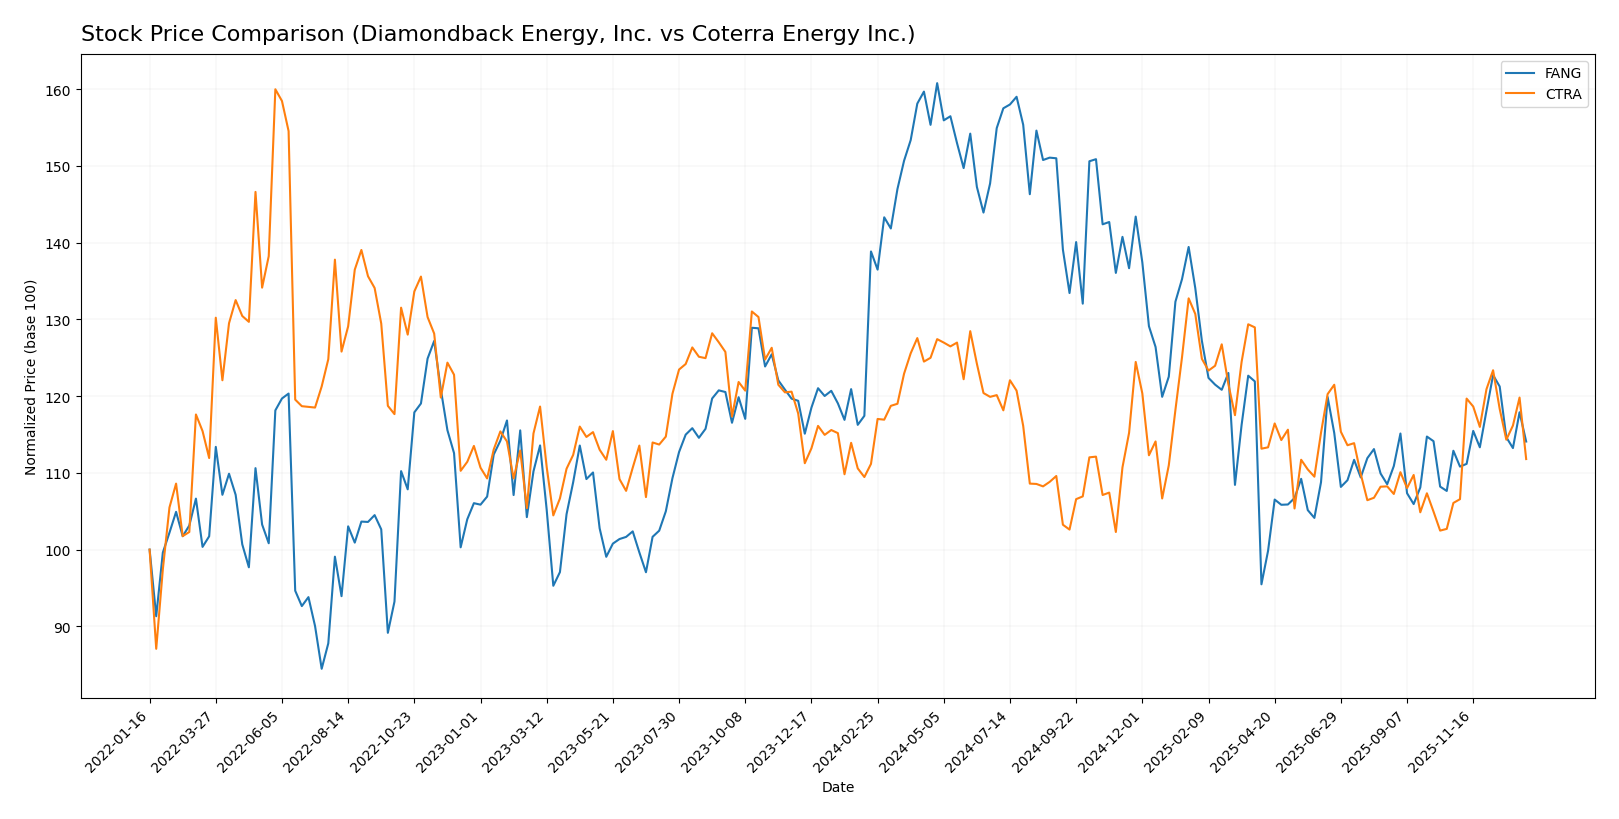
The past year has seen Diamondback Energy, Inc. (FANG) experience a notable decline, while Coterra Energy Inc. (CTRA) showed marginal gains with differing trading volumes and momentum patterns.
Trend Analysis
Diamondback Energy, Inc. (FANG) exhibited a bearish trend over the past 12 months with a price decline of 17.84%, accompanied by accelerating downward momentum and high volatility (std deviation 23.76). Recent months show a slight positive trend of 1.06%.
Coterra Energy Inc. (CTRA) maintained a bullish trend with a modest 0.57% price increase over the past year, supported by acceleration and lower volatility (std deviation 1.71). The recent trend strengthened, rising 5.39%, indicating continued positive momentum.
Comparatively, CTRA outperformed FANG with a positive overall price change, while FANG faced significant losses, marking CTRA as the higher performer in market price appreciation.
Target Prices
Analysts show a generally optimistic outlook with clear target price ranges for the featured energy companies.
| Company | Target High | Target Low | Consensus |
|---|---|---|---|
| Diamondback Energy, Inc. | 219 | 162 | 185.36 |
| Coterra Energy Inc. | 38 | 27 | 32.5 |
The consensus targets for Diamondback Energy and Coterra Energy suggest potential upside compared to their current prices of $147.41 and $24.82, respectively, indicating positive analyst expectations in the energy sector.
Analyst Opinions Comparison
This section compares analysts’ ratings and grades for Diamondback Energy, Inc. (FANG) and Coterra Energy Inc. (CTRA):
Rating Comparison
FANG Rating
- Rating: A-, rated Very Favorable by analysts.
- Discounted Cash Flow Score: 5, considered Very Favorable, indicating undervaluation potential.
- ROE Score: 4, Favorable efficiency in generating profit from equity.
- ROA Score: 4, Favorable asset utilization to generate earnings.
- Debt To Equity Score: 2, Moderate financial risk with some leverage.
- Overall Score: 4, Favorable financial standing.
CTRA Rating
- Rating: A-, rated Very Favorable by analysts.
- Discounted Cash Flow Score: 5, considered Very Favorable, indicating undervaluation potential.
- ROE Score: 4, Favorable efficiency in generating profit from equity.
- ROA Score: 5, Very Favorable asset utilization to generate earnings.
- Debt To Equity Score: 2, Moderate financial risk with some leverage.
- Overall Score: 4, Favorable financial standing.
Which one is the best rated?
Both companies share the same overall rating and score of A- and 4, respectively, with very favorable DCF and ROE scores. However, CTRA has a slightly higher ROA score, making its asset efficiency rating superior to FANG’s.
Scores Comparison
Here is a comparison of the Altman Z-Score and Piotroski Score for Diamondback Energy (FANG) and Coterra Energy (CTRA):
FANG Scores
- Altman Z-Score: 1.33, in the distress zone, indicating high bankruptcy risk.
- Piotroski Score: 5, average financial strength.
CTRA Scores
- Altman Z-Score: 2.30, in the grey zone, indicating moderate bankruptcy risk.
- Piotroski Score: 6, average financial strength.
Which company has the best scores?
CTRA shows a better Altman Z-Score in the grey zone compared to FANG’s distress zone, and also has a slightly higher Piotroski Score. Based on these scores alone, CTRA presents comparatively stronger financial indicators.
Grades Comparison
Here is a comparison of recent stock grades issued by reputable grading companies for both companies:
Diamondback Energy, Inc. Grades
The following table summarizes recent grades from recognized firms for Diamondback Energy, Inc.:
| Grading Company | Action | New Grade | Date |
|---|---|---|---|
| Wells Fargo | Maintain | Overweight | 2024-10-18 |
| Susquehanna | Maintain | Positive | 2024-10-18 |
| Keybanc | Maintain | Overweight | 2024-10-16 |
| Truist Securities | Maintain | Buy | 2024-10-16 |
| Piper Sandler | Maintain | Overweight | 2024-10-15 |
| Scotiabank | Maintain | Sector Outperform | 2024-10-10 |
| BMO Capital | Upgrade | Outperform | 2024-10-04 |
| Benchmark | Maintain | Buy | 2024-10-03 |
| Barclays | Upgrade | Overweight | 2024-10-02 |
| Wells Fargo | Maintain | Overweight | 2024-10-01 |
Overall, Diamondback Energy, Inc. has consistently received favorable grades, with multiple “Overweight,” “Buy,” and “Outperform” ratings, reflecting a predominantly positive outlook.
Coterra Energy Inc. Grades
Below is a summary of recent grades from established grading firms for Coterra Energy Inc.:
| Grading Company | Action | New Grade | Date |
|---|---|---|---|
| UBS | Maintain | Buy | 2025-12-12 |
| Piper Sandler | Maintain | Overweight | 2025-11-18 |
| Piper Sandler | Maintain | Overweight | 2025-10-21 |
| Susquehanna | Maintain | Positive | 2025-10-20 |
| UBS | Maintain | Buy | 2025-10-14 |
| Morgan Stanley | Maintain | Equal Weight | 2025-10-14 |
| Scotiabank | Maintain | Sector Outperform | 2025-10-09 |
| Mizuho | Maintain | Outperform | 2025-09-15 |
| Raymond James | Maintain | Outperform | 2025-09-11 |
| Piper Sandler | Maintain | Overweight | 2025-08-14 |
Coterra Energy Inc. maintains a generally positive grading trend, with most grades being “Buy,” “Overweight,” and “Outperform,” and a few “Equal Weight” ratings indicating a balanced market view.
Which company has the best grades?
Diamondback Energy, Inc. and Coterra Energy Inc. both receive predominantly positive grades from reputable firms, but Diamondback shows a slightly stronger consensus with more “Buy” and “Outperform” ratings and fewer “Hold” equivalents. This suggests investors might find Diamondback’s outlook more uniformly positive, while Coterra’s ratings reflect a somewhat more cautious but still favorable view.
Strengths and Weaknesses
Below is a comparison table highlighting the key strengths and weaknesses of Diamondback Energy, Inc. (FANG) and Coterra Energy Inc. (CTRA) based on the most recent data available.
| Criterion | Diamondback Energy, Inc. (FANG) | Coterra Energy Inc. (CTRA) |
|---|---|---|
| Diversification | Primarily focused on upstream services with limited midstream revenue (8.3B USD upstream in 2023, minimal midstream) | More diversified with significant oil & condensate and natural gas liquids revenue streams (3.0B USD oil & condensate in 2024 plus NGL) |
| Profitability | High net margin (30.28%), favorable PE (10.48), and dividend yield (4.51%) but lower ROE (8.85%) and neutral ROIC (5.75%) | Moderate net margin (20.53%) with neutral PE (16.91), favorable ROIC (5.62%), and solid liquidity ratios |
| Innovation | Limited data on innovation; asset turnover ratios are unfavorable indicating potential operational inefficiencies | Similar unfavorable asset turnover but better current and quick ratios suggest better working capital management |
| Global presence | Primarily focused on U.S. operations with no significant global footprint reported | Also predominantly U.S.-focused but with stronger balance sheet metrics and liquidity |
| Market Share | Strong position in upstream oil production but limited midstream exposure | Growing production volumes in oil and natural gas liquids with steady revenue growth |
Key takeaways: Both companies show slightly favorable profitability trends with growing ROIC but are still considered to be shedding value relative to capital costs. Diamondback Energy excels in net margins and dividend yield, while Coterra offers better liquidity and a more balanced revenue mix. Investors should weigh operational efficiency and diversification alongside profitability metrics.
Risk Analysis
Below is a comparative table summarizing key risks for Diamondback Energy, Inc. (FANG) and Coterra Energy Inc. (CTRA) based on the most recent data from 2024:
| Metric | Diamondback Energy, Inc. (FANG) | Coterra Energy Inc. (CTRA) |
|---|---|---|
| Market Risk | Moderate (Beta 0.58, oil price sensitivity) | Lower (Beta 0.33, more stable gas focus) |
| Debt Level | Moderate (Debt-to-Equity 0.33, interest coverage 16.5) | Moderate (Debt-to-Equity 0.29, interest coverage 13.7) |
| Regulatory Risk | High (Oil & gas sector with environmental regulations) | High (Similar sector exposure, shale gas focus) |
| Operational Risk | Moderate (Large acreage in Permian Basin, pipeline assets) | Moderate (Operations in Marcellus, Permian, Anadarko basins) |
| Environmental Risk | Elevated (Oil extraction impact, Permian Basin footprint) | Elevated (Gas production with environmental scrutiny) |
| Geopolitical Risk | Moderate (US domestic operations, some regional risks) | Moderate (US focused but diversified basins) |
The most likely and impactful risks for both companies stem from regulatory and environmental pressures due to evolving climate policies and the energy transition. Diamondback faces higher market risk given greater oil price volatility exposure, while Coterra’s diversified gas portfolio slightly mitigates market swings. Both have moderate debt, manageable operational risks, but remain vulnerable to tightening regulations and environmental challenges. Careful monitoring of policy changes and commodity prices is essential for risk management.
Which Stock to Choose?
Diamondback Energy, Inc. (FANG) shows a favorable income evolution with strong revenue and net income growth over 2020-2024, despite recent margin contractions. Its financial ratios are mostly favorable, with solid profitability and manageable debt, but liquidity ratios remain weak. The company holds a very favorable A- rating, though its Altman Z-score indicates financial distress risk.
Coterra Energy Inc. (CTRA) demonstrates a favorable income statement overall, but recent declines in revenue and profitability. Its financial ratios are more consistently favorable, particularly in liquidity and debt management, supported by a very favorable A- rating. The Altman Z-score places it in a grey zone, implying moderate financial risk.
Investors prioritizing growth and strong historical earnings expansion might find FANG’s profile appealing, while those valuing liquidity and more stable financial ratios could consider CTRA more favorable. Both companies show slightly favorable moat evaluations, indicating improving profitability but no clear competitive advantage yet.
Disclaimer: Investment carries a risk of loss of initial capital. The past performance is not a reliable indicator of future results. Be sure to understand risks before making an investment decision.
Go Further
I encourage you to read the complete analyses of Diamondback Energy, Inc. and Coterra Energy Inc. to enhance your investment decisions: