Devon Energy Corporation (DVN) and Coterra Energy Inc. (CTRA) are two prominent players in the U.S. oil and gas exploration and production sector. Both companies focus on extracting and developing natural resources with overlapping markets, yet they differ in asset concentration and operational scale. This comparison aims to highlight their strategic strengths and innovation approaches, helping you identify which stock better fits your investment portfolio in today’s energy landscape.
Table of contents
Companies Overview
I will begin the comparison between Devon Energy Corporation and Coterra Energy Inc. by providing an overview of these two companies and their main differences.
Devon Energy Corporation Overview
Devon Energy Corporation is an independent energy company focused on the exploration, development, and production of oil, natural gas, and natural gas liquids in the United States. Founded in 1971 and headquartered in Oklahoma City, OK, it operates about 5,134 gross wells. Devon is positioned as a significant player in the Oil & Gas Exploration & Production industry with a market cap of approximately $22.9B.
Coterra Energy Inc. Overview
Coterra Energy Inc. is an independent oil and gas company engaged in development, exploration, and production primarily within the U.S., with a strong focus on the Marcellus Shale and other key basins like Permian and Anadarko. Incorporated in 1989 and based in Houston, TX, Coterra has proved reserves near 2.9 million barrels of oil equivalent and a market cap of about $18.9B, emphasizing natural gas and liquids production.
Key similarities and differences
Both companies operate in the Oil & Gas Exploration & Production sector in the U.S., focusing on upstream activities such as exploration and production of oil, natural gas, and natural gas liquids. Devon operates a larger number of wells and has a higher market cap, while Coterra holds extensive acreage in major shale plays and manages gathering systems. Coterra’s business model highlights regional diversification and proved reserves, contrasting Devon’s broader operational scale.
Income Statement Comparison
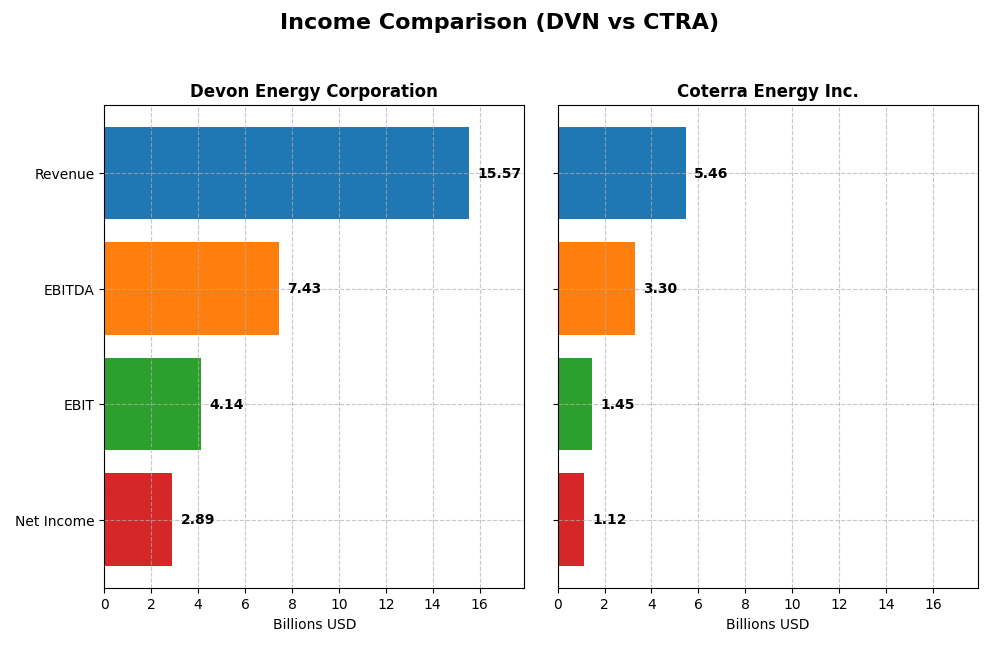
The table below compares the key income statement metrics of Devon Energy Corporation and Coterra Energy Inc. for the fiscal year 2024, providing a snapshot of their financial performance.
| Metric | Devon Energy Corporation (DVN) | Coterra Energy Inc. (CTRA) |
|---|---|---|
| Market Cap | 22.9B | 18.9B |
| Revenue | 15.57B | 5.46B |
| EBITDA | 7.43B | 3.30B |
| EBIT | 4.14B | 1.45B |
| Net Income | 2.89B | 1.12B |
| EPS | 4.57 | 1.51 |
| Fiscal Year | 2024 | 2024 |
Income Statement Interpretations
Devon Energy Corporation
Devon Energy’s revenue and net income showed strong overall growth from 2020 to 2024, with revenue increasing 258% and net income more than doubling. Margins remained favorable, with a gross margin of 27.43% and net margin near 18.6%. However, in 2024, revenue growth slowed to 2.8% and net income declined by 22%, reflecting margin compression and lower profitability.
Coterra Energy Inc.
Coterra Energy experienced a robust rise in revenue and net income over the 2020-2024 period, with revenue up nearly 289% and net income growing by 459%. The company maintained healthy margins, including a gross margin of 31% and a net margin of 20.5%. In 2024, both revenue and net income fell by approximately 4% and 29%, respectively, indicating a recent downturn in profitability.
Which one has the stronger fundamentals?
Both companies have a favorable global income statement evaluation with strong overall growth and healthy margins. Devon Energy shows solid margin stability but a slight slowdown in recent growth, while Coterra Energy boasts higher net income growth and margins but faced sharper declines in 2024. The fundamentals reflect strengths and weaknesses for each, requiring careful consideration of recent trends.
Financial Ratios Comparison
The table below presents a side-by-side comparison of key financial ratios for Devon Energy Corporation (DVN) and Coterra Energy Inc. (CTRA) based on their most recent fiscal year data from 2024.
| Ratios | Devon Energy Corporation (DVN) | Coterra Energy Inc. (CTRA) |
|---|---|---|
| ROE | 19.94% | 8.54% |
| ROIC | 10.80% | 5.62% |
| P/E | 7.05 | 16.91 |
| P/B | 1.41 | 1.44 |
| Current Ratio | 1.04 | 2.92 |
| Quick Ratio | 0.95 | 2.88 |
| D/E (Debt-to-Equity) | 0.63 | 0.29 |
| Debt-to-Assets | 30.18% | 17.58% |
| Interest Coverage | 9.40 | 13.10 |
| Asset Turnover | 0.51 | 0.25 |
| Fixed Asset Turnover | 0.61 | 0.30 |
| Payout ratio | 32.41% | 55.75% |
| Dividend yield | 4.60% | 3.30% |
Interpretation of the Ratios
Devon Energy Corporation
Devon Energy shows a majority of favorable financial ratios, including strong net margin at 18.57% and return on equity near 20%, reflecting solid profitability. Some ratios like fixed asset turnover are less favorable, suggesting potential efficiency issues. The company offers a healthy dividend yield of 4.6%, supported by a sustainable payout ratio and free cash flow coverage, though investors should watch capital expenditures.
Coterra Energy Inc.
Coterra Energy presents mostly favorable ratios, such as a robust net margin of 20.53% and a strong interest coverage ratio of 13.69, indicating good debt servicing ability. However, its return on equity is notably weaker at 8.54%, and asset turnover ratios are unfavorable, hinting at possible operational inefficiencies. The dividend yield stands at 3.3%, reflecting consistent shareholder returns alongside cautious debt management.
Which one has the best ratios?
Both companies have a favorable global ratios opinion, but Devon Energy exhibits stronger profitability metrics and a higher dividend yield, while Coterra Energy shows better liquidity and lower leverage. Devon’s unfavorable fixed asset turnover contrasts with Coterra’s weaker return on equity and asset utilization, making the choice dependent on specific financial priorities.
Strategic Positioning
This section compares the strategic positioning of Devon Energy Corporation and Coterra Energy Inc., focusing on Market position, Key segments, and Exposure to technological disruption:
Devon Energy Corporation
- Strong market position with significant competitive pressure in US oil and gas exploration.
- Diversified revenue from oil, natural gas, and natural gas liquids with extensive US operations.
- Limited explicit exposure to technological disruption noted in available data.
Coterra Energy Inc.
- Moderate market position focusing on specific shale plays with less competitive pressure.
- Concentrated on Marcellus Shale, Permian, and Anadarko basins with oil and natural gas sales.
- No clear exposure to technological disruption detailed in provided information.
Devon Energy Corporation vs Coterra Energy Inc. Positioning
Devon Energy shows a diversified approach with broad US operations and multiple product lines, while Coterra concentrates on key shale basins. Devon’s scale offers broader market coverage, whereas Coterra’s focus may limit diversification but allows niche specialization.
Which has the best competitive advantage?
Devon Energy demonstrates a very favorable moat with growing ROIC exceeding WACC, indicating durable competitive advantage and efficient capital use. Coterra shows slightly favorable moat status with growing ROIC but is still shedding value, reflecting a weaker competitive advantage.
Stock Comparison
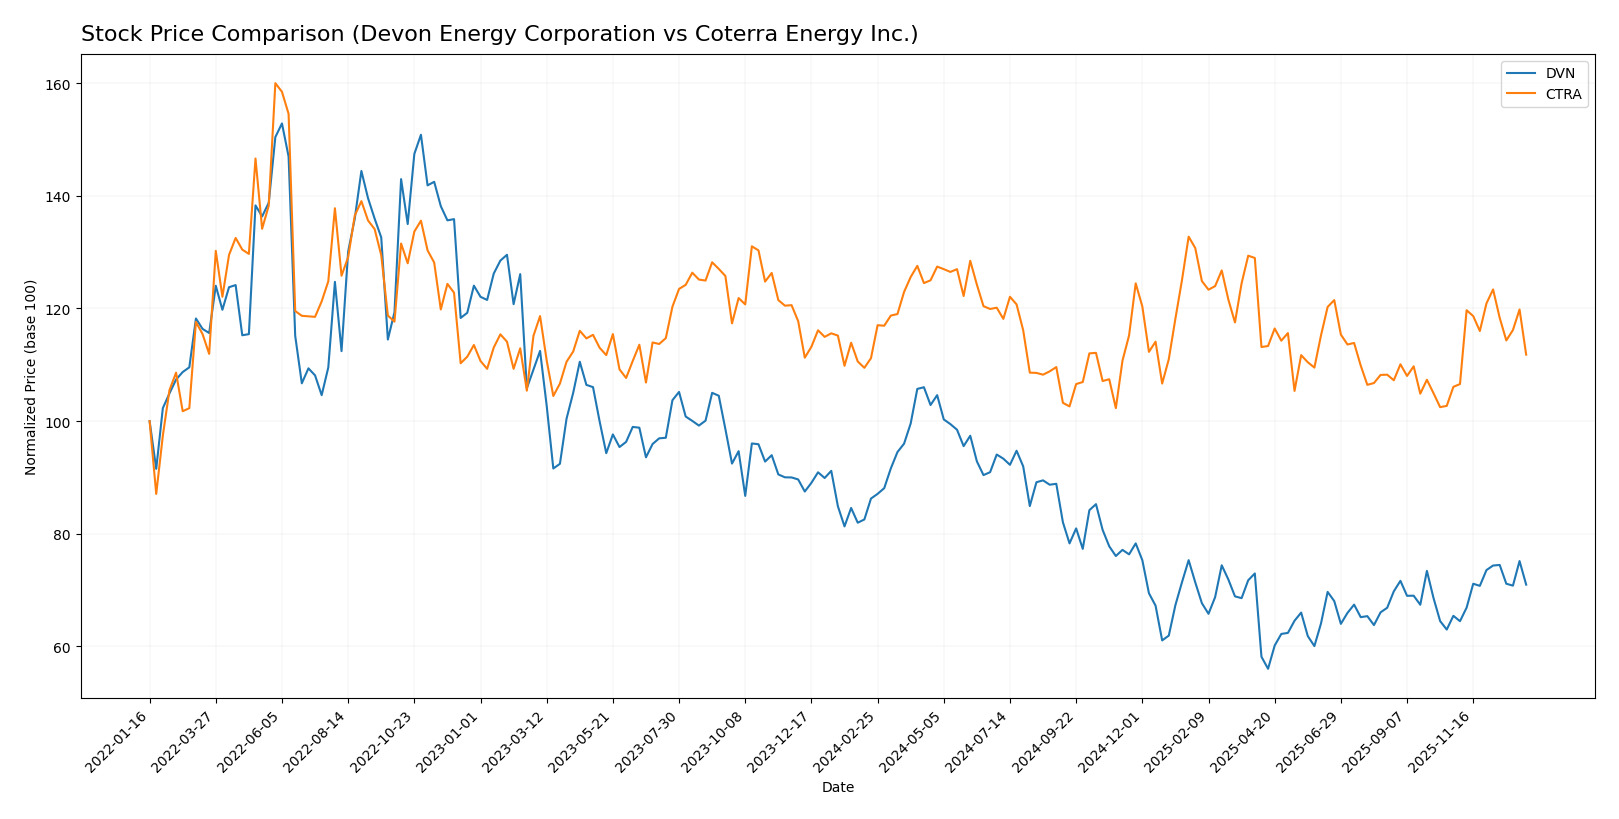
The stock price movements of Devon Energy Corporation and Coterra Energy Inc. over the past 12 months show contrasting trends, with Devon Energy experiencing a significant decline while Coterra Energy maintains a near-flat but slightly positive trajectory.
Trend Analysis
Devon Energy Corporation’s stock registered a bearish trend over the past year with a -17.72% price change, showing accelerating decline and a high volatility level (6.4 std deviation), reaching a low of 28.23. Recent months indicate a recovery with an 8.46% rise and lower volatility.
Coterra Energy Inc. displayed a marginally bullish trend with a 0.57% increase over the year, also accelerating but with notably lower volatility (1.71 std deviation). The recent period shows a 5.39% gain and steady upward momentum.
Comparing both, Devon Energy’s stock showed the highest volatility and largest overall loss despite recent rebound, while Coterra Energy delivered the highest market performance with a stable and modest positive return.
Target Prices
The current analyst consensus for target prices indicates moderate upside potential for both Devon Energy Corporation and Coterra Energy Inc.
| Company | Target High | Target Low | Consensus |
|---|---|---|---|
| Devon Energy Corporation | 48 | 40 | 43.5 |
| Coterra Energy Inc. | 38 | 27 | 32.5 |
Analysts expect Devon Energy’s price to rise from $35.76 to around $43.5 on average, while Coterra Energy’s consensus target of $32.5 suggests a significant potential increase from its current $24.82 price.
Analyst Opinions Comparison
This section compares analysts’ ratings and financial scores for Devon Energy Corporation (DVN) and Coterra Energy Inc. (CTRA):
Rating Comparison
DVN Rating
- Rating: A-, considered very favorable overall.
- Discounted Cash Flow Score: 4, indicating favorable valuation based on cash flow.
- ROE Score: 5, very favorable, showing excellent profit generation from equity.
- ROA Score: 5, very favorable, reflecting efficient asset utilization.
- Debt To Equity Score: 1, very unfavorable, signaling higher financial risk.
- Overall Score: 4, favorable overall financial standing.
CTRA Rating
- Rating: A-, considered very favorable overall.
- Discounted Cash Flow Score: 5, very favorable, suggesting stronger DCF valuation.
- ROE Score: 4, favorable, indicating good but slightly lower equity profit.
- ROA Score: 5, very favorable, also indicating effective asset use.
- Debt To Equity Score: 2, moderate, indicating somewhat lower financial risk.
- Overall Score: 4, favorable overall financial standing.
Which one is the best rated?
Both DVN and CTRA share the same overall rating of A- and an overall score of 4, reflecting favorable financial health. CTRA has a stronger discounted cash flow score and lower debt risk than DVN, while DVN shows better return on equity.
Scores Comparison
Here is a comparison of the financial scores for Devon Energy Corporation and Coterra Energy Inc.:
Devon Energy Corporation Scores
- Altman Z-Score: 2.29, classified in the grey zone, indicating moderate bankruptcy risk.
- Piotroski Score: 5, considered average financial strength and investment quality.
Coterra Energy Inc. Scores
- Altman Z-Score: 2.30, also in the grey zone, showing similar moderate bankruptcy risk.
- Piotroski Score: 6, slightly stronger than Devon, indicating average financial health.
Which company has the best scores?
Both companies have nearly identical Altman Z-Scores in the grey zone, indicating similar moderate bankruptcy risk. Coterra has a marginally higher Piotroski Score of 6 versus Devon’s 5, suggesting slightly stronger financial health for Coterra based on this score alone.
Grades Comparison
Here is a detailed comparison of the latest grades assigned to Devon Energy Corporation and Coterra Energy Inc.:
Devon Energy Corporation Grades
This table summarizes recent grades and rating actions from reputable grading companies for Devon Energy Corporation.
| Grading Company | Action | New Grade | Date |
|---|---|---|---|
| Bernstein | Maintain | Outperform | 2026-01-05 |
| Roth Capital | Maintain | Buy | 2025-12-31 |
| Citigroup | Maintain | Buy | 2025-12-17 |
| UBS | Upgrade | Buy | 2025-12-12 |
| Mizuho | Maintain | Outperform | 2025-12-12 |
| Morgan Stanley | Maintain | Overweight | 2025-12-11 |
| JP Morgan | Upgrade | Overweight | 2025-12-08 |
| Piper Sandler | Maintain | Overweight | 2025-11-18 |
| Susquehanna | Maintain | Positive | 2025-11-12 |
| Susquehanna | Maintain | Positive | 2025-10-20 |
The overall trend for Devon Energy is positive, with multiple upgrades and a consensus rating firmly at “Buy,” indicating confidence among analysts.
Coterra Energy Inc. Grades
This table summarizes recent grades and rating actions from reputable grading companies for Coterra Energy Inc.
| Grading Company | Action | New Grade | Date |
|---|---|---|---|
| UBS | Maintain | Buy | 2025-12-12 |
| Piper Sandler | Maintain | Overweight | 2025-11-18 |
| Piper Sandler | Maintain | Overweight | 2025-10-21 |
| Susquehanna | Maintain | Positive | 2025-10-20 |
| UBS | Maintain | Buy | 2025-10-14 |
| Morgan Stanley | Maintain | Equal Weight | 2025-10-14 |
| Scotiabank | Maintain | Sector Outperform | 2025-10-09 |
| Mizuho | Maintain | Outperform | 2025-09-15 |
| Raymond James | Maintain | Outperform | 2025-09-11 |
| Piper Sandler | Maintain | Overweight | 2025-08-14 |
Coterra Energy shows a stable and mostly positive rating profile, with no recent upgrades or downgrades, maintaining a “Buy” consensus.
Which company has the best grades?
Devon Energy Corporation holds slightly stronger grades with recent upgrades and a solid “Buy” consensus, whereas Coterra Energy maintains a consistent but less dynamic rating profile. This difference could influence investors’ perceptions of growth potential and risk.
Strengths and Weaknesses
Below is a comparison of key strengths and weaknesses for Devon Energy Corporation (DVN) and Coterra Energy Inc. (CTRA) based on the most recent financial and operational data.
| Criterion | Devon Energy Corporation (DVN) | Coterra Energy Inc. (CTRA) |
|---|---|---|
| Diversification | Focused on natural gas liquids (NGL) with strong U.S. operations; moderate diversification across energy products. | Primarily oil and condensate with some NGL exposure; less diversified product base. |
| Profitability | High net margin (18.57%), strong ROE (19.94%), ROIC (10.8%) well above WACC, indicating value creation. | Moderate net margin (20.53%) but lower ROE (8.54%) and ROIC (5.62%) close to WACC, indicating limited value creation. |
| Innovation | Evidence of efficient capital use with growing ROIC (+288%), signaling ongoing operational improvements. | Growing ROIC (+24.5%) but still close to cost of capital, suggesting early-stage profitability improvements. |
| Global presence | Primarily U.S. and Canadian markets; stable regional footprint but limited global reach. | Focused mainly in North America, limited global presence. |
| Market Share | Significant presence in NGL market with $11.18B in NGL sales (2024); strong asset base. | Smaller scale with $2.95B in oil and condensate sales (2024); less market penetration. |
In summary, Devon Energy shows stronger profitability and a durable competitive advantage with efficient capital use and substantial market share in NGL. Coterra Energy is improving profitability but remains less diversified and smaller in scale, suggesting more cautious investment consideration.
Risk Analysis
Below is a comparative risk assessment table for Devon Energy Corporation (DVN) and Coterra Energy Inc. (CTRA) based on the most recent data available for 2024-2026:
| Metric | Devon Energy Corporation (DVN) | Coterra Energy Inc. (CTRA) |
|---|---|---|
| Market Risk | Moderate (Beta 0.655) | Low (Beta 0.333) |
| Debt level | Moderate (Debt-to-Equity 0.63, Debt to Assets 30.18%) | Low (Debt-to-Equity 0.29, Debt to Assets 17.58%) |
| Regulatory Risk | Moderate (Oil & Gas sector regulations) | Moderate (Oil & Gas sector regulations) |
| Operational Risk | Moderate (5,134 wells, US operations) | Moderate (Diverse acreage: Marcellus, Permian, Anadarko) |
| Environmental Risk | Elevated (Energy production impact) | Elevated (Natural gas focus with environmental scrutiny) |
| Geopolitical Risk | Low (US-based operations) | Low (US-based operations) |
In summary, both companies face moderate regulatory and operational risks typical for the oil & gas sector, but Coterra’s lower debt level and lower market risk provide a margin of safety. Environmental risks remain significant for both due to increasing climate regulations. Devon’s moderate debt and beta suggest a balanced risk profile; however, investors should watch for regulatory changes impacting production costs and market demand.
Which Stock to Choose?
Devon Energy Corporation (DVN) shows a favorable income evolution over 2020–2024 with strong profitability indicators such as an 18.57% net margin and 19.94% ROE. Its debt levels are moderate with a net debt to EBITDA of 1.12, and it holds a very favorable overall rating (A-). The company demonstrates a very favorable economic moat with ROIC well above WACC and a growing trend.
Coterra Energy Inc. (CTRA) also exhibits favorable income metrics, including a 20.53% net margin, though with a lower 8.54% ROE. Debt ratios are comparatively lower, with net debt to EBITDA at 0.54, supporting a very favorable rating (A-). Its economic moat is slightly favorable, with ROIC close to WACC but showing improvement over time.
Investors prioritizing durable competitive advantage and stronger profitability metrics might view DVN more favorably due to its very favorable moat and higher returns. Conversely, those emphasizing lower leverage and steady income quality may find CTRA’s profile appealing given its favorable ratings and improving ROIC. Ultimately, the choice could depend on an investor’s risk tolerance and focus on growth versus stability.
Disclaimer: Investment carries a risk of loss of initial capital. The past performance is not a reliable indicator of future results. Be sure to understand risks before making an investment decision.
Go Further
I encourage you to read the complete analyses of Devon Energy Corporation and Coterra Energy Inc. to enhance your investment decisions: