Walmart Inc. and Costco Wholesale Corporation are two giants in the discount retail industry, both commanding significant market presence and offering diverse product ranges. They compete directly through physical stores and growing eCommerce platforms, each pushing innovation in membership models and supply chain efficiency. For investors seeking stability and growth in consumer defensives, understanding their differences is key. This analysis will help you identify which company holds the most promise for your portfolio.
Table of contents
Companies Overview
I will begin the comparison between Walmart and Costco by providing an overview of these two companies and their main differences.
Walmart Overview
Walmart Inc. operates globally through retail, wholesale, and eCommerce segments, serving consumers with a wide array of products including groceries, health and wellness items, apparel, electronics, and financial services. Founded in 1945 and based in Bentonville, Arkansas, Walmart is a leading player in the discount store industry with a market cap of approximately 940B USD and employs around 2.1M people worldwide.
Costco Overview
Costco Wholesale Corporation runs membership warehouses offering branded and private-label products across numerous merchandise categories such as groceries, appliances, apparel, and automotive care. Established in 1976 and headquartered in Issaquah, Washington, Costco has a market cap near 419B USD with 333K full-time employees. It operates 815 warehouses worldwide, focusing on membership-driven retail and eCommerce.
Key similarities and differences
Both Walmart and Costco operate in the discount stores sector, providing diverse product ranges including groceries and general merchandise. Walmart’s business model spans retail, wholesale, and a broader eCommerce presence, while Costco emphasizes membership warehouses with a strong focus on bulk sales and membership fees. Walmart employs significantly more staff and has a larger market cap, whereas Costco’s operations concentrate on fewer employees and a membership-centric approach.
Income Statement Comparison
Below is a side-by-side comparison of the latest fiscal year income statement metrics for Walmart Inc. and Costco Wholesale Corporation, illustrating their financial performance.

| Metric | Walmart Inc. (WMT) | Costco Wholesale Corporation (COST) |
|---|---|---|
| Market Cap | 941B | 419B |
| Revenue | 681B | 275B |
| EBITDA | 42B | 13.4B |
| EBIT | 29B | 11B |
| Net Income | 19.4B | 8.1B |
| EPS | 2.42 | 18.24 |
| Fiscal Year | 2025 | 2025 |
Income Statement Interpretations
Walmart Inc.
Walmart’s revenue and net income have steadily increased from 2021 to 2025, with revenue growing 21.79% overall and net income rising 43.86%. Gross margin remains favorable at 24.85%, while EBIT and net margins show neutral trends. The 2025 fiscal year saw a 5.07% revenue growth, an 18.37% EBIT increase, and a 19.26% net margin improvement, indicating stronger profitability despite slightly unfavorable operating expense growth.
Costco Wholesale Corporation
Costco’s income statement reveals robust growth, with revenue up 40.48% and net income rising 61.75% over the 2021-2025 period. Gross margin is neutral at 12.84%, and EBIT margin stands at 3.99%, also neutral. In 2025, revenue increased by 8.17%, EBIT grew 10.73%, and EPS rose nearly 10%, while net margin growth remained modest. Operating expenses grew in line with revenue, marking a slight unfavorable aspect.
Which one has the stronger fundamentals?
Both companies exhibit favorable income statement growth and solid fundamentals. Walmart shows stronger gross margins and significant net income growth, while Costco posts higher revenue and net income growth rates with efficient interest expense management. Walmart’s overall margin improvements contrast with Costco’s steadier margins. Each has a balanced mix of strengths and minor weaknesses, reflecting robust but distinct financial profiles.
Financial Ratios Comparison
The table below presents the most recent key financial ratios for Walmart Inc. and Costco Wholesale Corporation, facilitating a direct comparison of their performance metrics as of fiscal year 2025.
| Ratios | Walmart Inc. (WMT) | Costco Wholesale (COST) |
|---|---|---|
| ROE | 21.4% | 27.8% |
| ROIC | 13.1% | 19.3% |
| P/E | 40.6 | 51.7 |
| P/B | 8.67 | 14.4 |
| Current Ratio | 0.82 | 1.03 |
| Quick Ratio | 0.24 | 0.55 |
| D/E (Debt-to-Equity) | 0.66 | 0.28 |
| Debt-to-Assets | 23.0% | 10.6% |
| Interest Coverage | 10.8 | 67.4 |
| Asset Turnover | 2.61 | 3.57 |
| Fixed Asset Turnover | 4.87 | 7.95 |
| Payout Ratio | 34.4% | 26.9% |
| Dividend Yield | 0.85% | 0.52% |
Interpretation of the Ratios
Walmart Inc.
Walmart’s ratios present a mixed picture with strong returns on equity (21.36%) and invested capital (13.06%), alongside favorable debt-to-assets (23.05%) and interest coverage (10.64). However, concerns arise from a low current ratio (0.82), weak quick ratio (0.24), and overvalued price multiples (PE 40.61, PB 8.67). Dividend yield is modest at 0.85%, with payouts supported but relatively low, signaling cautious shareholder returns.
Costco Wholesale Corporation
Costco shows robust profitability with a high return on equity (27.77%) and return on invested capital (19.26%). The company maintains low leverage (debt-to-assets 10.6%) and excellent interest coverage (71.25), indicating strong financial health. Its current ratio is neutral (1.03), but the quick ratio is lower (0.55). Dividend yield stands at 0.52%, reflecting moderate shareholder returns balanced with solid cash flow.
Which one has the best ratios?
Both Walmart and Costco share a slightly favorable overall ratio profile, each with 50% favorable metrics. Walmart struggles with liquidity and valuation concerns, while Costco benefits from stronger returns and lower leverage but faces similar valuation and quick ratio challenges. The choice depends on investor priorities between stability, profitability, and liquidity metrics.
Strategic Positioning
This section compares the strategic positioning of Walmart Inc. and Costco Wholesale Corporation, focusing on Market position, Key segments, and disruption:
Walmart Inc.
- Leading global retailer with broad competitive pressure across retail segments.
- Diversified segments: Walmart U.S., Walmart International, Sam’s Club driving revenue.
- Exposure includes e-commerce and digital payment platforms amid retail technology shifts.
Costco Wholesale Corporation
- Major membership warehouse operator facing competition in discount retail.
- Concentrated on membership warehouses with food, fresh food, non-foods, and services.
- Operates online services and gas stations, adapting to retail technology changes.
Walmart Inc. vs Costco Wholesale Corporation Positioning
Walmart’s diversified geographic and segment approach contrasts with Costco’s focused membership warehouse model. Walmart benefits from multiple large revenue streams, while Costco relies heavily on membership and bulk sales, highlighting distinct operational scopes and market focuses.
Which has the best competitive advantage?
Both companies show a very favorable moat with growing ROIC above WACC, indicating durable competitive advantages. Costco’s higher ROIC spread suggests a slightly stronger value creation, but both maintain increasing profitability and efficient capital use.
Stock Comparison
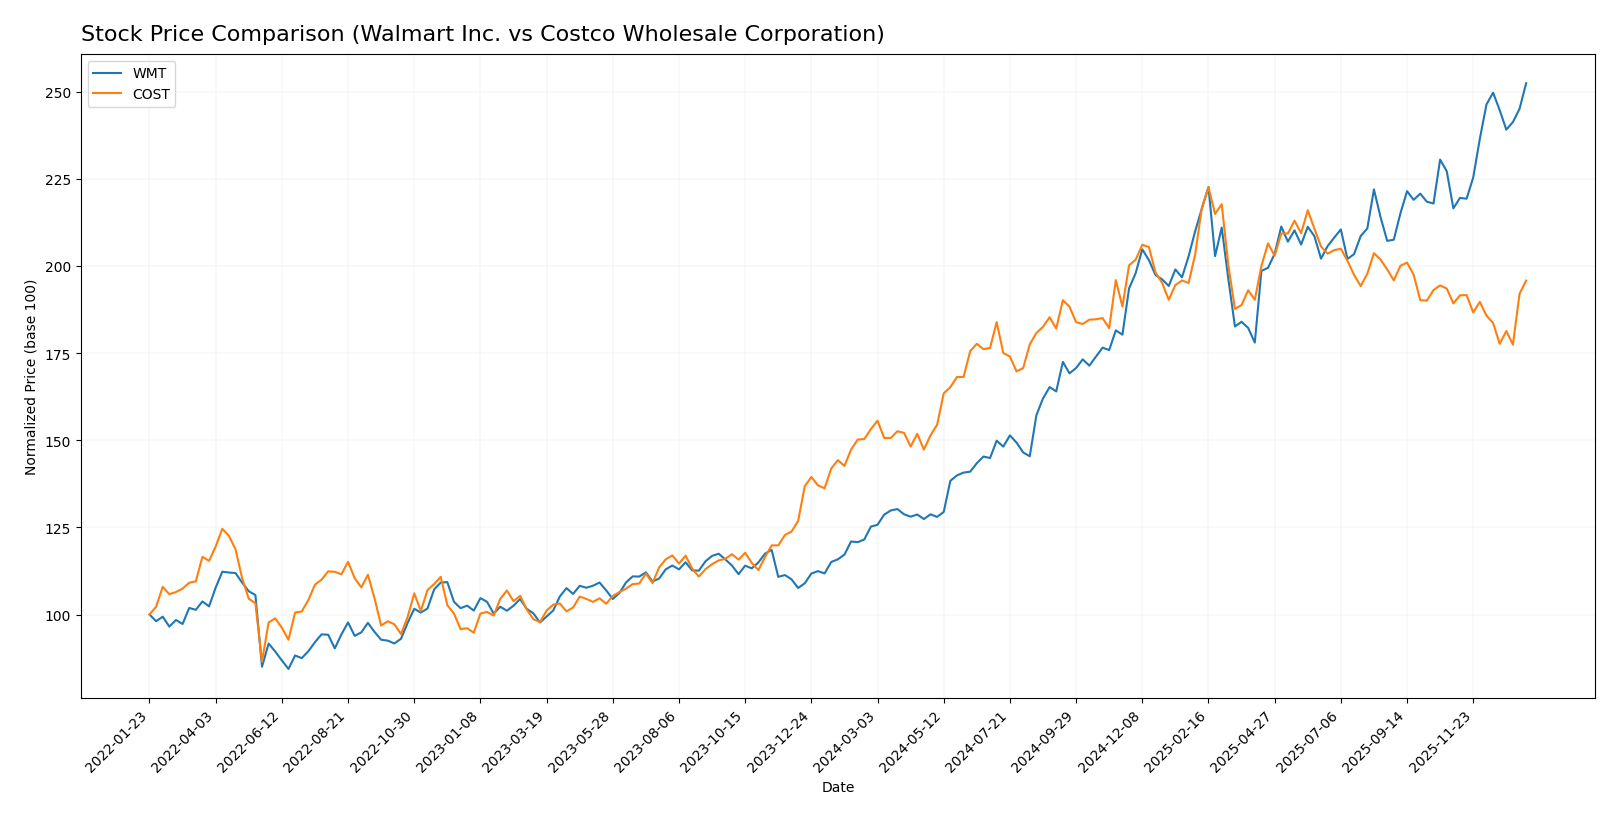
The past year saw significant price movements for Walmart Inc. and Costco Wholesale Corporation, with Walmart exhibiting strong acceleration in its bullish trend, while Costco’s growth showed signs of deceleration.
Trend Analysis
Walmart Inc. demonstrated a bullish trend over the past 12 months with a 101.59% price increase, accelerating momentum, and a volatility level indicated by a 16.45 std deviation. The stock fluctuated between 58.52 and 117.97.
Costco Wholesale Corporation also recorded a bullish trend, rising 27.8% over the same period, but with deceleration in growth and higher volatility at 84.58 std deviation. Prices ranged from 709.51 to 1071.85.
Comparatively, Walmart delivered the highest market performance, outpacing Costco’s gains by a wide margin during the analyzed timeframe.
Target Prices
The consensus target prices for Walmart Inc. and Costco Wholesale Corporation indicate moderate upside potential from current levels.
| Company | Target High | Target Low | Consensus |
|---|---|---|---|
| Walmart Inc. | 135 | 119 | 125.67 |
| Costco Wholesale Corp. | 1171 | 769 | 1025.08 |
Analysts expect Walmart’s stock to rise from $117.97 to around $125.67 on average, suggesting modest growth potential. Costco’s consensus target of $1025.08 also indicates upside from its $943.08 price, reflecting continued investor confidence.
Analyst Opinions Comparison
This section compares analysts’ ratings and financial scores for Walmart Inc. and Costco Wholesale Corporation:
Rating Comparison
Walmart Inc. Rating
- Rating: B- indicating a very favorable overall evaluation.
- Discounted Cash Flow Score: Moderate score of 2 suggests moderate valuation.
- ROE Score: Very favorable score of 5 shows strong profit generation from equity.
- ROA Score: Favorable score of 4 indicates effective asset utilization.
- Debt To Equity Score: Moderate score of 2 implies moderate financial risk.
- Overall Score: Moderate score of 3 shows average financial standing.
Costco Wholesale Corporation Rating
- Rating: B+ indicating a very favorable overall evaluation.
- Discounted Cash Flow Score: Moderate score of 3 indicates slightly better valuation.
- ROE Score: Very favorable score of 5 also reflects strong profit generation from equity.
- ROA Score: Very favorable score of 5 reflects highly effective asset utilization.
- Debt To Equity Score: Moderate score of 3 suggests moderate financial risk with slightly better balance.
- Overall Score: Moderate score of 3 shows average financial standing.
Which one is the best rated?
Based on the provided data, Costco holds a higher rating (B+) compared to Walmart’s B-. Costco also scores better in discounted cash flow, return on assets, and debt to equity, while both share the same overall score.
Scores Comparison
The scores comparison between Walmart Inc. and Costco Wholesale Corporation is as follows:
WMT Scores
- Altman Z-Score: 6.03, indicating a safe zone.
- Piotroski Score: 6, categorized as average.
COST Scores
- Altman Z-Score: 8.63, indicating a safe zone.
- Piotroski Score: 8, categorized as very strong.
Which company has the best scores?
Costco Wholesale Corporation has higher scores than Walmart Inc. in both the Altman Z-Score and Piotroski Score, indicating stronger financial stability and financial health based on the provided data.
Grades Comparison
Here is the comparison of recent stock grades and ratings for Walmart Inc. and Costco Wholesale Corporation:
Walmart Inc. Grades
The following table summarizes recent grades assigned to Walmart Inc. by reputable financial institutions:
| Grading Company | Action | New Grade | Date |
|---|---|---|---|
| Barclays | Maintain | Overweight | 2026-01-08 |
| Oppenheimer | Maintain | Outperform | 2026-01-08 |
| Mizuho | Maintain | Outperform | 2026-01-05 |
| Bernstein | Maintain | Outperform | 2026-01-05 |
| Wells Fargo | Maintain | Overweight | 2025-12-19 |
| Evercore ISI Group | Maintain | Outperform | 2025-12-16 |
| Evercore ISI Group | Maintain | Outperform | 2025-12-09 |
| Tigress Financial | Maintain | Buy | 2025-12-03 |
| BTIG | Maintain | Buy | 2025-11-21 |
| Morgan Stanley | Maintain | Overweight | 2025-11-21 |
Walmart’s grades consistently indicate a positive outlook, with most firms maintaining “Outperform” or “Overweight” ratings recently.
Costco Wholesale Corporation Grades
The table below shows recent grades provided to Costco Wholesale Corporation by verified grading firms:
| Grading Company | Action | New Grade | Date |
|---|---|---|---|
| Telsey Advisory Group | Maintain | Outperform | 2026-01-08 |
| Mizuho | Upgrade | Outperform | 2026-01-05 |
| Telsey Advisory Group | Maintain | Outperform | 2026-01-02 |
| Northcoast Research | Upgrade | Buy | 2025-12-24 |
| Wells Fargo | Maintain | Equal Weight | 2025-12-19 |
| Roth Capital | Downgrade | Sell | 2025-12-15 |
| JP Morgan | Maintain | Overweight | 2025-12-12 |
| Goldman Sachs | Maintain | Buy | 2025-12-12 |
| Baird | Maintain | Outperform | 2025-12-12 |
| Telsey Advisory Group | Maintain | Outperform | 2025-12-12 |
Costco exhibits mostly positive grades with several “Outperform” and “Buy” ratings, though a notable downgrade to “Sell” by Roth Capital introduces some divergence.
Which company has the best grades?
Both Walmart and Costco show predominantly favorable grades with “Buy,” “Outperform,” and “Overweight” ratings. Walmart’s grades are more uniformly positive with no downgrades, whereas Costco’s ratings include a wider range, including one downgrade to “Sell.” Investors might view Walmart’s consistent positive consensus as indicative of steadier analyst confidence, while Costco’s mixed grades could suggest varied market perspectives.
Strengths and Weaknesses
Below is a comparative analysis of Walmart Inc. and Costco Wholesale Corporation based on key criteria relevant to investors.
| Criterion | Walmart Inc. (WMT) | Costco Wholesale Corporation (COST) |
|---|---|---|
| Diversification | Strong: Revenue from Walmart U.S. (462B), Walmart International (122B), Sam’s Club (90B) | Moderate: Revenue mainly from Food and Sundries (110B), Non-Foods (71B), and Other segments (51B) |
| Profitability | Moderate net margin (2.85%, unfavorable); high ROE (21.36%, favorable) and ROIC (13.06%, favorable) | Moderate net margin (2.94%, unfavorable); higher ROE (27.77%, favorable) and ROIC (19.26%, favorable) |
| Innovation | Steady growth in ROIC (+43.5%), indicating efficient capital use and competitive advantage | Positive ROIC growth (+15.7%) with durable competitive advantage |
| Global presence | Extensive, with significant international revenue contribution (122B) | Primarily North America-focused, less international diversification |
| Market Share | Large share in discount retail with solid asset turnover (2.61) | Strong market share in warehouse club retail, higher asset turnover (3.57) |
Walmart demonstrates a highly diversified global footprint and strong efficiency in capital use, supported by a very favorable moat. Costco, while less diversified globally, excels in profitability metrics and operational efficiency, also showing a durable competitive advantage. Both companies offer slightly favorable financial ratios but present moderate net margins and elevated valuation multiples, warranting cautious consideration for risk management.
Risk Analysis
Below is a comparison table highlighting key risks for Walmart Inc. (WMT) and Costco Wholesale Corporation (COST) based on the most recent data from 2025:
| Metric | Walmart Inc. (WMT) | Costco Wholesale Corp. (COST) |
|---|---|---|
| Market Risk | Beta 0.66 (lower volatility) | Beta 1.01 (market average volatility) |
| Debt level | Debt-to-Equity 0.66 (neutral risk) | Debt-to-Equity 0.28 (low risk) |
| Regulatory Risk | Moderate (large US & global exposure) | Moderate (global footprint with regulatory compliance) |
| Operational Risk | High (complex operations, 2.1M employees) | Moderate (simpler warehouse model, 333K employees) |
| Environmental Risk | Moderate (supply chain emissions and waste) | Moderate (focus on sustainability in operations) |
| Geopolitical Risk | Moderate (diverse international exposure) | Moderate (presence in multiple countries, exposure to trade policies) |
Synthesis: Walmart faces higher operational risk due to its size and complexity, while Costco benefits from a simpler model and lower debt, reducing financial risk. Both have moderate regulatory and geopolitical risks given their international presence. Market risk is lower for Walmart due to its defensive beta, but Costco’s stronger financial health and very strong Piotroski score suggest better resilience. The most impactful risk for both remains market valuation pressures, as indicated by unfavorable P/E and P/B ratios.
Which Stock to Choose?
Walmart Inc. (WMT) shows favorable income growth with a 21.79% revenue increase over five years and a 43.86% net income rise. Financial ratios are slightly favorable overall, with strong returns on equity (21.36%) and capital (13.06%), moderate debt levels, and a very favorable B- rating.
Costco Wholesale Corporation (COST) demonstrates robust income growth, with a 40.48% revenue increase and 61.75% net income growth over five years. Its financial ratios are also slightly favorable, highlighted by superior ROE (27.77%) and ROIC (19.26%), lower debt ratios, and a very favorable B+ rating.
Investors focused on value creation and high returns might find Costco’s stronger income growth and higher profitability more appealing, while those valuing stability and balanced leverage could view Walmart’s consistent performance and moderate debt as advantageous. The choice could depend on the investor’s risk tolerance and preference for growth versus stability.
Disclaimer: Investment carries a risk of loss of initial capital. The past performance is not a reliable indicator of future results. Be sure to understand risks before making an investment decision.
Go Further
I encourage you to read the complete analyses of Walmart Inc. and Costco Wholesale Corporation to enhance your investment decisions: