Costco Wholesale Corporation and Target Corporation stand as two titans in the discount retail industry, each commanding significant market presence and customer loyalty. While both companies operate extensive store networks and emphasize value-driven offerings, their strategies diverge in innovation and service models. This comparison aims to uncover which company presents a more compelling opportunity for investors seeking stable growth and resilience in the consumer defensive sector. Let’s explore which stock deserves a place in your portfolio.

Table of contents
Companies Overview
I will begin the comparison between Costco Wholesale Corporation and Target Corporation by providing an overview of these two companies and their main differences.
Costco Overview
Costco Wholesale Corporation operates membership warehouses across multiple countries, offering a wide range of branded and private-label products including groceries, electronics, apparel, and automotive care. The company also provides ancillary services such as pharmacies, optical centers, and gas stations. Founded in 1976 and based in Issaquah, Washington, Costco is a major player in the discount store industry with a market cap of $419B.
Target Overview
Target Corporation is a general merchandise retailer in the United States, providing food assortments, apparel, home décor, electronics, and household essentials. It operates approximately 2,000 stores and offers in-store amenities like Target Café and Starbucks. Founded in 1902 and headquartered in Minneapolis, Minnesota, Target holds a market cap of $48.2B and serves customers through both physical stores and digital channels.
Key similarities and differences
Both Costco and Target operate in the discount store sector, focusing on a broad range of consumer goods and grocery items. Costco emphasizes a membership warehouse model with international operations and additional services like gas stations, while Target operates primarily in the U.S. with a general merchandise retail model and in-store amenities. Costco’s scale and global presence contrast with Target’s larger store count and emphasis on customer experience amenities.
Income Statement Comparison
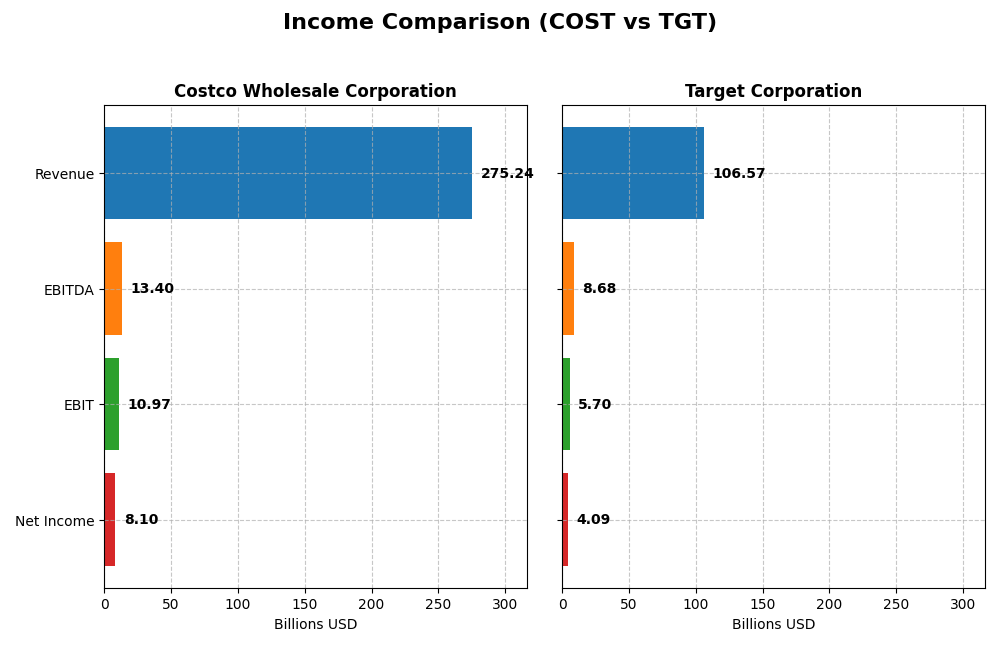
This table presents a side-by-side comparison of key income statement metrics for Costco Wholesale Corporation and Target Corporation for their most recent fiscal years.
| Metric | Costco Wholesale Corporation (2025) | Target Corporation (2024) |
|---|---|---|
| Market Cap | 419B | 48.2B |
| Revenue | 275.2B | 106.6B |
| EBITDA | 13.4B | 8.7B |
| EBIT | 11.0B | 5.7B |
| Net Income | 8.1B | 4.1B |
| EPS | 18.24 | 8.89 |
| Fiscal Year | 2025 | 2024 |
Income Statement Interpretations
Costco Wholesale Corporation
Costco exhibited consistent revenue growth from 2021 to 2025, increasing from $196B to $275B, with net income rising from $5B to $8.1B. Margins remained generally stable, with a slight improvement in net margin by 1.64% in 2025. The latest year showed favorable revenue growth of 8.17% and a strong 10.73% increase in EBIT, indicating solid operational performance.
Target Corporation
Target’s revenue grew modestly from $94B in 2020 to $107B in 2023 but declined slightly to $106.6B in 2024. Net income declined overall, falling from $4.4B in 2020 to $4.1B in 2024, with net margin slipping by 0.35% last year. The most recent fiscal year showed a small revenue drop of 0.79% and decreases in EBIT and EPS, reflecting some operational challenges.
Which one has the stronger fundamentals?
Costco’s income statement reflects robust growth, with positive momentum in revenue, net income, and margins, supported by a favorable evaluation in 64% of income metrics. Conversely, Target faces pressure with net income and margin declines and an unfavorable rating in 50% of key income indicators. Based solely on these figures, Costco demonstrates stronger income fundamentals over the evaluated periods.
Financial Ratios Comparison
The table below presents a side-by-side comparison of key financial ratios for Costco Wholesale Corporation (COST) and Target Corporation (TGT) based on their most recent fiscal year data.
| Ratios | Costco Wholesale Corporation (2025) | Target Corporation (2024) |
|---|---|---|
| ROE | 27.8% | 27.9% |
| ROIC | 19.3% | 11.2% |
| P/E | 51.7 | 15.5 |
| P/B | 14.4 | 4.3 |
| Current Ratio | 1.03 | 0.94 |
| Quick Ratio | 0.55 | 0.32 |
| D/E (Debt-to-Equity) | 0.28 | 1.36 |
| Debt-to-Assets | 10.6% | 34.4% |
| Interest Coverage | 67.4 | 13.7 |
| Asset Turnover | 3.57 | 1.84 |
| Fixed Asset Turnover | 7.95 | 2.90 |
| Payout Ratio | 27.0% | 50.0% |
| Dividend Yield | 0.52% | 3.22% |
Interpretation of the Ratios
Costco Wholesale Corporation
Costco displays a mixed ratio profile with strong returns on equity (27.77%) and invested capital (19.26%), alongside favorable leverage metrics such as debt-to-equity at 0.28 and interest coverage of 71.25. However, valuation ratios like P/E (51.71) and P/B (14.36) appear stretched, and liquidity signals are weaker, notably the quick ratio of 0.55. Dividend yield is modest at 0.52%, supported by a consistent dividend payout, though the yield is on the lower side, reflecting conservative shareholder returns.
Target Corporation
Target exhibits solid profitability with a return on equity of 27.89% and a favorable net margin of 3.84%. Its capital structure is more leveraged, with debt-to-equity at 1.36 and neutral debt-to-assets of 34.4%. Liquidity ratios are below one, indicating potential short-term risks. The company offers a higher dividend yield of 3.22%, supported by sustainable payout ratios, while valuation multiples such as P/E (15.52) remain reasonable compared to Costco, suggesting balanced shareholder returns.
Which one has the best ratios?
Both companies have slightly favorable overall ratio evaluations, with Costco excelling in profitability and low leverage, but facing stretched valuations and weaker liquidity. Target offers a better dividend yield and more moderate valuation, though its higher leverage and weaker liquidity ratios present concerns. The decision depends on the investor’s focus on either stronger returns and balance sheet strength or higher income with moderate valuation.
Strategic Positioning
This section compares the strategic positioning of Costco and Target, including market position, key segments, and exposure to disruption:
Costco
- Leading membership warehouse operator with 815 stores globally; faces competition in discount retail.
- Diverse product mix: Food, Fresh Food, Non-Foods, Other, Membership fees drive growth.
- Limited specific mention of technological disruption exposure.
Target
- Operates ~2,000 U.S. general merchandise stores; competes in broad discount retail market.
- Key segments include Apparel, Beauty, Food & Beverage, Home Furnishings, and Credit Card income.
- No explicit data on technological disruption exposure provided.
Costco vs Target Positioning
Costco focuses on a membership warehouse model with diversified product categories and international presence, while Target operates a concentrated U.S. general merchandise retail business with varied product lines and services. Each approach has scale and segment concentration implications.
Which has the best competitive advantage?
Costco demonstrates a very favorable moat with growing ROIC and strong value creation, indicating durable competitive advantage, while Target shows a slightly favorable moat with declining ROIC, suggesting weaker competitive sustainability.
Stock Comparison
The stock prices of Costco Wholesale Corporation and Target Corporation have demonstrated contrasting movements over the past 12 months, with Costco showing strong gains and Target experiencing significant declines alongside distinct trading volume dynamics.

Trend Analysis
Costco Wholesale Corporation’s stock posted a 27.8% increase over the past year, indicating a bullish trend with deceleration in momentum; its price fluctuated between 709.51 and 1071.85, with high volatility (std dev 84.58).
Target Corporation’s stock declined by 29.93% over the same period, reflecting a bearish trend with accelerating downside; prices ranged from 85.53 to 177.21, showing moderate volatility (std dev 27.68).
Comparing both, Costco clearly delivered the higher market performance over the past year, with a robust positive return contrasting Target’s substantial losses despite recent short-term recovery signs.
Target Prices
Analysts provide a clear consensus on target prices for Costco Wholesale Corporation and Target Corporation.
| Company | Target High | Target Low | Consensus |
|---|---|---|---|
| Costco Wholesale Corporation | 1171 | 769 | 1025.08 |
| Target Corporation | 120 | 80 | 96.14 |
The consensus target price for Costco at 1025.08 suggests a potential upside from the current price of 943.08, indicating moderate growth expectations. For Target, the consensus target of 96.14 is below the current price of 106.15, implying cautious or slightly bearish sentiment among analysts.
Analyst Opinions Comparison
This section compares analysts’ ratings and grades for Costco Wholesale Corporation and Target Corporation:
Rating Comparison
Costco Rating
- Rating: B+, considered Very Favorable.
- Discounted Cash Flow Score: 3, indicating a Moderate valuation.
- ROE Score: 5, reflecting Very Favorable efficiency in generating profit.
- ROA Score: 5, showing Very Favorable asset utilization.
- Debt To Equity Score: 3, indicating Moderate financial risk.
- Overall Score: 3, corresponding to a Moderate overall rating.
Target Rating
- Rating: B+, considered Very Favorable.
- Discounted Cash Flow Score: 4, indicating a Favorable valuation.
- ROE Score: 5, reflecting Very Favorable efficiency in generating profit.
- ROA Score: 4, showing Favorable asset utilization.
- Debt To Equity Score: 1, indicating Very Unfavorable financial risk.
- Overall Score: 3, corresponding to a Moderate overall rating.
Which one is the best rated?
Both companies share the same overall rating and ROE score, but Target has a better discounted cash flow score, while Costco shows stronger asset utilization and a more balanced debt-to-equity score. Overall ratings are equal at a moderate level.
Scores Comparison
The scores comparison between Costco and Target highlights their financial health and bankruptcy risk:
Costco Scores
- Altman Z-Score: 8.63, indicating a safe zone with low bankruptcy risk.
- Piotroski Score: 8, classified as very strong financial health.
Target Scores
- Altman Z-Score: 2.89, placing Target in the grey zone with moderate bankruptcy risk.
- Piotroski Score: 7, indicating strong but slightly lower financial health.
Which company has the best scores?
Costco exhibits stronger financial health with a higher Altman Z-Score in the safe zone and a very strong Piotroski Score. Target’s scores, while solid, fall into the grey zone and a slightly lower Piotroski category.
Grades Comparison
Here is the comparison of recent analyst grades and consensus ratings for Costco Wholesale Corporation and Target Corporation:
Costco Wholesale Corporation Grades
The following table summarizes recent grades assigned by recognized grading companies for Costco:
| Grading Company | Action | New Grade | Date |
|---|---|---|---|
| Telsey Advisory Group | Maintain | Outperform | 2026-01-08 |
| Mizuho | Upgrade | Outperform | 2026-01-05 |
| Telsey Advisory Group | Maintain | Outperform | 2026-01-02 |
| Northcoast Research | Upgrade | Buy | 2025-12-24 |
| Wells Fargo | Maintain | Equal Weight | 2025-12-19 |
| Roth Capital | Downgrade | Sell | 2025-12-15 |
| JP Morgan | Maintain | Overweight | 2025-12-12 |
| Goldman Sachs | Maintain | Buy | 2025-12-12 |
| Baird | Maintain | Outperform | 2025-12-12 |
| Telsey Advisory Group | Maintain | Outperform | 2025-12-12 |
Overall, Costco’s grades show a predominantly positive trend, with multiple upgrades and several “Outperform” and “Buy” ratings, though one downgrade to “Sell” was noted.
Target Corporation Grades
The following table presents recent grades assigned by recognized grading companies for Target:
| Grading Company | Action | New Grade | Date |
|---|---|---|---|
| Wolfe Research | Maintain | Underperform | 2025-12-30 |
| Evercore ISI Group | Maintain | In Line | 2025-12-09 |
| Argus Research | Maintain | Buy | 2025-12-01 |
| Bernstein | Maintain | Underperform | 2025-11-20 |
| Evercore ISI Group | Maintain | In Line | 2025-11-20 |
| Roth Capital | Maintain | Neutral | 2025-11-20 |
| B of A Securities | Maintain | Underperform | 2025-11-20 |
| Mizuho | Maintain | Neutral | 2025-11-20 |
| Piper Sandler | Maintain | Neutral | 2025-11-20 |
| Citigroup | Maintain | Neutral | 2025-11-20 |
Target’s grades mostly indicate a cautious stance, with several “Underperform” ratings and a consensus leaning toward “Hold.”
Which company has the best grades?
Costco has received stronger grades overall, with more frequent “Buy” and “Outperform” ratings compared to Target’s prevalence of “Neutral” and “Underperform” grades. This difference may influence investors’ perceptions of relative growth and risk profiles.
Strengths and Weaknesses
Below is a comparison of key strengths and weaknesses for Costco Wholesale Corporation (COST) and Target Corporation (TGT) based on the latest available data.
| Criterion | Costco Wholesale Corporation (COST) | Target Corporation (TGT) |
|---|---|---|
| Diversification | Strong product diversification with major revenue from Food & Sundries ($109.6B), Fresh Food ($38B), Non-Foods ($71.2B), and Membership fees ($5.3B) | Broad product mix including Apparel, Beauty, Food & Beverage, Home Furnishings; less revenue concentration in any single category |
| Profitability | High ROIC (19.3%) and ROE (27.8%), but low net margin (2.94%) and high valuation multiples (PE 51.7, PB 14.4) | Moderate ROIC (11.3%) and ROE (27.9%), better net margin (3.84%), lower valuation (PE 15.5, PB 4.3) |
| Innovation | Consistent growth in ROIC indicating durable competitive advantage and efficient capital use | Creating value but ROIC declining over recent years, indicating challenges in maintaining profitability |
| Global presence | Strong U.S. and global presence with stable membership model supporting growth | Primarily U.S. focused with extensive retail footprint, innovation in services like credit card partnerships |
| Market Share | Leading position in wholesale club retailing with robust asset turnover (3.57) and low debt levels (D/E 0.28) | Strong retail market share in general merchandise but higher leverage (D/E 1.36) and weaker liquidity ratios |
In summary, Costco demonstrates a very favorable moat with growing profitability and efficient capital management, although its valuation is high and margins are thin. Target shows solid value creation but faces profitability pressure and higher financial risk. Investors should weigh Costco’s durable competitive edge against Target’s broader product offering and better margin profile when making portfolio decisions.
Risk Analysis
Below is a comparative analysis of key risks for Costco Wholesale Corporation (COST) and Target Corporation (TGT) based on the most recent data available:
| Metric | Costco Wholesale Corporation (COST) | Target Corporation (TGT) |
|---|---|---|
| Market Risk | Beta 1.01, moderate volatility | Beta 1.12, slightly higher volatility |
| Debt level | Low debt-to-equity (0.28), favorable | High debt-to-equity (1.36), unfavorable |
| Regulatory Risk | Moderate, operates in multiple countries with varying regulations | Moderate, primarily US-focused but subject to evolving retail regulations |
| Operational Risk | Large global supply chain; efficient asset turnover (3.57) but quick ratio is low (0.55) | Complex operations with many stores; lower asset turnover (1.84) and weaker liquidity (quick ratio 0.32) |
| Environmental Risk | Moderate, increasing focus on sustainability in retail | Moderate, committed to sustainability but faces challenges in waste and energy use |
| Geopolitical Risk | Exposure to international markets including Asia and Europe | Mostly US operations, less geopolitical exposure but sensitive to domestic policy changes |
Costco’s most impactful risks are its valuation metrics and moderate liquidity, while Target faces higher financial risk due to its elevated debt levels and weaker liquidity ratios. Both companies are in relatively stable positions but investors should monitor Target’s leverage and Costco’s premium valuation.
Which Stock to Choose?
Costco Wholesale Corporation (COST) exhibits strong income growth with a 40.48% revenue increase over five years and favorable profitability metrics such as a 27.77% ROE and 19.26% ROIC. Its debt levels are low and well-managed, reflected in a favorable debt-to-equity ratio and a high interest coverage ratio. The company holds a very favorable moat rating and a B+ overall rating, supported by very strong Altman Z and Piotroski scores.
Target Corporation (TGT) shows a less favorable income trend, with a 0.79% revenue decline last year and a negative net income growth over the overall period. Profitability remains decent with a 27.89% ROE but a lower 11.25% ROIC and higher debt levels, indicated by an unfavorable debt-to-equity ratio and moderate interest coverage. Its moat rating is slightly favorable, and it shares the same B+ rating as COST but with a lower safety margin in Altman Z and Piotroski scores.
Investors focused on sustained value creation and financial stability might find Costco’s durable competitive advantage and income growth appealing, while those more tolerant to risk and seeking potential turnaround opportunities could interpret Target’s improving recent price trend and moderate ratings as a point of interest. The choice could thus depend on an investor’s preference for growth and defensibility versus risk and recovery potential.
Disclaimer: Investment carries a risk of loss of initial capital. The past performance is not a reliable indicator of future results. Be sure to understand risks before making an investment decision.
Go Further
I encourage you to read the complete analyses of Costco Wholesale Corporation and Target Corporation to enhance your investment decisions: