In the competitive world of discount retail, Costco Wholesale Corporation and Dollar Tree, Inc. stand out as prominent players with distinct approaches to value and customer reach. Both companies operate in the discount stores industry, yet they differ in scale, product strategies, and innovation in retail formats. This article will explore their strengths and challenges to help you decide which company presents the most compelling investment opportunity today.
Table of contents
Companies Overview
I will begin the comparison between Costco Wholesale Corporation and Dollar Tree, Inc. by providing an overview of these two companies and their main differences.
Costco Wholesale Corporation Overview
Costco Wholesale Corporation operates membership warehouses across multiple countries, including the US, Canada, and several in Europe and Asia. The company offers a wide range of branded and private-label products, from groceries and apparel to electronics and automotive care. It also provides various services such as pharmacies, optical centers, and e-commerce platforms, positioning itself as a comprehensive retail wholesaler.
Dollar Tree, Inc. Overview
Dollar Tree, Inc. runs discount variety retail stores under two main segments: Dollar Tree and Family Dollar. The Dollar Tree segment sells fixed-price merchandise primarily at $1.25, including consumables and seasonal goods. Family Dollar offers a broader range of products such as food, apparel, and household items at discount prices. The company operates thousands of stores mainly in the US and Canada, focusing on value retailing with extensive distribution centers.
Key similarities and differences
Both companies operate in the discount retail industry and target value-conscious consumers, but Costco focuses on a membership warehouse model offering bulk goods and services, while Dollar Tree emphasizes fixed-price and general merchandise retail stores. Costco’s international presence and diversified service offerings contrast with Dollar Tree’s concentration on discount variety stores and segmented brand strategy. Employee counts and market caps also differ significantly, reflecting their scale variations.
Income Statement Comparison
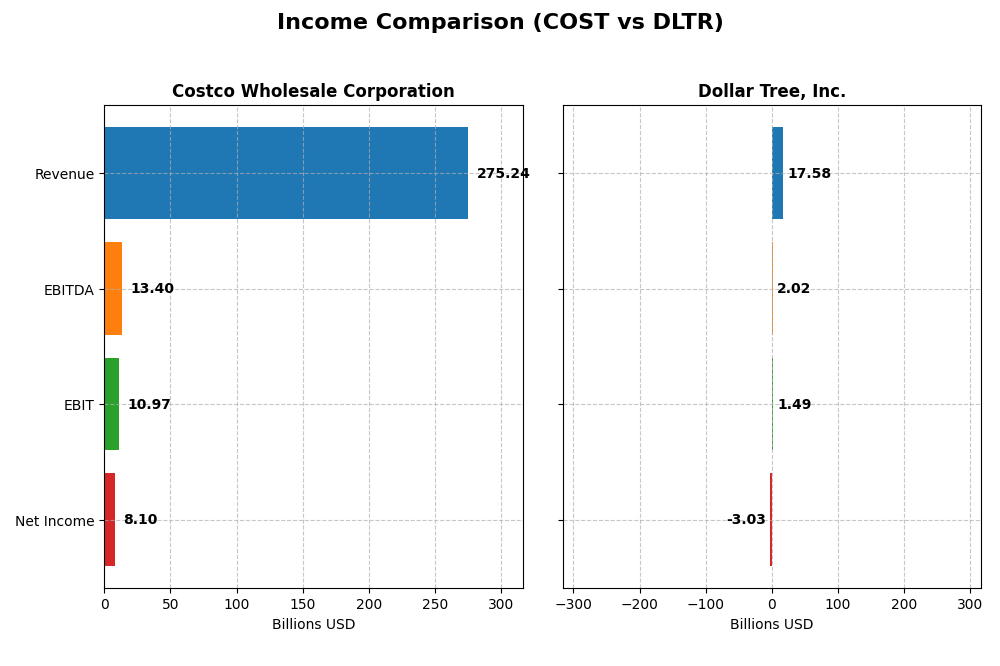
This table compares the key income statement metrics for Costco Wholesale Corporation and Dollar Tree, Inc. for their most recent fiscal years, providing a clear overview of their financial performance.
| Metric | Costco Wholesale Corporation | Dollar Tree, Inc. |
|---|---|---|
| Market Cap | 419B | 29B |
| Revenue | 275.2B | 17.6B |
| EBITDA | 13.4B | 2.0B |
| EBIT | 11.0B | 1.5B |
| Net Income | 8.1B | -3.0B |
| EPS | 18.24 | -14.05 |
| Fiscal Year | 2025 | 2024 |
Income Statement Interpretations
Costco Wholesale Corporation
Costco showed a steady upward trend in revenue and net income from 2021 to 2025, with revenue increasing from $196B to $275B and net income rising from $5.0B to $8.1B. Margins remained mostly stable, with a neutral gross margin of 12.84% and net margin near 2.94%. The 2025 fiscal year saw favorable revenue growth of 8.17% and improved EBIT margin, signaling sustained operational strength.
Dollar Tree, Inc.
Dollar Tree experienced declining revenue and net income over the 2020-2024 period, with revenue dropping from $25.5B to $17.6B and net income turning negative, reaching -$3.0B in 2024. Despite a favorable gross margin of 35.81%, net margin was deeply negative at -17.24%. The latest year reflected unfavorable EBIT decline of nearly 16% and worsening net margin, indicating weakening profitability.
Which one has the stronger fundamentals?
Costco’s fundamentals appear stronger given consistent revenue and net income growth, stable margins, and mostly favorable income statement metrics over the last five years. In contrast, Dollar Tree shows deteriorating revenue, negative net income, and unfavorable margin trends, reflecting fundamental challenges. Thus, Costco presents a more robust income statement profile based solely on the provided data.
Financial Ratios Comparison
The following table presents the latest available financial ratios for Costco Wholesale Corporation and Dollar Tree, Inc., facilitating a straightforward comparison of key performance and financial health metrics as of their most recent fiscal years.
| Ratios | Costco Wholesale Corporation (2025) | Dollar Tree, Inc. (2024) |
|---|---|---|
| ROE | 27.8% | -76.2% |
| ROIC | 19.3% | 9.2% |
| P/E | 51.7 | -5.2 |
| P/B | 14.4 | 4.0 |
| Current Ratio | 1.03 | 1.06 |
| Quick Ratio | 0.55 | 0.75 |
| D/E (Debt-to-Equity) | 0.28 | 1.97 |
| Debt-to-Assets | 10.6% | 42.0% |
| Interest Coverage | 67.4 | 13.6 |
| Asset Turnover | 3.57 | 0.94 |
| Fixed Asset Turnover | 7.95 | 2.03 |
| Payout ratio | 27.0% | 0% |
| Dividend yield | 0.52% | 0% |
Interpretation of the Ratios
Costco Wholesale Corporation
Costco shows a mix of strong and weak ratios, with favorable returns on equity (27.77%) and invested capital (19.26%), but an unfavorable net margin (2.94%) and high price-to-book (14.36). The current ratio is neutral at 1.03, yet the quick ratio is weak at 0.55. Costco pays dividends with a low yield of 0.52%, indicating cautious distribution coverage supported by strong free cash flow.
Dollar Tree, Inc.
Dollar Tree’s ratios reveal significant weaknesses, with negative net margin (-17.24%) and return on equity (-76.18%), despite a favorable weighted average cost of capital (6.16%) and interest coverage (13.87). Its debt levels are high, reflected in unfavorable debt-to-equity (1.97). The company does not pay dividends, likely due to ongoing losses and reinvestment needs during restructuring or growth phases.
Which one has the best ratios?
Costco presents a more balanced and stronger financial profile with half of its ratios favorable, including robust profitability and manageable debt, despite some valuation concerns. Dollar Tree faces more challenges, with nearly half its ratios unfavorable and negative profitability, leading to a slightly unfavorable overall evaluation compared to Costco’s slightly favorable stance.
Strategic Positioning
This section compares the strategic positioning of Costco and Dollar Tree, focusing on market position, key segments, and exposure to technological disruption:
Costco
- Leading membership warehouse operator with global presence and strong scale.
- Diverse product range: Food, fresh food, non-foods, memberships, and services.
- Limited explicit exposure to technological disruption mentioned.
Dollar Tree
- Operates discount variety retail stores with two segments: Dollar Tree and Family Dollar.
- Concentrated on fixed-price merchandise and general discount store products across two segments.
- No direct information on technological disruption exposure provided.
Costco vs Dollar Tree Positioning
Costco adopts a diversified strategy with broad product categories and international reach, enabling scale advantages. Dollar Tree focuses on discount retail with two distinct segments, offering a more concentrated business model but less diversification.
Which has the best competitive advantage?
Both companies create value with growing ROIC trends and very favorable moat evaluations. Costco’s larger scale and diversified operations suggest a stronger durable competitive advantage compared to Dollar Tree’s more focused approach.
Stock Comparison
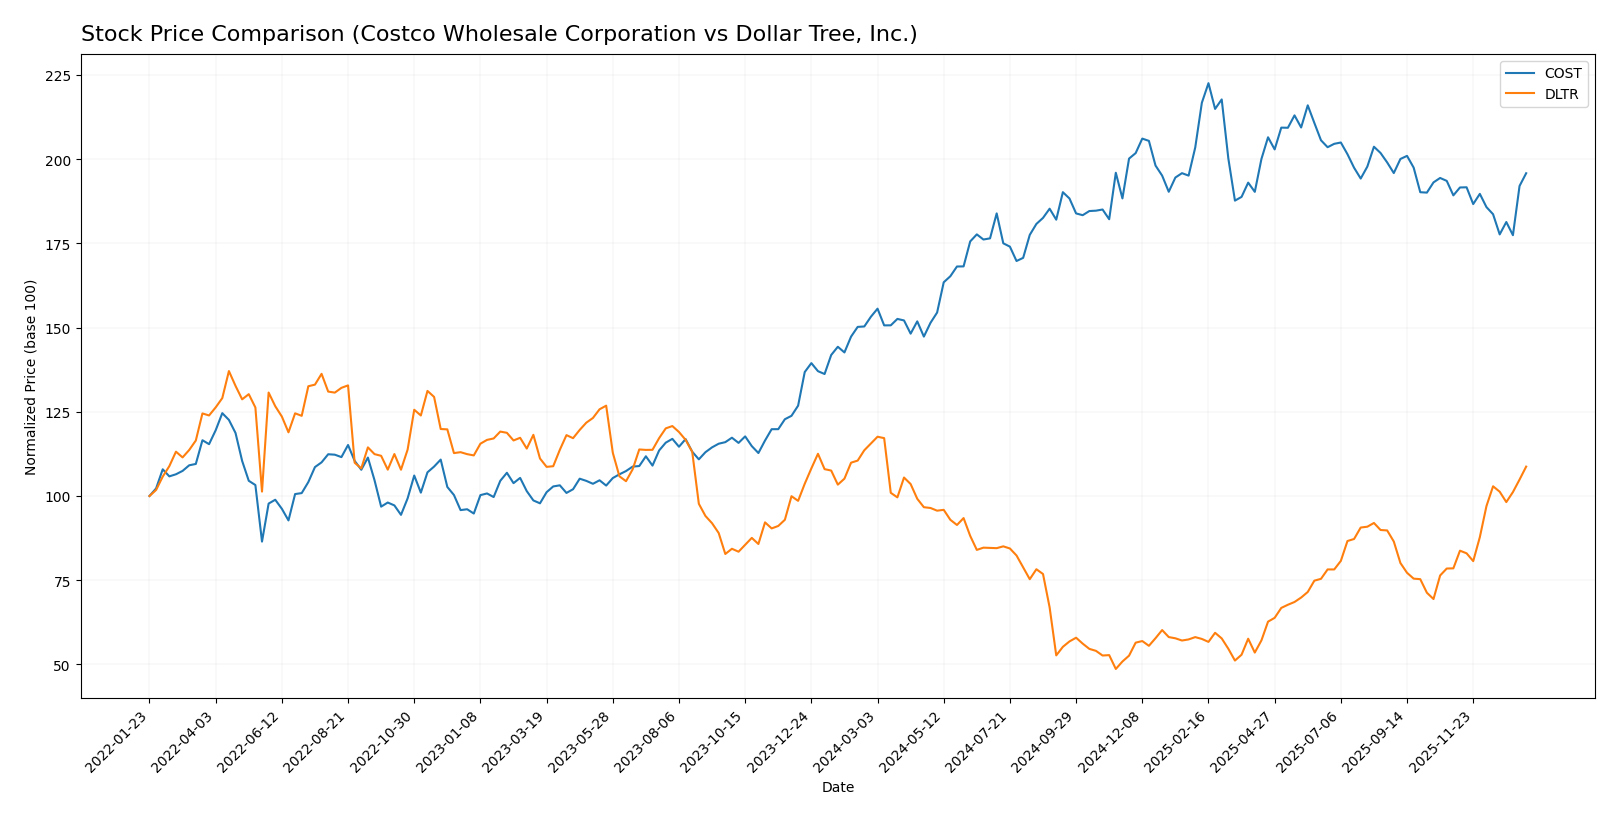
The stock price chart highlights significant movements in Costco Wholesale Corporation (COST) with a strong bullish trend over the past year, while Dollar Tree, Inc. (DLTR) experienced a notable bearish trend that reversed into a recent bullish surge.
Trend Analysis
Costco Wholesale Corporation’s stock exhibited a bullish trend over the past 12 months, gaining 27.8% with decelerating momentum. The price ranged from a low of 709.51 to a high of 1071.85, showing substantial volatility with an 84.58 standard deviation.
Dollar Tree, Inc. showed a bearish trend over the same period, declining by 5.92% with accelerating downward momentum. However, its recent trend reversed sharply, gaining 38.46% between November 2025 and January 2026 with a positive slope and lower volatility at 12.76 standard deviation.
Comparing both, Costco delivered the highest overall market performance with a 27.8% gain year-over-year, while Dollar Tree’s recent rebound contrasts its longer-term decline.
Target Prices
The target price consensus for Costco Wholesale Corporation and Dollar Tree, Inc. reflects generally positive analyst expectations.
| Company | Target High | Target Low | Consensus |
|---|---|---|---|
| Costco Wholesale Corporation | 1171 | 769 | 1025.08 |
| Dollar Tree, Inc. | 150 | 75 | 125.33 |
Analysts see Costco’s stock potentially appreciating from its current price of 943.08 USD to around 1025 USD, indicating moderate upside. Dollar Tree’s consensus target also suggests upside from 137.24 USD to about 125 USD, though the current price already exceeds this consensus slightly.
Analyst Opinions Comparison
This section compares analysts’ ratings and grades for Costco Wholesale Corporation and Dollar Tree, Inc.:
Rating Comparison
Costco Wholesale Corporation Rating
- Rating: B+ indicating a very favorable overall evaluation.
- Discounted Cash Flow Score: Moderate at 3, reflecting balanced valuation.
- ROE Score: Very favorable at 5, showing strong profit generation efficiency.
- ROA Score: Very favorable at 5, meaning excellent asset utilization.
- Debt To Equity Score: Moderate at 3, showing average financial risk.
- Overall Score: Moderate at 3, summarizing balanced financial health.
Dollar Tree, Inc. Rating
- Rating: D+ indicating a very unfavorable overall evaluation.
- Discounted Cash Flow Score: Moderate at 2, suggesting some valuation concerns.
- ROE Score: Very unfavorable at 1, indicating poor equity returns.
- ROA Score: Very unfavorable at 1, reflecting weak asset earnings.
- Debt To Equity Score: Very unfavorable at 1, indicating higher financial risk.
- Overall Score: Very unfavorable at 1, reflecting weak overall financial standing.
Which one is the best rated?
Costco Wholesale Corporation holds a clearly better rating and scores, with very favorable ROE and ROA and moderate overall and risk scores. Dollar Tree, Inc. rates very unfavorably on most metrics, indicating weaker financial performance.
Scores Comparison
Here is a comparison of the Altman Z-Score and Piotroski Score for Costco and Dollar Tree:
Costco Scores
- Altman Z-Score: 8.63, indicating a strong safety zone
- Piotroski Score: 8, classified as very strong financial health
Dollar Tree Scores
- Altman Z-Score: 3.49, indicating a safe zone
- Piotroski Score: 4, considered average financial strength
Which company has the best scores?
Costco exhibits a higher Altman Z-Score and a much stronger Piotroski Score compared to Dollar Tree, indicating stronger financial health and lower bankruptcy risk based on the given data.
Grades Comparison
Here is a comparison of the recent grades from reputable grading companies for both companies:
Costco Wholesale Corporation Grades
The following table summarizes the latest grades assigned by recognized financial institutions to Costco:
| Grading Company | Action | New Grade | Date |
|---|---|---|---|
| Telsey Advisory Group | Maintain | Outperform | 2026-01-08 |
| Mizuho | Upgrade | Outperform | 2026-01-05 |
| Telsey Advisory Group | Maintain | Outperform | 2026-01-02 |
| Northcoast Research | Upgrade | Buy | 2025-12-24 |
| Wells Fargo | Maintain | Equal Weight | 2025-12-19 |
| Roth Capital | Downgrade | Sell | 2025-12-15 |
| JP Morgan | Maintain | Overweight | 2025-12-12 |
| Goldman Sachs | Maintain | Buy | 2025-12-12 |
| Baird | Maintain | Outperform | 2025-12-12 |
| Telsey Advisory Group | Maintain | Outperform | 2025-12-12 |
Costco’s grades generally trend positively with multiple “Outperform” and “Buy” ratings, despite a single downgrade to “Sell” by Roth Capital, indicating mostly favorable analyst sentiment.
Dollar Tree, Inc. Grades
Below is a table presenting the recent grades from established grading companies for Dollar Tree:
| Grading Company | Action | New Grade | Date |
|---|---|---|---|
| Barclays | Maintain | Overweight | 2026-01-08 |
| Bernstein | Maintain | Market Perform | 2026-01-05 |
| Wells Fargo | Maintain | Overweight | 2025-12-19 |
| Barclays | Maintain | Overweight | 2025-12-09 |
| Morgan Stanley | Maintain | Equal Weight | 2025-12-08 |
| Evercore ISI Group | Maintain | In Line | 2025-12-04 |
| Telsey Advisory Group | Maintain | Outperform | 2025-12-04 |
| B of A Securities | Maintain | Underperform | 2025-12-04 |
| Guggenheim | Maintain | Buy | 2025-12-04 |
| Wells Fargo | Maintain | Overweight | 2025-12-04 |
Dollar Tree’s grades show a mixed but generally favorable outlook with several “Overweight” and an “Outperform” rating, alongside some more cautious “Market Perform” and “Underperform” ratings.
Which company has the best grades?
Costco Wholesale Corporation has received more consistent high-level grades, including multiple “Outperform” and “Buy” ratings, indicating stronger analyst confidence. Dollar Tree shows a mixed but generally positive rating profile with more variability. Investors might interpret Costco’s steadier positive grades as a sign of more stable analyst sentiment.
Strengths and Weaknesses
Below is a comparative table highlighting key strengths and weaknesses of Costco Wholesale Corporation (COST) and Dollar Tree, Inc. (DLTR) based on their latest financial and operational data.
| Criterion | Costco Wholesale Corporation (COST) | Dollar Tree, Inc. (DLTR) |
|---|---|---|
| Diversification | Highly diversified with strong revenue streams: Food & Sundries (110B), Non-Foods (71B), Fresh Food (38B), Membership (5.3B) | Less diversified, relying mainly on Dollar Tree segment (17.6B) with Family Dollar as secondary (13.8B in 2023) |
| Profitability | Solid ROIC at 19.3% and ROE of 27.8%, though net margin is low at 2.94% | Negative net margin (-17.2%) and ROE (-76.2%), with ROIC moderate at 9.2% |
| Innovation | Demonstrates durable competitive advantage with growing ROIC (+15.7%) | Also shows growing ROIC (+15.3%) but struggles with overall profitability and leverage |
| Global presence | Strong global footprint and brand recognition | Primarily US-focused discount retail chain |
| Market Share | Leading warehouse club with expanding market share | Significant player in discount retail but faces competitive pressures |
Key takeaways: Costco exhibits strong diversification, efficient capital use, and a durable competitive moat with favorable profitability metrics. Dollar Tree, while growing its ROIC, faces profitability challenges and higher leverage, suggesting higher risk despite a solid market position. Investors should weigh Costco’s stability against Dollar Tree’s risk profile carefully.
Risk Analysis
Below is a comparative table of key risks for Costco Wholesale Corporation (COST) and Dollar Tree, Inc. (DLTR) based on the most recent data available:
| Metric | Costco Wholesale Corporation (COST) | Dollar Tree, Inc. (DLTR) |
|---|---|---|
| Market Risk | Beta 1.008, moderate market volatility risk | Beta 0.749, lower volatility but less growth potential |
| Debt Level | Low debt-to-equity ratio 0.28, favorable leverage | High debt-to-equity 1.97, elevated financial risk |
| Regulatory Risk | Moderate, operates globally with compliance challenges | Moderate, operates mainly US/Canada with standard retail regulations |
| Operational Risk | Large global supply chain, mitigated by scale | Significant due to discount model and supply chain costs |
| Environmental Risk | Moderate, active in sustainability but large footprint | Moderate, focus on cost control may limit green investments |
| Geopolitical Risk | Exposure to multiple international markets | Primarily North American exposure, lower geopolitical risk |
Costco’s most impactful risks include market fluctuations and operational complexities from its global footprint, but it maintains strong financial stability with low debt and high interest coverage. Dollar Tree faces higher financial risks due to its elevated debt and negative profitability metrics, increasing vulnerability during economic downturns.
Which Stock to Choose?
Costco Wholesale Corporation (COST) has shown favorable income growth with a 40.5% revenue increase over five years and solid profitability, evidenced by a 27.8% ROE and a slightly favorable global financial ratio profile. Its debt levels are low and well-managed, supporting a very favorable rating of B+.
Dollar Tree, Inc. (DLTR) presents an unfavorable income statement with a net margin of -17.2% and declining earnings over five years. Financial ratios reveal weaknesses, including high debt-to-equity and negative ROE, resulting in a very unfavorable rating of D+ despite a very favorable moat evaluation.
Investors with a risk-tolerant or growth focus might find Costco’s stable income growth, strong profitability, and solid financial ratios appealing. Conversely, those seeking potential turnaround opportunities might consider Dollar Tree’s recent improving price trend despite its unfavorable financials.
Disclaimer: Investment carries a risk of loss of initial capital. The past performance is not a reliable indicator of future results. Be sure to understand risks before making an investment decision.
Go Further
I encourage you to read the complete analyses of Costco Wholesale Corporation and Dollar Tree, Inc. to enhance your investment decisions: