Costco Wholesale Corporation and Dollar General Corporation are two leading players in the discount retail industry, each with distinct market approaches and innovation strategies. While Costco emphasizes membership-based bulk sales and a broad international presence, Dollar General focuses on convenience and extensive store coverage across the U.S. Their shared sector and competitive dynamics make this comparison particularly insightful. In this article, I will help you uncover which company presents the most compelling investment opportunity.
Table of contents
Companies Overview
I will begin the comparison between Costco Wholesale Corporation and Dollar General Corporation by providing an overview of these two companies and their main differences.
Costco Overview
Costco Wholesale Corporation operates membership warehouses across multiple countries, offering a wide range of branded and private-label products. Its product mix includes groceries, electronics, apparel, and more, supported by services like pharmacies and gas stations. Founded in 1976 and based in Issaquah, Washington, Costco is a leading player in the discount store sector with a market cap of 418B USD and a workforce of 333K employees.
Dollar General Overview
Dollar General Corporation is a discount retailer primarily serving the United States with over 18,000 stores. It offers consumables, apparel, seasonal, and home products targeted at everyday needs. Founded in 1939 and headquartered in Goodlettsville, Tennessee, Dollar General operates in 47 states and employs 194K people. The company has a market capitalization of approximately 33B USD, positioning it as a significant player in the US discount retail market.
Key similarities and differences
Both companies operate in the discount store industry with a focus on consumer defensive products. Costco emphasizes a membership warehouse model with international reach and a broad product and service offering, whereas Dollar General focuses on convenience-oriented retail through a large network of stores across the US. Costco’s business relies on memberships and bulk sales, while Dollar General targets accessible, everyday low-cost items with a more extensive physical footprint domestically.
Income Statement Comparison
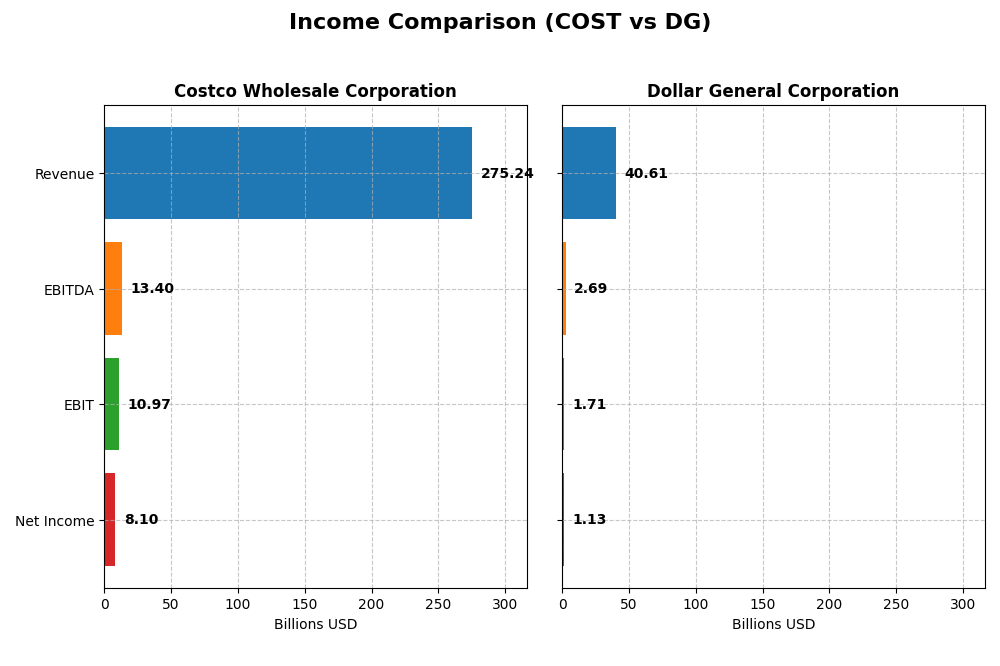
This table compares the key income statement metrics of Costco Wholesale Corporation and Dollar General Corporation for their most recent fiscal years, providing a snapshot of their financial performance.
| Metric | Costco Wholesale Corporation (COST) | Dollar General Corporation (DG) |
|---|---|---|
| Market Cap | 419B | 33B |
| Revenue | 275.2B | 40.6B |
| EBITDA | 13.4B | 2.7B |
| EBIT | 11.0B | 1.7B |
| Net Income | 8.1B | 1.1B |
| EPS | 18.24 | 5.12 |
| Fiscal Year | 2025 | 2024 |
Income Statement Interpretations
Costco Wholesale Corporation
Costco’s revenue rose steadily from 195.9B in 2021 to 275.2B in 2025, with net income growing from 5.0B to 8.1B. Gross and net margins showed favorable growth over the period, reflecting improving profitability. In 2025, revenue growth accelerated to 8.17%, supported by a 10.14% rise in gross profit, while operating expenses grew slightly faster, indicating margin pressure.
Dollar General Corporation
Dollar General’s revenue increased from 33.7B in 2020 to 40.6B in 2024, but net income declined sharply from 2.7B to 1.1B. Gross margin remained favorable at 29.59%, though EBIT margin and net margin stagnated or declined. The latest year showed a 4.96% revenue rise, but net margin and EPS fell significantly, signaling weakening profitability and operational challenges.
Which one has the stronger fundamentals?
Costco demonstrates stronger fundamentals with consistent revenue and net income growth, improving margins, and a favorable income statement evaluation of 64.29% positive indicators. Conversely, Dollar General faces declining net income, deteriorating margins, and a 50% unfavorable income evaluation. Costco’s stable margin expansion and earnings growth underpin comparatively healthier financials.
Financial Ratios Comparison
The table below provides a side-by-side comparison of key financial ratios for Costco Wholesale Corporation (COST) and Dollar General Corporation (DG) based on their most recent fiscal year data.
| Ratios | Costco Wholesale Corporation (2025) | Dollar General Corporation (2024) |
|---|---|---|
| ROE | 27.77% | 15.18% |
| ROIC | 19.26% | 5.10% |
| P/E | 51.71 | 13.89 |
| P/B | 14.36 | 2.11 |
| Current Ratio | 1.03 | 1.19 |
| Quick Ratio | 0.55 | 0.21 |
| D/E (Debt-to-Equity) | 0.28 | 2.36 |
| Debt-to-Assets | 10.60% | 56.09% |
| Interest Coverage | 67.42 | 6.25 |
| Asset Turnover | 3.57 | 1.30 |
| Fixed Asset Turnover | 7.95 | 2.34 |
| Payout ratio | 26.95% | 46.12% |
| Dividend yield | 0.52% | 3.32% |
Interpretation of the Ratios
Costco Wholesale Corporation
Costco shows a balanced mix of strong and weak ratios. Its return on equity (27.77%) and return on invested capital (19.26%) are favorable, indicating efficient capital use. However, its net margin (2.94%), price-to-earnings (51.71), and price-to-book (14.36) ratios are unfavorable, suggesting valuation concerns. The dividend yield is modest at 0.52%, supported by a stable payout, but low yield may deter income-focused investors.
Dollar General Corporation
Dollar General presents moderate strengths with a favorable ROE of 15.18% and a solid dividend yield of 3.32%. Its price-to-earnings ratio (13.89) is attractive, and interest coverage is adequate. However, high debt-to-equity (2.36) and debt-to-assets (56.09%) ratios raise leverage concerns. The quick ratio is weak at 0.21, implying potential liquidity risks despite a consistent dividend distribution.
Which one has the best ratios?
Both companies have slightly favorable overall ratios, but their strengths differ. Costco excels in profitability and capital efficiency with lower leverage, while Dollar General offers higher dividend yield and better valuation metrics but faces higher financial risk due to leverage and liquidity issues. Investors should weigh these factors based on their risk tolerance and investment goals.
Strategic Positioning
This section compares the strategic positioning of Costco and Dollar General, including market position, key segments, and exposure to technological disruption:
Costco
- Leading membership warehouse operator with global presence and scale; faces moderate competitive pressure.
- Diverse product portfolio including food, fresh food, non-foods, and membership services driving revenues.
- Limited explicit exposure to technological disruption noted in available data.
Dollar General
- Regional discount retailer focused on the U.S. with a dense store network; operates in a competitive discount market.
- Concentrated on consumables, apparel, home products, and seasonal items primarily in the U.S. market.
- No specific information on technological disruption exposure provided.
Costco vs Dollar General Positioning
Costco follows a diversified international strategy with multiple product categories, leveraging membership revenue, while Dollar General concentrates on the U.S. discount market with a narrower product range. Costco’s larger scale and broader diversification contrast with Dollar General’s focused regional approach.
Which has the best competitive advantage?
Costco demonstrates a very favorable economic moat with growing ROIC and strong value creation, indicating durable competitive advantage. Dollar General shows slightly unfavorable moat status with declining ROIC, suggesting weaker competitive positioning.
Stock Comparison
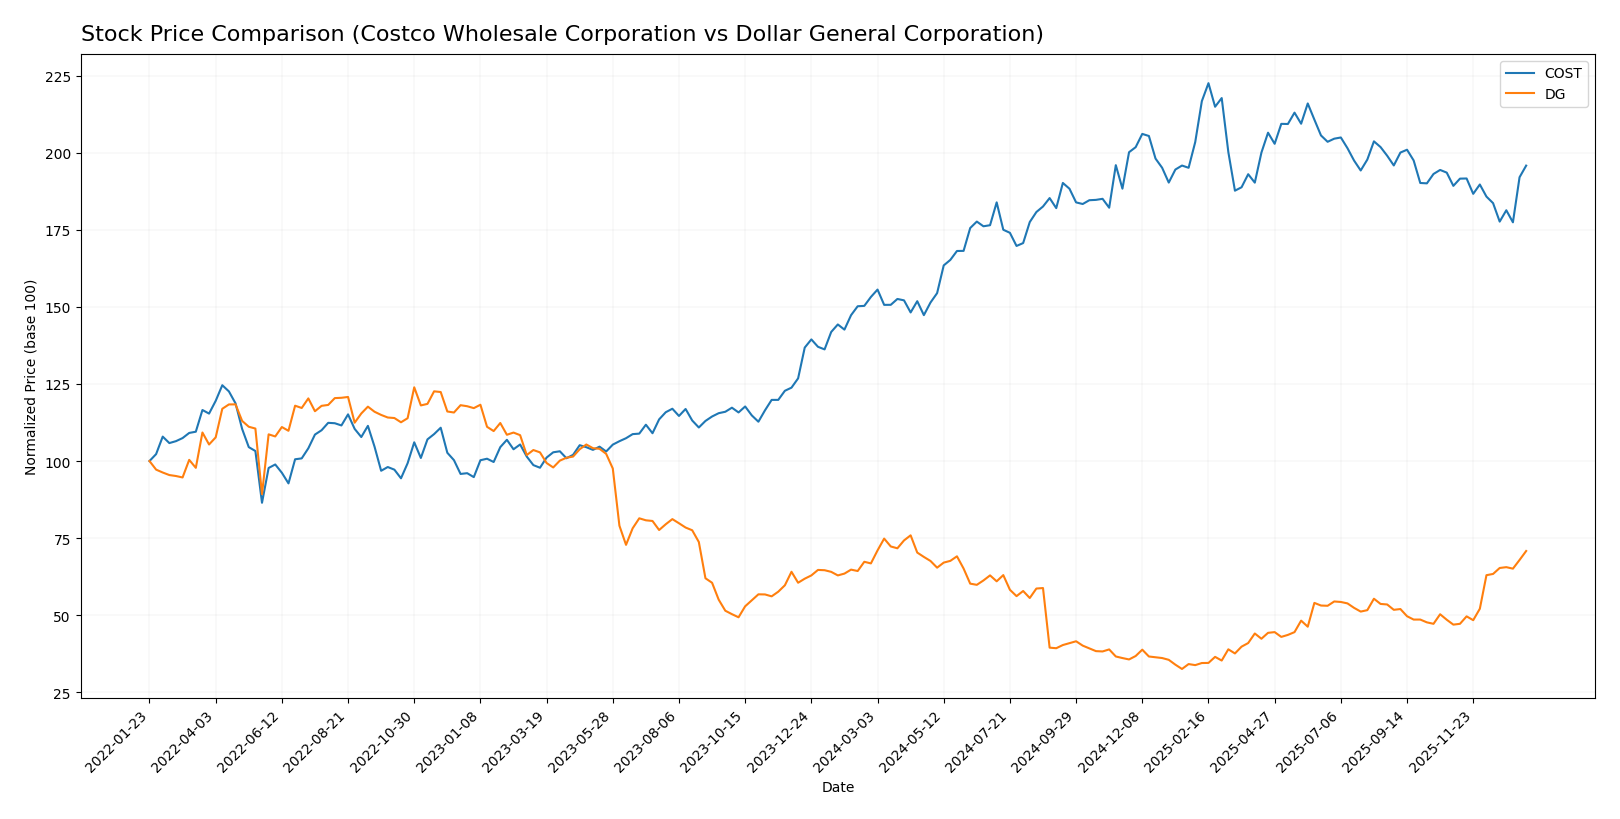
The past year reveals distinct price dynamics between Costco Wholesale Corporation and Dollar General Corporation, with Costco showing steady gains and Dollar General experiencing robust acceleration in recent months.
Trend Analysis
Costco Wholesale Corporation’s stock exhibited a bullish trend over the past 12 months, increasing by 27.8%, though with deceleration in momentum and notable volatility, ranging from 709.51 to a high of 1071.85.
Dollar General Corporation’s stock also followed a bullish trend, rising 6.03% over the year with accelerating momentum and less volatility, hitting a low of 68.44 and a peak of 159.55.
Comparing both, Costco delivered the highest market performance overall with a 27.8% gain, despite Dollar General’s recent sharp acceleration and 50.88% rise in the last two months.
Target Prices
The consensus target prices for Costco Wholesale Corporation and Dollar General Corporation indicate moderate upside potential from current levels.
| Company | Target High | Target Low | Consensus |
|---|---|---|---|
| Costco Wholesale Corporation | 1171 | 769 | 1025.08 |
| Dollar General Corporation | 170 | 125 | 140.06 |
Analysts expect Costco’s stock to appreciate from the current price of 943.08 USD toward a consensus target of 1025.08 USD. Similarly, Dollar General’s consensus target of 140.06 USD suggests a modest increase from its current price of 148.86 USD, reflecting mixed sentiment.
Analyst Opinions Comparison
This section compares analysts’ ratings and financial scores for Costco Wholesale Corporation and Dollar General Corporation:
Rating Comparison
Costco Rating
- Rating: B+, considered very favorable by analysts
- Discounted Cash Flow Score: Moderate at 3
- Return on Equity Score: Very favorable at 5
- Return on Assets Score: Very favorable at 5
- Debt To Equity Score: Moderate at 3
- Overall Score: Moderate at 3
Dollar General Rating
- Rating: B, also considered very favorable
- Discounted Cash Flow Score: Favorable at 4
- Return on Equity Score: Favorable at 4
- Return on Assets Score: Moderate at 3
- Debt To Equity Score: Very unfavorable at 1
- Overall Score: Moderate at 3
Which one is the best rated?
Costco holds a higher overall rating (B+ vs. B) with very favorable ROE and ROA scores, while Dollar General scores better on discounted cash flow but has a weaker debt-to-equity score. Both have moderate overall scores.
Scores Comparison
Here is a comparison of the Altman Z-Score and Piotroski Score for Costco and Dollar General:
Costco Scores
- Altman Z-Score: 8.63, indicating a safe zone with low bankruptcy risk.
- Piotroski Score: 8, classified as very strong financial health.
Dollar General Scores
- Altman Z-Score: 2.55, placing it in a grey zone with moderate bankruptcy risk.
- Piotroski Score: 8, also classified as very strong financial health.
Which company has the best scores?
Costco has a higher Altman Z-Score, indicating stronger financial stability and lower bankruptcy risk than Dollar General. Both have equally strong Piotroski Scores, reflecting solid financial health.
Grades Comparison
The analysis below presents the recent grades assigned by reputable grading companies for Costco Wholesale Corporation and Dollar General Corporation:
Costco Wholesale Corporation Grades
This table summarizes recent grade updates from established grading firms for Costco:
| Grading Company | Action | New Grade | Date |
|---|---|---|---|
| Telsey Advisory Group | maintain | Outperform | 2026-01-08 |
| Mizuho | upgrade | Outperform | 2026-01-05 |
| Telsey Advisory Group | maintain | Outperform | 2026-01-02 |
| Northcoast Research | upgrade | Buy | 2025-12-24 |
| Wells Fargo | maintain | Equal Weight | 2025-12-19 |
| Roth Capital | downgrade | Sell | 2025-12-15 |
| JP Morgan | maintain | Overweight | 2025-12-12 |
| Goldman Sachs | maintain | Buy | 2025-12-12 |
| Baird | maintain | Outperform | 2025-12-12 |
| Telsey Advisory Group | maintain | Outperform | 2025-12-12 |
Overall, Costco’s grades show a predominance of buy and outperform recommendations, with a single downgrade to sell, indicating mostly positive analyst sentiment.
Dollar General Corporation Grades
This table summarizes recent grade updates from established grading firms for Dollar General:
| Grading Company | Action | New Grade | Date |
|---|---|---|---|
| Barclays | maintain | Overweight | 2026-01-08 |
| Bernstein | maintain | Outperform | 2026-01-05 |
| Evercore ISI Group | maintain | In Line | 2025-12-23 |
| Wells Fargo | maintain | Equal Weight | 2025-12-19 |
| JP Morgan | upgrade | Overweight | 2025-12-15 |
| Guggenheim | maintain | Buy | 2025-12-08 |
| Citigroup | maintain | Neutral | 2025-12-08 |
| Jefferies | maintain | Buy | 2025-12-05 |
| Morgan Stanley | maintain | Equal Weight | 2025-12-05 |
| Evercore ISI Group | maintain | In Line | 2025-12-05 |
Dollar General’s grades are mostly buy, overweight, and in line ratings, reflecting a broadly positive but somewhat more mixed analyst outlook.
Which company has the best grades?
Costco Wholesale Corporation has received more consistent outperform and buy grades, while Dollar General Corporation’s ratings include more neutral and in line assessments. Investors may interpret Costco’s stronger grades as signaling higher confidence from analysts, potentially influencing portfolio decisions based on perceived growth and stability.
Strengths and Weaknesses
Below is a comparative overview of key strengths and weaknesses for Costco Wholesale Corporation (COST) and Dollar General Corporation (DG) based on the most recent financial and operational data.
| Criterion | Costco Wholesale Corporation (COST) | Dollar General Corporation (DG) |
|---|---|---|
| Diversification | Strong product mix with Food & Sundries (109.6B), Fresh Food (38.0B), and Non-Foods (71.2B) segments providing broad revenue streams. | More concentrated in Consumables (33.4B) with smaller contributions from Apparel and Seasonal products, indicating less diversification. |
| Profitability | ROIC at 19.3% (favorable), ROE at 27.8% (favorable), though net margin low at 2.94% (unfavorable). | ROIC moderate at 5.1% (neutral), ROE at 15.2% (favorable), net margin slightly lower at 2.77% (unfavorable). |
| Innovation | Demonstrates durable competitive advantage with growing ROIC +15.7%, indicating efficient capital use and strong value creation. | Declining ROIC trend (-60.9%) and ROIC below WACC, signaling value erosion and weaker innovation or operational efficiency. |
| Global presence | Primarily North American focus but with significant scale and membership model strength globally recognized. | Primarily US-focused with smaller scale and less international presence. |
| Market Share | Large market share in warehouse club retail with strong membership revenue (5.3B). | Significant presence in discount retail but smaller market share and higher debt levels affecting competitive positioning. |
Key takeaways: Costco shows a robust diversification and strong profitability with a durable competitive moat, whereas Dollar General faces challenges with declining profitability and value creation despite a favorable ROE. Investors should weigh Costco’s stability and growth potential against Dollar General’s risks in capital efficiency and leverage.
Risk Analysis
Below is a comparative table highlighting key risk factors for Costco Wholesale Corporation (COST) and Dollar General Corporation (DG) based on the most recent data:
| Metric | Costco Wholesale Corporation (COST) | Dollar General Corporation (DG) |
|---|---|---|
| Market Risk | Beta 1.01, moderate market sensitivity | Beta 0.26, low market sensitivity |
| Debt level | Low debt-to-equity 0.28, favorable | High debt-to-equity 2.36, unfavorable |
| Regulatory Risk | Moderate, operates globally with compliance complexity | Moderate, focused mainly in the U.S. retail sector |
| Operational Risk | Large scale with diversified services, moderate operational complexity | High number of stores (18,190), operational scale risk |
| Environmental Risk | Moderate, some exposure due to global footprint and warehouses | Moderate, retail stores with localized impact |
| Geopolitical Risk | Exposure in multiple countries, some geopolitical risk | Primarily U.S.-based, lower geopolitical risk |
In synthesis, the most impactful and likely risks differ: Costco faces moderate market and geopolitical risks due to its international presence, but benefits from low debt and strong financial stability (Altman Z-score 8.63, safe zone). Dollar General’s higher leverage (debt-to-equity 2.36) and operating scale pose significant financial and operational risks, placing it in a grey financial zone (Altman Z-score 2.55). Investors should weigh Costco’s moderate global risks against Dollar General’s higher financial risk and debt burden.
Which Stock to Choose?
Costco Wholesale Corporation (COST) has shown strong income growth with a 40.48% revenue increase over five years and a 61.75% rise in net income. Its financial ratios are slightly favorable with robust ROE at 27.77%, low debt, and an excellent interest coverage ratio, reflecting solid profitability and stable debt management. The company holds a very favorable moat rating, indicating durable competitive advantages and growing profitability, alongside a B+ rating.
Dollar General Corporation (DG) presents moderate income growth of 20.34% over five years but a significant net income decline of 57.62%. Its financial ratios are slightly favorable but highlight concerns with high debt levels and a declining ROIC trend, signaling value erosion. DG holds a slightly unfavorable moat rating due to shrinking profitability, yet it maintains a B rating reflecting moderate financial stability.
For investors, COST may appear more suitable for those prioritizing durable competitive advantages and steady profitability, while DG could be of interest to those with a tolerance for higher risk seeking potential value in a turnaround scenario. The ratings and income evaluations suggest distinct profiles for each stock based on stability versus growth challenges.
Disclaimer: Investment carries a risk of loss of initial capital. The past performance is not a reliable indicator of future results. Be sure to understand risks before making an investment decision.
Go Further
I encourage you to read the complete analyses of Costco Wholesale Corporation and Dollar General Corporation to enhance your investment decisions: