Home > Comparison > Basic Materials > CTVA vs MOS
The strategic rivalry between Corteva, Inc. and The Mosaic Company defines the current trajectory of the agricultural inputs sector. Corteva operates as a seed and crop protection innovator, leveraging advanced trait technologies and digital solutions. In contrast, Mosaic focuses on mining and marketing concentrated phosphate and potash nutrients, capitalizing on resource-intensive production. This analysis will determine which company’s operational model offers the superior risk-adjusted outlook for a diversified portfolio in basic materials.
Table of contents
Companies Overview
Corteva and Mosaic dominate the agricultural inputs sector with distinct approaches to crop enhancement and nutrient supply.
Corteva, Inc.: Leader in Advanced Crop Technologies
Corteva positions itself as a pioneer in seed genetics and crop protection. Its revenue stems primarily from developing advanced germplasm and trait technologies that optimize farm yields. In 2026, it focuses on integrating digital solutions to enhance farmer decision-making and maximize profitability across global markets.
The Mosaic Company: Nutrient Powerhouse
Mosaic stands as a major producer of concentrated phosphate and potash nutrients. Its core income derives from mining and marketing essential crop nutrients like phosphate and potash. The company’s 2026 strategy emphasizes expanding its fertilizer portfolio and serving a broad customer base from wholesalers to farmers internationally.
Strategic Collision: Similarities & Divergences
Both firms serve the agricultural inputs market but diverge in philosophy: Corteva invests heavily in biotechnology and digital innovation, while Mosaic prioritizes raw material extraction and nutrient supply. Their primary battleground is the farm-level crop input market, where yield and soil health are critical. Investors face distinct profiles: Corteva’s growth hinges on technological edge, Mosaic’s on commodity cycles and production scale.
Income Statement Comparison
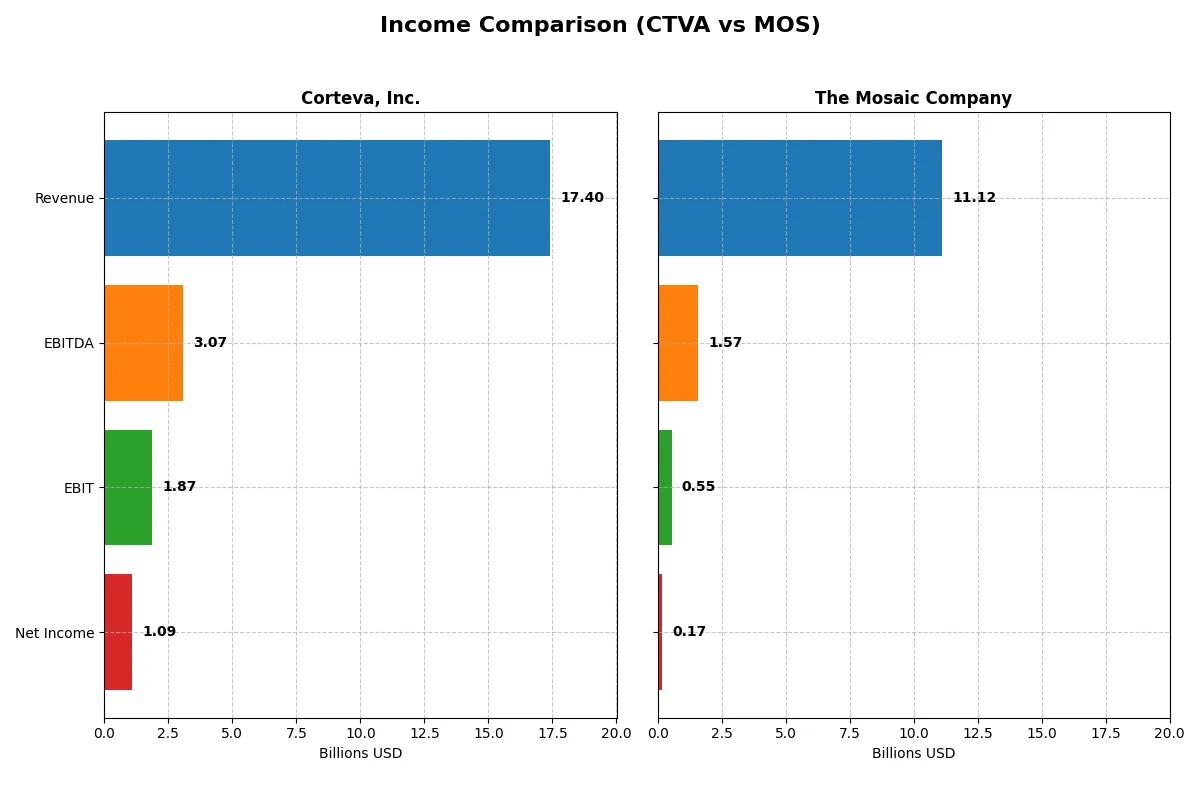
This data dissects the core profitability and scalability of both corporate engines to reveal who dominates the bottom line:
| Metric | Corteva, Inc. (CTVA) | The Mosaic Company (MOS) |
|---|---|---|
| Revenue | 17.4B | 11.1B |
| Cost of Revenue | 9.82B | 9.61B |
| Operating Expenses | 4.97B | 0.89B |
| Gross Profit | 7.59B | 1.51B |
| EBITDA | 3.07B | 1.57B |
| EBIT | 1.87B | 0.55B |
| Interest Expense | 180M | 230M |
| Net Income | 1.09B | 175M |
| EPS | 1.61 | 0.55 |
| Fiscal Year | 2025 | 2024 |
Income Statement Analysis: The Bottom-Line Duel
This income statement comparison reveals the true efficiency of Corteva and Mosaic’s corporate engines over recent years.
Corteva, Inc. Analysis
Corteva’s revenue increased steadily to $17.4B in 2025, with net income reaching $1.09B. Gross and net margins remain healthy at 43.6% and 6.3%, respectively. The company improved EBIT by nearly 24% in 2025, signaling strong operational momentum despite modest revenue growth.
The Mosaic Company Analysis
Mosaic’s revenue declined sharply by almost 19% to $11.1B in 2024, with net income falling to $175M. Margins contracted, with gross margin at 13.6% and net margin at a thin 1.6%. The company’s EBIT plunged 64%, reflecting significant margin compression and operational challenges.
Margin Strength vs. Revenue Contraction
Corteva demonstrates superior margin control and profitable growth, while Mosaic struggles with shrinking revenue and collapsing profits. Corteva’s margin resilience and EBIT growth mark it as the more fundamentally efficient operator. Investors seeking stable earnings and margin expansion should weigh Corteva’s profile more favorably.
Financial Ratios Comparison
These vital ratios act as a diagnostic tool to expose the underlying fiscal health, valuation premiums, and capital efficiency of the companies compared below:
| Ratios | Corteva, Inc. (CTVA) | The Mosaic Company (MOS) |
|---|---|---|
| ROE | 4.53% | 1.52% |
| ROIC | 6.67% | 1.64% |
| P/E | 41.25 | 44.94 |
| P/B | 1.87 | 0.68 |
| Current Ratio | 1.43 | 1.08 |
| Quick Ratio | 0.96 | 0.47 |
| D/E | 0.11 | 0.39 |
| Debt-to-Assets | 6.02% | 19.41% |
| Interest Coverage | 14.55 | 2.70 |
| Asset Turnover | 0.41 | 0.49 |
| Fixed Asset Turnover | 4.12 | 0.82 |
| Payout Ratio | 43.42% | 154.77% |
| Dividend Yield | 1.05% | 3.44% |
| Fiscal Year | 2025 | 2024 |
Efficiency & Valuation Duel: The Vital Signs
Financial ratios serve as a company’s DNA, uncovering hidden risks and operational strengths essential for investment insight.
Corteva, Inc.
Corteva shows moderate profitability with a 4.53% ROE and neutral net margin of 6.29%. Its valuation appears stretched, with a high P/E of 41.25 and a P/B near 1.87. The company returns value through a modest 1.05% dividend yield, balancing shareholder returns with continued capital efficiency.
The Mosaic Company
Mosaic struggles with low profitability, reflected in a 1.52% ROE and weak net margin of 1.57%. Its valuation seems stretched, given a P/E of 44.94 despite a low P/B of 0.68. Mosaic offers a higher dividend yield of 3.44%, focusing on distributing cash rather than reinvesting aggressively into growth.
Valuation Stretch and Profitability Gaps
Corteva balances operational efficiency and shareholder returns with a slightly favorable ratio profile. Mosaic’s weaker profitability and stretched valuation raise concerns despite a higher dividend yield. Investors seeking operational stability may lean toward Corteva, while income-focused profiles might prefer Mosaic’s yield.
Which one offers the Superior Shareholder Reward?
I see Corteva, Inc. (CTVA) delivers a balanced distribution mix with a 1.05% dividend yield and a moderate 43% payout ratio, supported by strong free cash flow (4.3/share). Buybacks are steady, enhancing total returns sustainably. The Mosaic Company (MOS) offers a higher 3.44% dividend yield but a stretched payout ratio above 150%, signaling risk. MOS’s free cash flow coverage is weak (0.15/share), and buybacks are less significant. I consider Corteva’s disciplined payout and buyback strategy more sustainable, offering a superior total return profile for 2026 investors.
Comparative Score Analysis: The Strategic Profile
The radar chart reveals the fundamental DNA and trade-offs of Corteva, Inc. and The Mosaic Company:
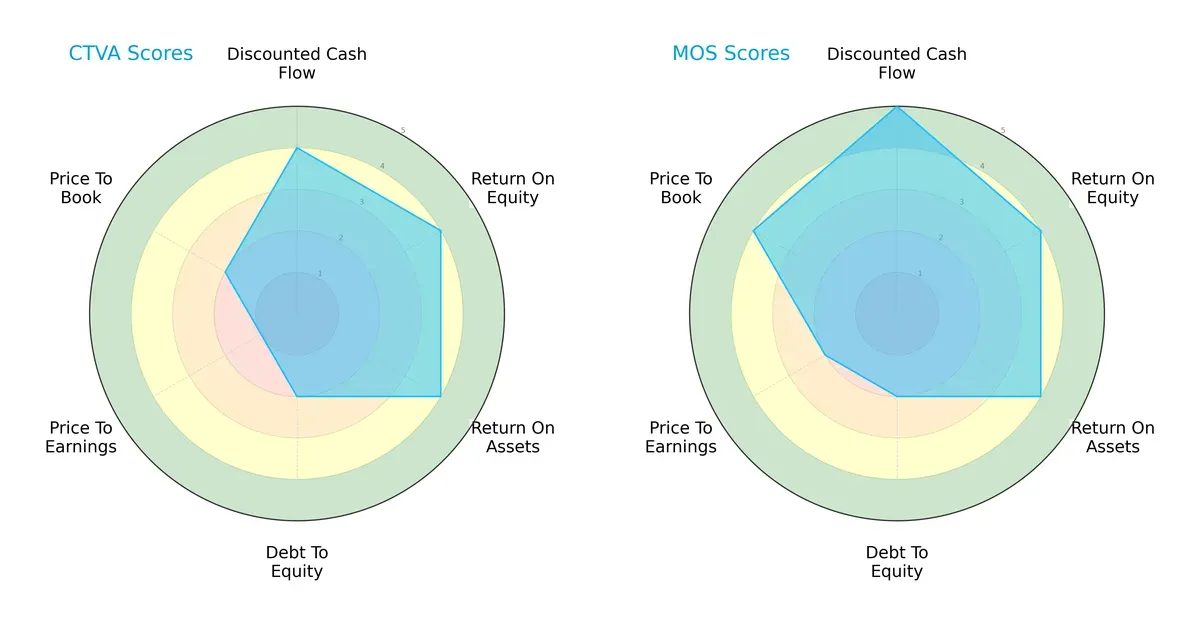
Corteva and Mosaic share strengths in ROE and ROA, both scoring 4, signaling efficient asset and equity utilization. Mosaic leads in discounted cash flow (5 vs. 4) and valuation metrics (P/B 4 vs. 2; P/E 2 vs. 1), showing better market pricing and future cash flow prospects. Both companies carry a weak debt-to-equity score (2), reflecting leveraged balance sheets. Corteva’s valuation scores lag sharply, indicating potential overvaluation risk. Mosaic offers a more balanced financial profile, while Corteva relies on operational efficiency but suffers from valuation and leverage concerns.
Bankruptcy Risk: Solvency Showdown
The Altman Z-Score difference signals subtle solvency risks for both in this cycle:
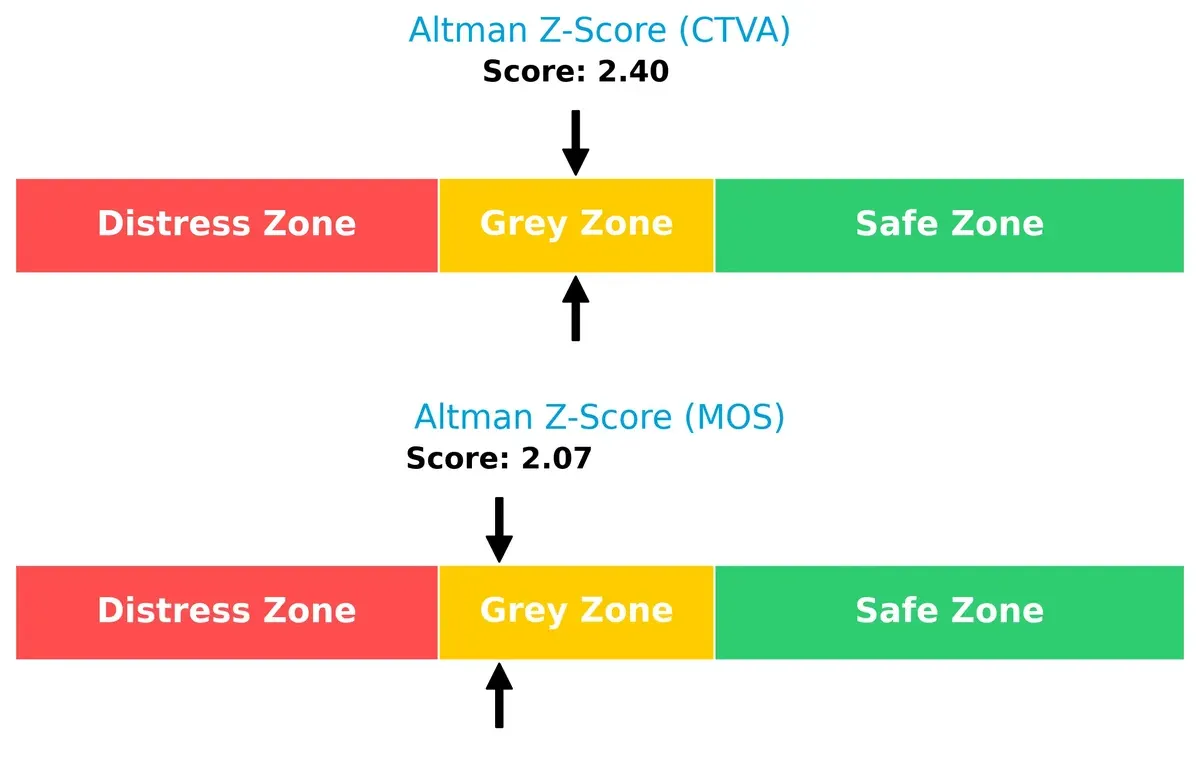
Corteva’s Z-Score of 2.40 slightly outperforms Mosaic’s 2.07, placing both firms in the “grey zone.” This implies moderate bankruptcy risk amid economic fluctuations. Neither is in the safe zone above 3, so investors must monitor liquidity and leverage as market pressures evolve.
Financial Health: Quality of Operations
Piotroski F-Score comparison highlights operational quality disparities:
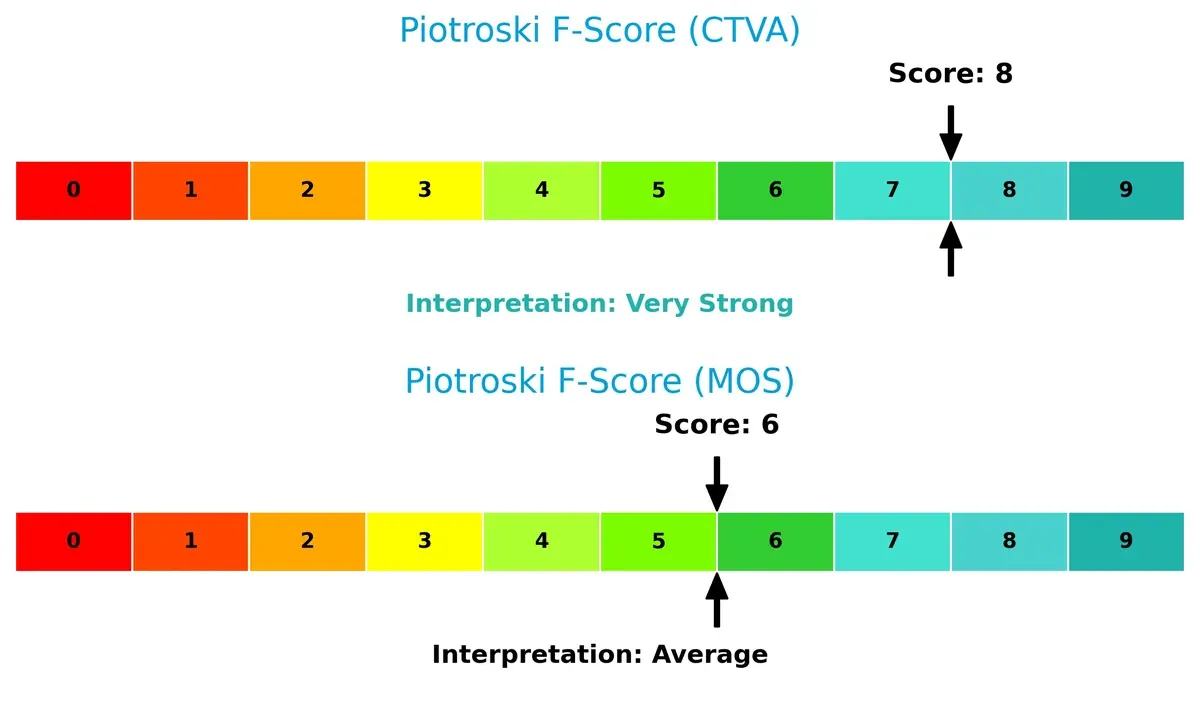
Corteva scores an impressive 8, indicating very strong financial health with robust profitability and internal metrics. Mosaic’s 6 is average, suggesting some operational weaknesses or less efficient capital allocation. Corteva exhibits superior internal quality, making it more resilient against sector volatility. Mosaic’s moderate score flags caution for investors seeking peak financial strength.
How are the two companies positioned?
This section dissects Corteva and Mosaic’s operational DNA by comparing revenue distribution and internal strengths and weaknesses. The goal is to confront their economic moats and determine which model offers the most resilient, sustainable advantage today.
Revenue Segmentation: The Strategic Mix
This comparison dissects how Corteva and Mosaic diversify their income streams and highlights their dominant sector bets for 2024:
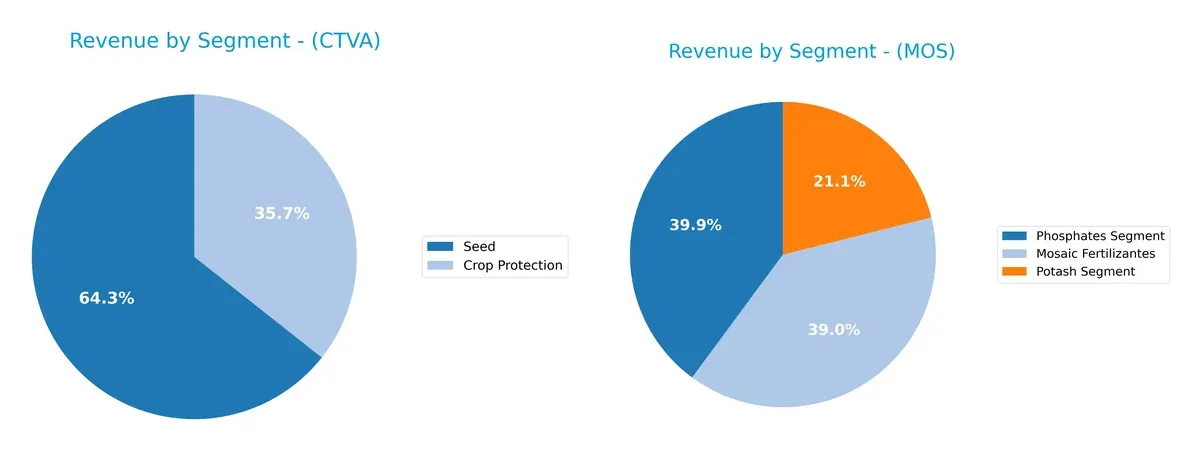
Corteva anchors its revenue in Seeds with $6.5B, while Crop Protection trails at $3.6B, showing moderate diversification. Mosaic spreads $11.3B across three fertilizer segments, with Phosphates ($4.5B) and Fertilizantes ($4.4B) nearly equal, and Potash adding $2.4B. Mosaic’s broader mix reduces concentration risk, while Corteva’s reliance on Seeds suggests vulnerability to crop cycle fluctuations and input cost shifts.
Strengths and Weaknesses Comparison
This table compares the strengths and weaknesses of Corteva, Inc. and The Mosaic Company based on diversification, profitability, financial health, innovation, global presence, and market share:
Corteva, Inc. Strengths
- Balanced revenue from Crop Protection and Seed segments
- Favorable debt-to-assets ratio at 6%
- Strong interest coverage at 10.38x
- Favorable fixed asset turnover at 4.12
- Diversified geographic sales including US, Latin America, EMEA
- Neutral to favorable overall financial ratios
The Mosaic Company Strengths
- Diverse fertilizer segments: Phosphates, Potash, Fertilizantes
- Favorable debt-to-assets at 19.4% and D/E at 0.39
- Higher dividend yield at 3.44%
- Favorable price-to-book at 0.68
- Significant total geographic revenue scale
- Favorable weighted average cost of capital at 6.86%
Corteva, Inc. Weaknesses
- Unfavorable return on equity at 4.53% below cost of capital
- PE ratio high at 41.25, suggesting expensive valuation
- Neutral current and quick ratios, with quick ratio below 1
- Unfavorable asset turnover at 0.41 indicates lower efficiency
- Neutral net margin at 6.29%
- No explicit data on innovation
The Mosaic Company Weaknesses
- Unfavorable net margin at 1.57% and low ROE at 1.52%
- Unfavorable ROIC at 1.64%, below WACC
- Unfavorable quick ratio at 0.47 suggests liquidity risk
- High PE ratio at 44.94 indicates expensive valuation
- Unfavorable fixed asset turnover at 0.82
- Neutral interest coverage at 2.37x, tight debt servicing
Both companies show strengths in diversification and manageable leverage. Corteva demonstrates better efficiency and profitability metrics, while Mosaic offers a higher dividend yield and lower price-to-book ratio. However, both face profitability challenges relative to their cost of capital, warranting cautious evaluation in portfolio strategies.
The Moat Duel: Analyzing Competitive Defensibility
A structural moat is the only true shield protecting long-term profits from relentless competitive erosion in agriculture inputs:
Corteva, Inc.: Innovation-Driven Moat via Intangible Assets
Corteva leverages advanced seed traits and digital farming solutions, reflected in stable 44% gross margins and rising EBIT by 24% in 2025. Its innovation pipeline deepens resistance traits, bolstering its competitive edge despite value destruction signs.
The Mosaic Company: Cost-Advantage Moat in Bulk Nutrients
Mosaic depends on scale and mining assets for potash and phosphate, but suffers 14% gross margins and a 64% EBIT decline in 2024, signaling a weakening cost advantage amid declining ROIC and profitability.
Innovation Resilience vs. Resource Scale: Who Holds the Moat?
Corteva’s intangible asset moat is deeper, supported by improving profitability and innovation-led growth. Mosaic’s cost moat erodes with declining returns and margins. Corteva is better positioned to defend market share through product differentiation.
Which stock offers better returns?
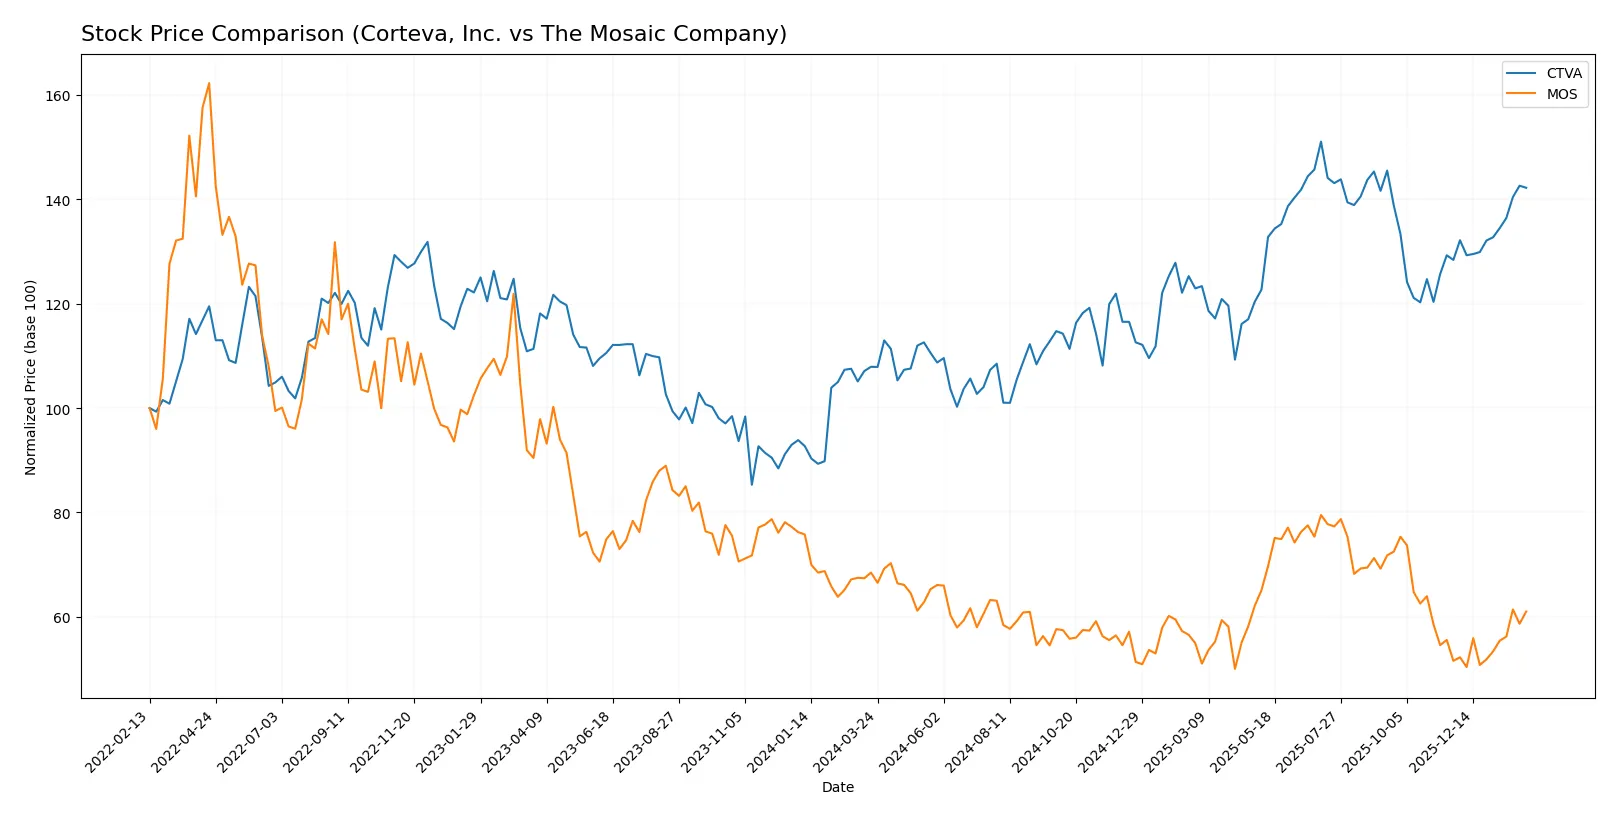
The past year shows contrasting trajectories: Corteva’s stock rose sharply, gaining over 30%, while Mosaic’s price declined by nearly 11%, reflecting divergent market sentiment and trading momentum.
Trend Comparison
Corteva, Inc. exhibits a strong bullish trend with a 31.78% price increase over 12 months, marked by accelerating gains and a high near 77.12. The trend shows robust volatility at 6.82%.
The Mosaic Company’s stock shows a bearish trend with a 10.9% decline over the same period, despite recent acceleration. It recorded a lower volatility of 3.68% and a peak price of 37.27.
Corteva has delivered higher market performance, outperforming Mosaic by over 40 percentage points in price change during the past year.
Target Prices
Analysts present a clear target price consensus for Corteva, Inc. and The Mosaic Company, reflecting cautious optimism.
| Company | Target Low | Target High | Consensus |
|---|---|---|---|
| Corteva, Inc. | 80 | 89 | 84.88 |
| The Mosaic Company | 27 | 44 | 33.8 |
Corteva’s consensus target of 84.88 suggests a 17% upside from the current 72.6 price. Mosaic’s 33.8 target implies an 18% potential gain versus its 28.6 share price.

Don’t Let Luck Decide Your Entry Point
Optimize your entry points with our advanced ProRealTime indicators. You’ll get efficient buy signals with precise price targets for maximum performance. Start outperforming now!
How do institutions grade them?
Corteva, Inc. Grades
The following table summarizes recent grades assigned to Corteva by major institutions.
| Grading Company | Action | New Grade | Date |
|---|---|---|---|
| Citigroup | Maintain | Neutral | 2026-02-05 |
| JP Morgan | Downgrade | Neutral | 2026-02-05 |
| Wells Fargo | Maintain | Overweight | 2026-02-05 |
| RBC Capital | Maintain | Outperform | 2026-02-05 |
| Oppenheimer | Maintain | Outperform | 2026-01-27 |
| Citigroup | Maintain | Neutral | 2026-01-21 |
| JP Morgan | Maintain | Overweight | 2026-01-21 |
| Mizuho | Maintain | Outperform | 2026-01-16 |
| Citigroup | Maintain | Neutral | 2025-12-18 |
| Wells Fargo | Maintain | Overweight | 2025-11-11 |
The Mosaic Company Grades
Below is a summary of recent grades issued for The Mosaic Company by key grading firms.
| Grading Company | Action | New Grade | Date |
|---|---|---|---|
| Scotiabank | Upgrade | Sector Outperform | 2026-02-02 |
| Wells Fargo | Maintain | Equal Weight | 2026-01-23 |
| RBC Capital | Maintain | Sector Perform | 2026-01-20 |
| Morgan Stanley | Maintain | Equal Weight | 2026-01-14 |
| UBS | Maintain | Buy | 2026-01-12 |
| Mizuho | Maintain | Neutral | 2025-12-18 |
| Barclays | Maintain | Overweight | 2025-12-09 |
| JP Morgan | Maintain | Neutral | 2025-12-05 |
| Barclays | Maintain | Overweight | 2025-11-13 |
| Goldman Sachs | Maintain | Buy | 2025-11-12 |
Which company has the best grades?
Corteva has more consistent outperform and overweight ratings from multiple firms. Mosaic’s grades cluster around sector perform and equal weight, with fewer buy ratings. Investors may view Corteva’s stronger grades as a sign of greater analyst confidence.
Risks specific to each company
The following categories identify the critical pressure points and systemic threats facing both firms in the 2026 market environment:
1. Market & Competition
Corteva, Inc.
- Faces moderate pricing pressure amid evolving seed and crop protection technologies.
The Mosaic Company
- Struggles with weaker margins in phosphate and potash markets amid intense global competition.
2. Capital Structure & Debt
Corteva, Inc.
- Maintains low debt levels (D/E 0.11) and strong interest coverage (10.38x).
The Mosaic Company
- Higher leverage (D/E 0.39) with moderate interest coverage (2.37x) raises refinancing risk.
3. Stock Volatility
Corteva, Inc.
- Lower beta (0.74) indicates less market sensitivity and smoother price swings.
The Mosaic Company
- Higher beta (0.96) suggests greater vulnerability to market fluctuations.
4. Regulatory & Legal
Corteva, Inc.
- Subject to evolving pesticide regulations and biotech approvals globally.
The Mosaic Company
- Faces regulatory scrutiny on mining operations and environmental compliance.
5. Supply Chain & Operations
Corteva, Inc.
- Benefits from integrated R&D and digital farming solutions improving resilience.
The Mosaic Company
- Dependent on mining supply chains vulnerable to geopolitical disruptions and cost inflation.
6. ESG & Climate Transition
Corteva, Inc.
- Invests in sustainable agriculture technologies but must manage chemical impact concerns.
The Mosaic Company
- Under pressure to reduce carbon footprint and environmental impact from mining activities.
7. Geopolitical Exposure
Corteva, Inc.
- Operations diversified across Americas, Asia, and Europe, balancing risk.
The Mosaic Company
- Heavily exposed to international commodity markets and geopolitical tensions affecting fertilizer trade.
Which company shows a better risk-adjusted profile?
Corteva’s strongest risk lies in competitive innovation and regulatory shifts impacting product approval. Mosaic’s greatest risk is operational leverage amid volatile commodity prices and environmental regulations. Corteva exhibits a better risk-adjusted profile, supported by lower leverage, stronger interest coverage, and more stable stock volatility. Mosaic’s higher debt and regulatory exposure heighten its risk in the current market.
Final Verdict: Which stock to choose?
Corteva, Inc. (CTVA) stands out for its growing profitability and disciplined capital structure. Its key strength lies in improving operational efficiency despite a challenging industry backdrop. A point of vigilance remains its current ROIC lagging behind WACC, signaling cautious monitoring. CTVA fits well within an aggressive growth portfolio seeking long-term value creation.
The Mosaic Company (MOS) offers a strategic moat through its tangible asset base and dividend yield, appealing to income-focused investors. While it carries higher leverage and weaker profitability metrics than Corteva, MOS provides more defensive characteristics in volatile markets. It suits portfolios favoring growth at a reasonable price with a tilt toward yield stability.
If you prioritize expanding profitability and operational improvements, Corteva outshines due to its accelerating earnings and improving cash flow quality. However, if you seek income generation and relative stability, Mosaic offers better safety and a stronger dividend profile despite recent profit headwinds. Both require careful risk management given their sector cyclicality.
Disclaimer: Investment carries a risk of loss of initial capital. The past performance is not a reliable indicator of future results. Be sure to understand risks before making an investment decision.
Go Further
I encourage you to read the complete analyses of Corteva, Inc. and The Mosaic Company to enhance your investment decisions: