Home > Comparison > Technology > CPAY vs WIX
The strategic rivalry between Corpay, Inc. and Wix.com Ltd. shapes the evolving landscape of technology infrastructure. Corpay, a capital-intensive payments specialist, contrasts sharply with Wix’s high-margin, cloud-based web development platform. This head-to-head pits a diversified payment solutions provider against a scalable SaaS innovator. This analysis will clarify which company’s trajectory delivers the superior risk-adjusted return for a diversified portfolio in today’s competitive market.

Table of contents
Companies Overview
Corpay and Wix.com stand as pivotal players in the global software infrastructure market with distinct operational models.
Corpay, Inc.: Global Payments Infrastructure Leader
Corpay dominates the business payments space, generating revenue by managing vehicle, lodging, and corporate payments worldwide. In 2026, its strategic focus centers on expanding cross-border payment solutions and integrating accounts payable automation to enhance transaction efficiency for enterprises.
Wix.com Ltd.: Cloud-Based Web Development Innovator
Wix.com leads in cloud website creation, monetizing through premium subscriptions and a suite of digital business tools. Its 2026 strategy emphasizes broadening its platform capabilities with AI-driven design and payment processing to empower small to medium businesses globally.
Strategic Collision: Similarities & Divergences
Both companies rely on software infrastructure but diverge sharply in focus: Corpay prioritizes B2B payment ecosystems, while Wix targets digital presence and commerce for entrepreneurs. Their battleground lies in seamless transaction facilitation—Corpay in corporate payments, Wix in enabling online business operations. Investment profiles differ: Corpay offers stability in payments, Wix provides high growth potential in cloud services.
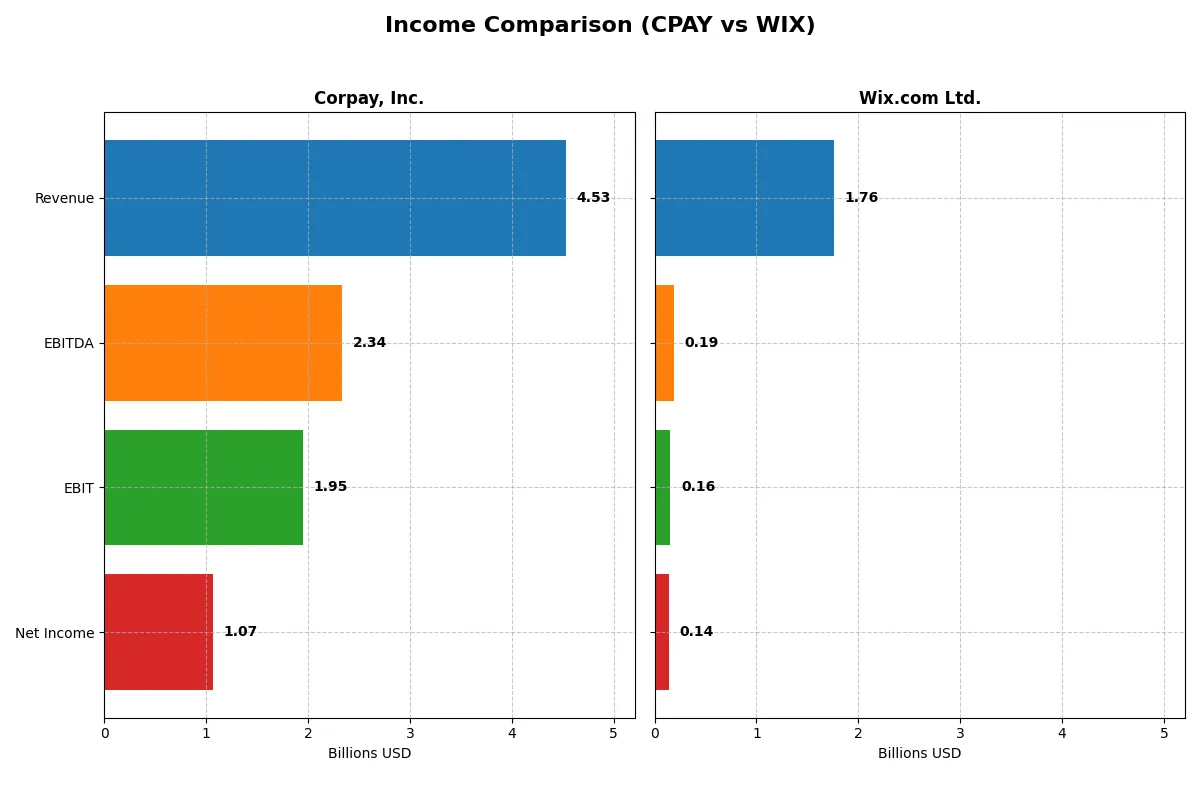
Income Statement Comparison
This data dissects the core profitability and scalability of both corporate engines to reveal who dominates the bottom line:
| Metric | Corpay, Inc. (CPAY) | Wix.com Ltd. (WIX) |
|---|---|---|
| Revenue | 4.53B | 1.76B |
| Cost of Revenue | 1.36B | 565M |
| Operating Expenses | 1.21B | 1.10B |
| Gross Profit | 3.17B | 1.20B |
| EBITDA | 2.34B | 186M |
| EBIT | 1.95B | 155M |
| Interest Expense | 404M | 3.9M |
| Net Income | 1.07B | 138M |
| EPS | 15.25 | 2.49 |
| Fiscal Year | 2025 | 2024 |
Income Statement Analysis: The Bottom-Line Duel
This income statement comparison uncovers which company operates with greater efficiency and stronger financial momentum.
Corpay, Inc. Analysis
Corpay’s revenue climbs steadily to $4.53B in 2025, with net income rising to $1.07B. Its gross margin holds robust at nearly 70%, reflecting solid cost control. Despite a slight dip in net margin growth recently, Corpay sustains strong EBIT margins above 43%, signaling operational efficiency and consistent profitability momentum.
Wix.com Ltd. Analysis
Wix’s revenue grows faster, reaching $1.76B in 2024, with net income surging to $138M after prior losses. Gross margin remains healthy near 68%, while EBIT margin improves substantially to nearly 9%. The company shows remarkable net margin and EPS growth, indicating a strong turnaround and improving operational leverage.
Margin Strength vs. Growth Trajectory
Corpay leads in scale and margin dominance, delivering consistent high profitability with a $1.07B net income in 2025. Wix impresses with rapid growth and margin expansion, recovering from losses to post solid profits. For investors, Corpay offers steady, high-margin cash flow, while Wix appeals as a high-growth turnaround with improving profitability.
Financial Ratios Comparison
These vital ratios act as a diagnostic tool to expose the underlying fiscal health, valuation premiums, and capital efficiency of the companies compared below:
| Ratios | Corpay, Inc. (CPAY) | Wix.com Ltd. (WIX) |
|---|---|---|
| ROE | 27.55% | -175.57% |
| ROIC | 8.78% | 9.13% |
| P/E | 19.73 | 86.21 |
| P/B | 5.43 | -151.35 |
| Current Ratio | 0.98 | 0.84 |
| Quick Ratio | 0.98 | 0.84 |
| D/E | 2.58 | -12.31 |
| Debt-to-Assets | 37.86% | 50.70% |
| Interest Coverage | 4.83 | 25.92 |
| Asset Turnover | 0.17 | 0.92 |
| Fixed Asset Turnover | 9.59 | 3.33 |
| Payout ratio | 0 | 0 |
| Dividend yield | 0 | 0 |
| Fiscal Year | 2025 | 2024 |
Efficiency & Valuation Duel: The Vital Signs
Financial ratios serve as a company’s DNA, uncovering hidden risks and operational strengths essential for investment insights.
Corpay, Inc.
Corpay posts a strong ROE of 27.55% and a healthy net margin of 23.62%, signaling solid profitability. Its P/E ratio of 19.73 suggests a fairly valued stock, though a high P/B ratio of 5.43 signals some valuation stretch. Corpay pays no dividend, focusing on reinvestment to fuel growth.
Wix.com Ltd.
Wix shows a weak ROE at -175.57% and a modest net margin of 7.86%, reflecting profitability challenges. The stock trades with a high P/E of 86.21, indicating it is expensive relative to earnings. Wix also offers no dividends, instead investing heavily in R&D to drive future expansion.
Balanced Efficiency vs. Growth Risk
Corpay offers a more balanced profile with robust profitability and reasonable valuation, while Wix carries higher valuation risk despite growth investments. Investors seeking operational efficiency might favor Corpay’s metrics, whereas those pursuing aggressive growth may consider Wix’s reinvestment strategy.
Which one offers the Superior Shareholder Reward?
Corpay, Inc. (CPAY) and Wix.com Ltd. (WIX) both forego dividends, favoring reinvestment and buybacks. CPAY boasts a robust free cash flow yield with a 0% payout but returns capital via aggressive buybacks, sustaining a high FCF to operating cash flow ratio near 0.87. WIX, despite strong buyback activity, shows thin net margins (7.9%) and a stretched valuation with P/E above 80, signaling risk. CPAY’s superior margins, consistent FCF generation, and disciplined capital allocation create a more sustainable shareholder return. I judge CPAY the better total return choice in 2026.
Comparative Score Analysis: The Strategic Profile
The radar chart reveals the fundamental DNA and strategic trade-offs of Corpay, Inc. and Wix.com Ltd., highlighting their financial strengths and vulnerabilities:
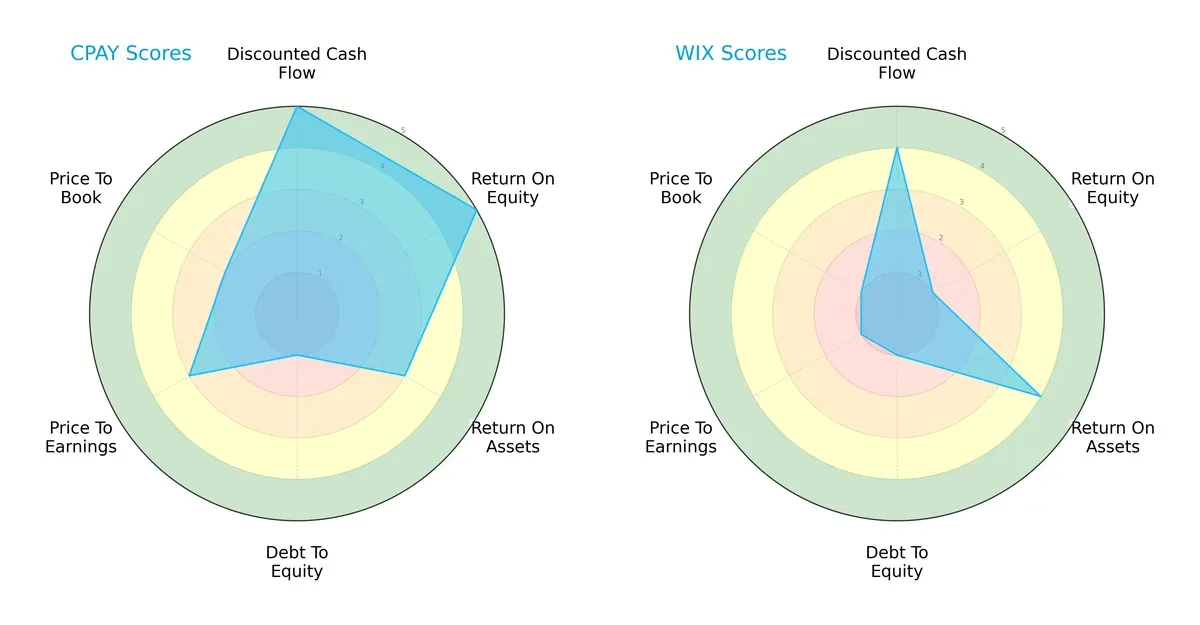
Corpay shows strength in Discounted Cash Flow (5) and Return on Equity (5), indicating robust profitability and cash flow generation. Wix leads slightly in Return on Assets (4 vs. 3), suggesting more efficient asset use. Both struggle with Debt/Equity (1), signaling heavy leverage risk. Corpay’s valuation metrics (P/E 3, P/B 2) are more favorable than Wix’s (P/E 1, P/B 1), but Wix lacks balance, relying more on asset efficiency while Corpay presents a more diversified profile.
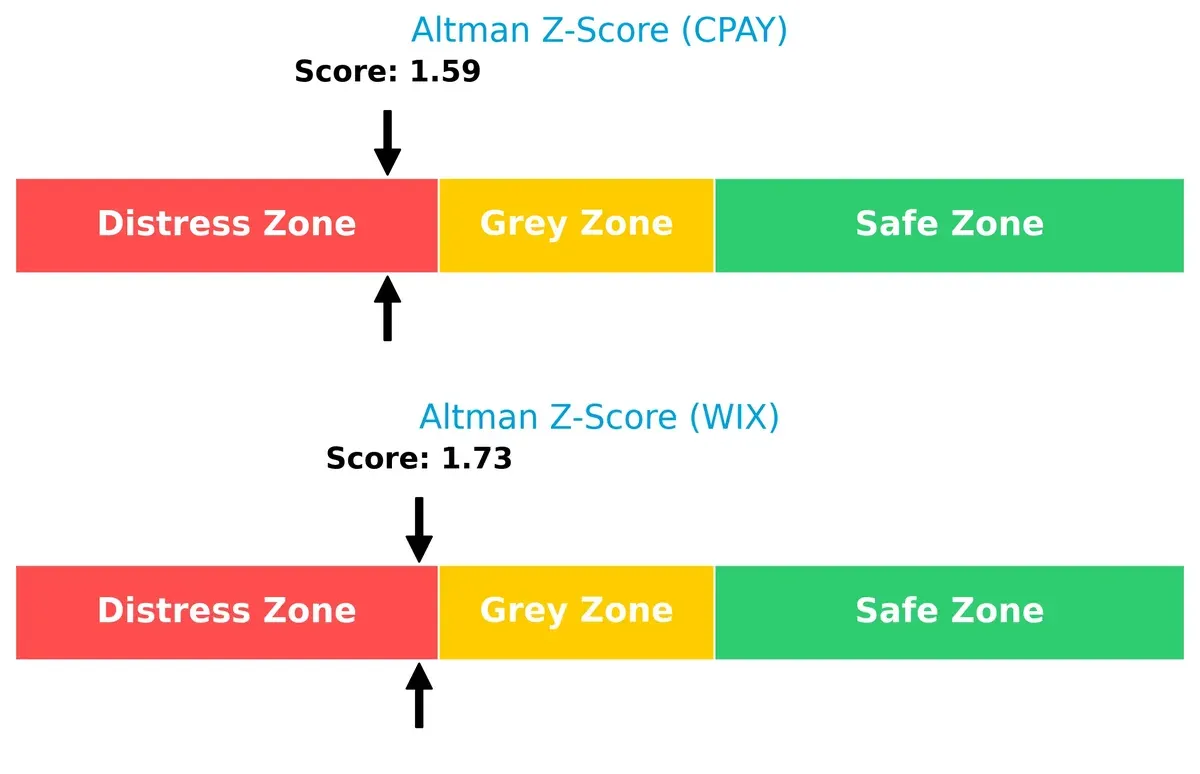
Bankruptcy Risk: Solvency Showdown
Corpay and Wix both reside in the Altman Z-Score distress zone, scoring 1.59 and 1.73 respectively, implying elevated bankruptcy risk in the current cycle:
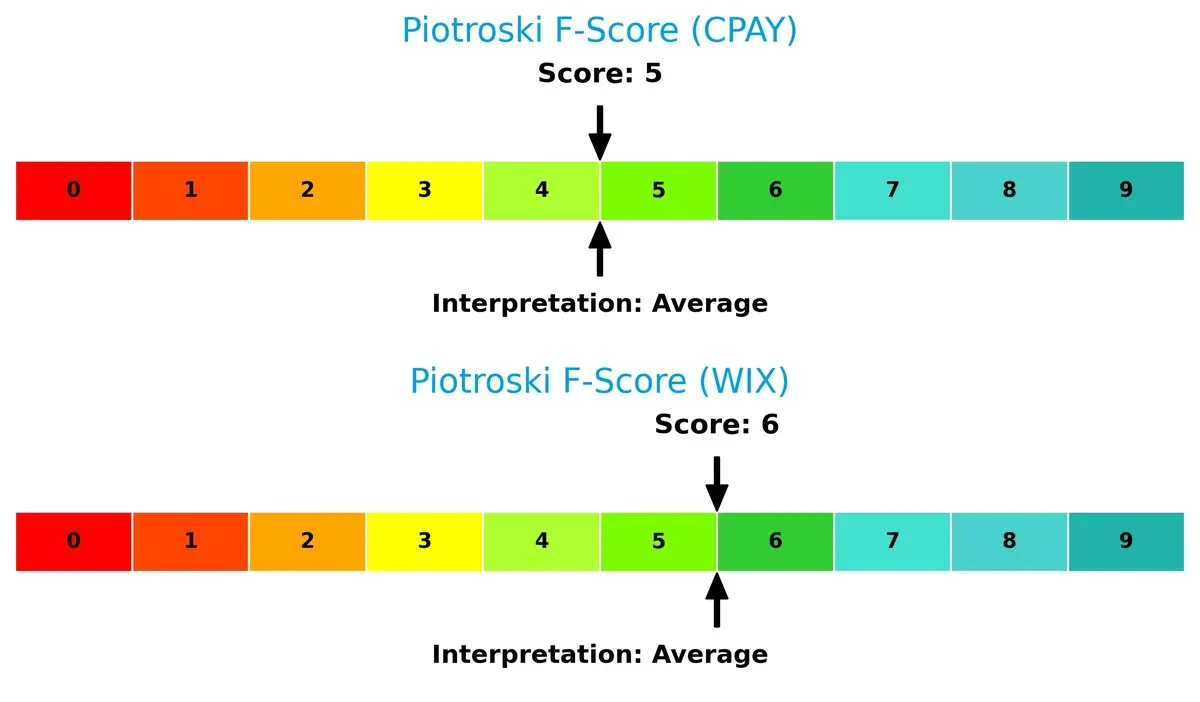
Financial Health: Quality of Operations
Both companies show average Piotroski F-Scores—Corpay at 5 and Wix at 6—indicating moderate financial health with no immediate red flags, but room for operational improvement remains:
How are the two companies positioned?
This section dissects Corpay and Wix’s operational DNA by comparing their revenue distribution and internal dynamics. The goal is to confront their economic moats and identify which model offers the most resilient competitive advantage today.
Revenue Segmentation: The Strategic Mix
The following visual comparison dissects how Corpay, Inc. and Wix.com Ltd. diversify their income streams and where their primary sector bets lie:
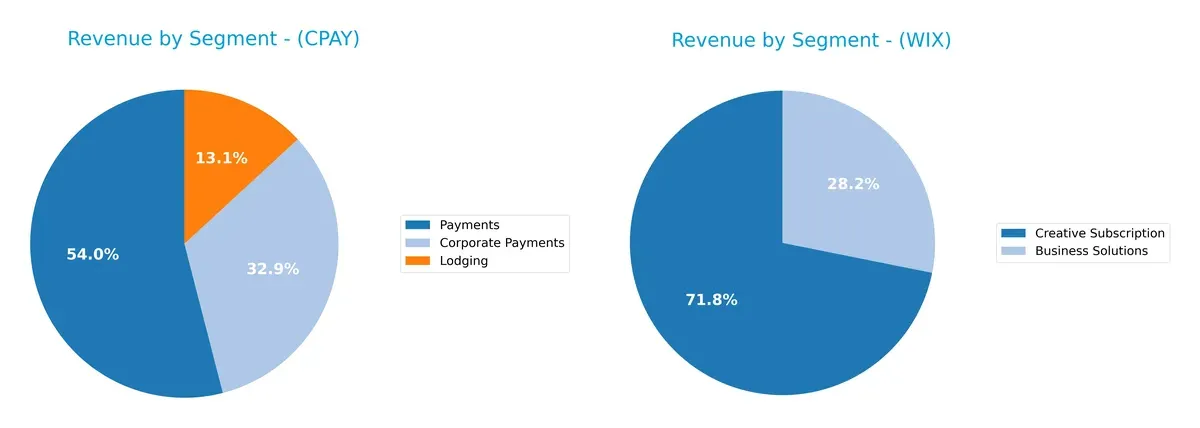
Corpay anchors its revenue in Payments at $2B, with Corporate Payments ($1.2B) and Lodging ($489M) trailing. Wix pivots between Creative Subscription at $1.26B and Business Solutions at $496M, showing a more balanced mix. Corpay’s reliance on Payments signals concentration risk but strong infrastructure dominance. Wix’s split fosters ecosystem lock-in, reducing dependency on a single segment and enhancing resilience.
Strengths and Weaknesses Comparison
This table compares the Strengths and Weaknesses of Corpay, Inc. and Wix.com Ltd.:
Corpay Strengths
- Strong net margin at 23.62%
- High ROE at 27.55%
- Favorable WACC at 6.26%
- Diverse revenue streams across Corporate Payments, Lodging, and Payments
- Significant presence in US, UK, and Brazil
- High fixed asset turnover at 9.59
Wix Strengths
- Favorable interest coverage at 40.14
- Favorable PB ratio despite high PE
- Neutral ROIC at 9.13%
- Diverse revenue from Business Solutions and Creative Subscription
- Growing global footprint in North America, Europe, Asia Pacific, and Latin America
- Solid fixed asset turnover at 3.33
Corpay Weaknesses
- Unfavorable PB ratio at 5.43
- Current ratio below 1 at 0.98, indicating liquidity risk
- High debt-to-equity at 2.58
- Low asset turnover at 0.17
- No dividend yield
- Slightly unfavorable overall financial ratios
Wix Weaknesses
- Negative ROE at -175.57%
- Unfavorable PE ratio at 86.21, indicating overvaluation risk
- Current ratio below 1 at 0.84
- High debt-to-assets at 50.7%
- No dividend yield
- Slightly unfavorable overall financial ratios
Corpay exhibits strong profitability metrics and diversified revenues but faces liquidity and leverage concerns. Wix shows robust interest coverage and geographical reach but struggles with profitability and valuation issues. Both companies present distinct financial risks to consider in their strategic outlooks.
The Moat Duel: Analyzing Competitive Defensibility
A structural moat is the only reliable barrier protecting long-term profits from relentless competitive erosion. Let’s dissect the moats of Corpay, Inc. and Wix.com Ltd.:
Corpay, Inc.: Cost Advantage with Margin Resilience
Corpay’s moat stems from its cost-efficient payment infrastructure, reflected in a strong 43% EBIT margin and 24% net margin. Despite a declining ROIC trend, its global payment network and expanding corporate payment products could deepen its advantage in 2026.
Wix.com Ltd.: Network Effects Driving Growth
Wix leverages network effects through a vast user base and integrated platform services, fueling 13% revenue growth and accelerating EBIT margin expansion. While ROIC remains low, rapid improvement signals strengthening profitability and potential market disruption ahead.
Cost Efficiency vs. Network Effects: The Moat Showdown
Corpay holds a deeper moat through consistent value creation and superior margin stability, despite a declining ROIC. Wix’s expanding profitability and network-driven growth offer promise but fall short of Corpay’s entrenched cost advantage. Corpay is better positioned to defend its market share in a competitive landscape.
Which stock offers better returns?
Over the past year, Corpay, Inc. showed a strong upward price movement with buyer dominance, while Wix.com Ltd. experienced significant declines amid seller control.
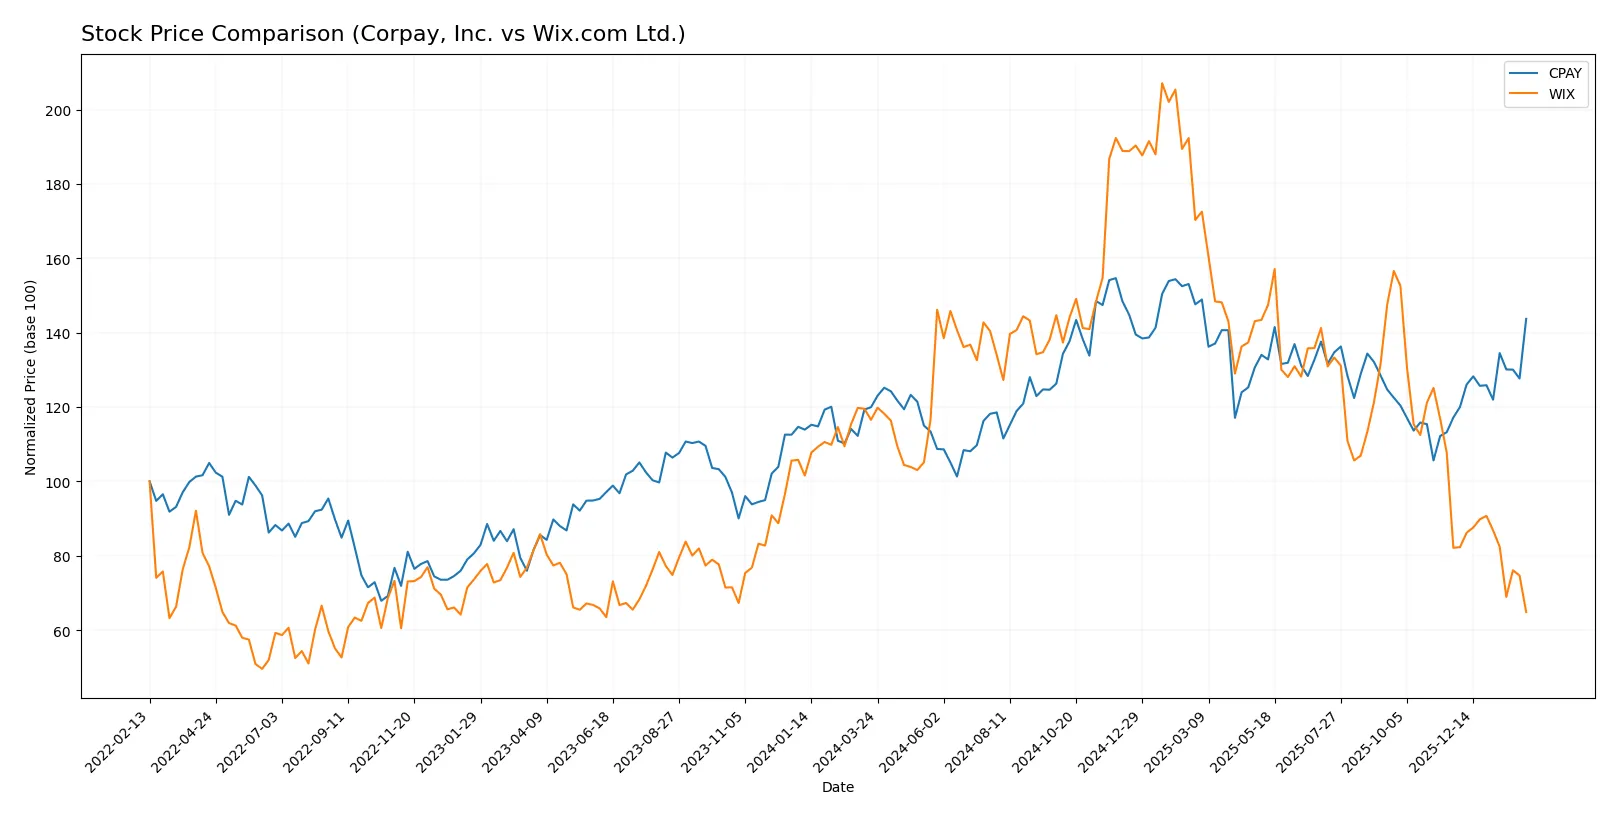
Trend Comparison
Corpay, Inc. posted a 19.8% price increase over the past 12 months, indicating a bullish trend with accelerating momentum and high volatility. The stock’s highest price reached 381.18, and buyer activity has increased consistently.
Wix.com Ltd. declined by 44.37% over the same period, reflecting a bearish trend with deceleration. The stock hit a low of 75.42, and recent months show seller dominance, confirming downward pressure.
Corpay’s stock outperformed Wix significantly, delivering the highest market returns with sustained buyer interest and a positive price trajectory.
Target Prices
Analysts present a mixed but constructive outlook on Corpay, Inc. and Wix.com Ltd.
| Company | Target Low | Target High | Consensus |
|---|---|---|---|
| Corpay, Inc. | 300 | 390 | 359.33 |
| Wix.com Ltd. | 70 | 210 | 154.09 |
Corpay’s consensus target at 359.33 slightly exceeds its current 354.19 price, suggesting modest upside. Wix’s consensus of 154.09 implies significant growth potential versus its current 75.42 share price.

Don’t Let Luck Decide Your Entry Point
Optimize your entry points with our advanced ProRealTime indicators. You’ll get efficient buy signals with precise price targets for maximum performance. Start outperforming now!
How do institutions grade them?
Corpay, Inc. Grades
Below is a summary of recent institutional grades for Corpay, Inc.:
| Grading Company | Action | New Grade | Date |
|---|---|---|---|
| Mizuho | Maintain | Neutral | 2026-02-06 |
| JP Morgan | Maintain | Overweight | 2026-02-05 |
| RBC Capital | Maintain | Sector Perform | 2026-02-05 |
| Morgan Stanley | Maintain | Overweight | 2026-02-05 |
| Morgan Stanley | Upgrade | Overweight | 2026-01-26 |
| Oppenheimer | Maintain | Outperform | 2026-01-12 |
| Oppenheimer | Upgrade | Outperform | 2025-12-05 |
| UBS | Maintain | Neutral | 2025-11-06 |
| RBC Capital | Maintain | Sector Perform | 2025-11-06 |
| JP Morgan | Maintain | Overweight | 2025-11-06 |
Wix.com Ltd. Grades
Below is a summary of recent institutional grades for Wix.com Ltd.:
| Grading Company | Action | New Grade | Date |
|---|---|---|---|
| Oppenheimer | Maintain | Outperform | 2026-02-02 |
| Citizens | Maintain | Market Outperform | 2026-01-22 |
| Barclays | Maintain | Overweight | 2026-01-21 |
| Morgan Stanley | Maintain | Overweight | 2026-01-15 |
| Wells Fargo | Maintain | Overweight | 2025-12-19 |
| Cantor Fitzgerald | Maintain | Overweight | 2025-12-11 |
| Benchmark | Maintain | Buy | 2025-11-20 |
| Needham | Maintain | Buy | 2025-11-20 |
| Barclays | Maintain | Overweight | 2025-11-20 |
| Wells Fargo | Maintain | Overweight | 2025-11-20 |
Which company has the best grades?
Wix.com Ltd. consistently receives higher ratings such as Buy and Market Outperform, indicating stronger analyst confidence. Corpay, Inc. shows solid Overweight and Outperform ratings but with more Neutral and Sector Perform grades. Investors might perceive Wix as having a more favorable outlook based on these grades.
Risks specific to each company
The following categories identify the critical pressure points and systemic threats facing both firms in the 2026 market environment:
1. Market & Competition
Corpay, Inc.
- Operates in payments with global reach but faces intense competition from fintech disruptors.
Wix.com Ltd.
- Competes in cloud-based web development with rapid innovation but struggles with profitability and user retention.
2. Capital Structure & Debt
Corpay, Inc.
- High debt-to-equity ratio (2.58) signals financial leverage risk despite moderate interest coverage.
Wix.com Ltd.
- Negative debt-to-equity suggests complex balance sheet; high debt-to-assets (50.7%) raises solvency concerns.
3. Stock Volatility
Corpay, Inc.
- Beta of 0.81 indicates below-market volatility, offering relative stability.
Wix.com Ltd.
- Beta of 1.37 signals above-market volatility, increasing investment risk.
4. Regulatory & Legal
Corpay, Inc.
- Subject to payment and data privacy regulations across multiple jurisdictions.
Wix.com Ltd.
- Faces regulatory scrutiny on data privacy and platform compliance in global markets.
5. Supply Chain & Operations
Corpay, Inc.
- Relies on complex payment networks and technology infrastructure, vulnerable to disruptions.
Wix.com Ltd.
- Depends on cloud infrastructure and software stability, sensitive to outages and cyber risks.
6. ESG & Climate Transition
Corpay, Inc.
- Moderate exposure to ESG risks via corporate travel and fleet management sectors.
Wix.com Ltd.
- Faces ESG pressures related to data center energy use and digital inclusivity.
7. Geopolitical Exposure
Corpay, Inc.
- International operations expose it to currency fluctuations and trade policy changes.
Wix.com Ltd.
- Israeli base with global customers subjects it to Middle East geopolitical risks and global trade tensions.
Which company shows a better risk-adjusted profile?
Corpay’s most impactful risk is its high financial leverage, which threatens stability despite steady profitability. Wix’s critical risk lies in poor profitability and high valuation multiples, coupled with elevated volatility. Corpay’s lower beta and stronger ROE suggest a better risk-adjusted profile. Recent data reveal Corpay’s distressed Altman Z-Score signals caution but outperforms Wix’s even weaker financial health and extreme valuation metrics.
Final Verdict: Which stock to choose?
Corpay, Inc. stands out as a cash-generating powerhouse with solid income growth and a strong return on equity. Its main point of vigilance is its elevated leverage and tight liquidity, which could pressure financial flexibility. It fits well within an aggressive growth portfolio willing to tolerate some balance sheet risk.
Wix.com Ltd. benefits from a growing profitability trend and a strategic moat in recurring revenue from its cloud-based platform. Compared to Corpay, Wix offers a safer interest coverage profile but faces challenges in equity returns and valuation multiples. It suits a GARP investor seeking growth tempered by gradual stability.
If you prioritize cash flow strength and robust equity returns, Corpay commands attention despite its leverage. However, if you seek improving profitability with recurring revenue stability, Wix offers better growth dynamics but at a higher valuation risk. Each presents a nuanced scenario tailored to different investor risk appetites and strategic goals.
Disclaimer: Investment carries a risk of loss of initial capital. The past performance is not a reliable indicator of future results. Be sure to understand risks before making an investment decision.
Go Further
I encourage you to read the complete analyses of Corpay, Inc. and Wix.com Ltd. to enhance your investment decisions: