Home > Comparison > Technology > CPAY vs VERI
The strategic rivalry between Corpay, Inc. and Veritone, Inc. shapes the evolving landscape of the technology sector. Corpay operates as a capital-intensive payments solutions provider with a broad global footprint. In contrast, Veritone focuses on high-margin AI software infrastructure, leveraging machine learning across diverse markets. This analysis will assess which company’s business model offers the superior risk-adjusted return potential for a well-diversified investment portfolio.

Table of contents
Companies Overview
Corpay and Veritone represent two distinct pillars in the software infrastructure space with meaningful market footprints.
Corpay, Inc.: Payments Infrastructure Powerhouse
Corpay dominates the payments infrastructure sector by enabling businesses and consumers to manage vehicle-related and corporate payments globally. Its core revenue derives from vehicle payment solutions, prepaid cards, and corporate payment automation. In 2026, Corpay focuses on expanding cross-border payment solutions and enhancing lodging and travel expense services, reinforcing its comprehensive payment network.
Veritone, Inc.: AI-Driven Data Insight Specialist
Veritone leads in artificial intelligence computing solutions via its aiWARE platform, which extracts insights from large data sets using machine learning and cognitive processes. Its revenue stems from AI-powered analytics and media advertising agency services. Veritone’s 2026 strategy emphasizes refining AI capabilities across diverse verticals like media, legal, and energy, strengthening its role as an AI infrastructure innovator.
Strategic Collision: Similarities & Divergences
Corpay relies on a transactional payments ecosystem, while Veritone pursues an AI-centric data insights model. Their competition centers on infrastructure relevance—Corpay in financial flows and Veritone in data intelligence. Corpay offers stability through broad payment networks; Veritone presents higher growth volatility tied to AI adoption, defining sharply different investment risk profiles.
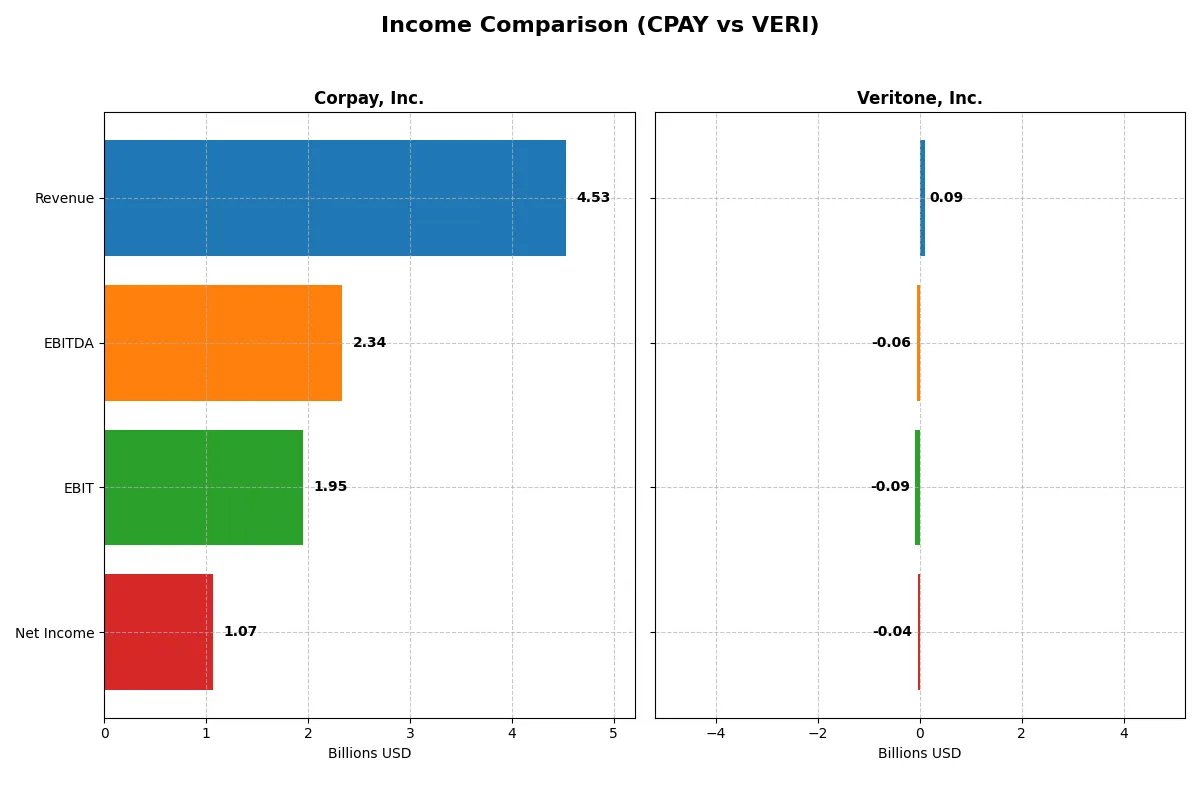
Income Statement Comparison
This data dissects the core profitability and scalability of both corporate engines to reveal who dominates the bottom line:
| Metric | Corpay, Inc. (CPAY) | Veritone, Inc. (VERI) |
|---|---|---|
| Revenue | 4.53B | 92.6M |
| Cost of Revenue | 1.36B | 27.3M |
| Operating Expenses | 1.21B | 153.6M |
| Gross Profit | 3.17B | 65.4M |
| EBITDA | 2.34B | -58.8M |
| EBIT | 1.95B | -88.1M |
| Interest Expense | 404M | 12.1M |
| Net Income | 1.07B | -37.4M |
| EPS | 15.25 | -0.98 |
| Fiscal Year | 2025 | 2024 |
Income Statement Analysis: The Bottom-Line Duel
This income statement comparison reveals the true efficiency and profitability dynamics powering each company’s financial engine.
Corpay, Inc. Analysis
Corpay’s revenue rose steadily from 2.8B in 2021 to 4.5B in 2025, with net income climbing from 840M to 1.07B. Its gross margin remains robust near 70%, while net margins hold strong at around 24%. The 2025 results show solid momentum with a 14% revenue increase and a 7.6% EPS growth, underscoring operational efficiency despite a slight net margin dip.
Veritone, Inc. Analysis
Veritone’s revenue peaked at 150M in 2022 then declined to 93M in 2024, with net losses narrowing from -65M in 2021 to -37M in 2024. Gross margins hover favorably around 70%, but EBIT and net margins remain negative, reflecting ongoing operational challenges. Despite setbacks, recent improvements in net margin and EPS growth signal potential for future turnaround.
Margin Strength vs. Recovery Trajectory
Corpay leads with consistent top-line growth, healthy margins, and positive net income, demonstrating clear financial strength. Veritone shows early-stage recovery signs but struggles with negative profitability and shrinking revenues. For investors, Corpay’s stable profitability profile offers a more attractive risk-return balance compared to Veritone’s turnaround potential.
Financial Ratios Comparison
These vital ratios act as a diagnostic tool to expose the underlying fiscal health, valuation premiums, and capital efficiency of the companies compared below:
| Ratios | Corpay, Inc. (CPAY) | Veritone, Inc. (VERI) |
|---|---|---|
| ROE | 27.5% | -277.9% |
| ROIC | 8.8% (approx.) | -58.3% |
| P/E | 19.7 | -3.3 |
| P/B | 5.43 | 9.27 |
| Current Ratio | 0.98 | 0.97 |
| Quick Ratio | 0.98 | 0.97 |
| D/E | 2.58 | 8.91 |
| Debt-to-Assets | 37.9% | 60.5% |
| Interest Coverage | 4.83 | -7.31 |
| Asset Turnover | 0.17 | 0.47 |
| Fixed Asset Turnover | 9.59 | 8.51 |
| Payout ratio | 0 | 0 |
| Dividend yield | 0 | 0 |
| Fiscal Year | 2025 | 2024 |
Efficiency & Valuation Duel: The Vital Signs
Ratios serve as a company’s DNA, uncovering hidden risks and operational strengths that raw numbers often obscure.
Corpay, Inc.
Corpay posts a robust 27.55% ROE and a strong 23.62% net margin, signaling solid profitability. Its P/E of 19.73 appears fairly valued, though a high P/B of 5.43 flags potential overvaluation. The firm pays no dividends, instead reinvesting earnings to sustain growth and operational efficiency.
Veritone, Inc.
Veritone struggles with deeply negative returns: a -277.91% ROE and -40.36% net margin highlight unprofitability. Despite a negative P/E, its valuation remains stretched with a 9.27 P/B and heavy debt leverage (D/E of 8.91). The company neither pays dividends nor shows free cash flow, focusing instead on R&D investments.
Profitability Strength vs. Financial Strain
Corpay offers superior profitability and a more balanced valuation, despite some leverage concerns. Veritone shows significant financial stress and operational losses, increasing investment risk. Corpay suits investors prioritizing operational safety; Veritone fits those seeking high-risk growth plays.
Which one offers the Superior Shareholder Reward?
Corpay, Inc. (CPAY) and Veritone, Inc. (VERI) both forgo dividends, focusing on reinvestment and buybacks. CPAY shows zero dividend yield but boasts strong free cash flow coverage and consistent buybacks, fueling growth. VERI struggles with negative margins and cash flow, limiting buybacks. I see CPAY’s disciplined capital allocation and robust operating margins as far more sustainable, offering superior total shareholder return potential in 2026.
Comparative Score Analysis: The Strategic Profile
The radar chart reveals the fundamental DNA and trade-offs of Corpay, Inc. and Veritone, Inc., highlighting their strategic strengths and weaknesses:
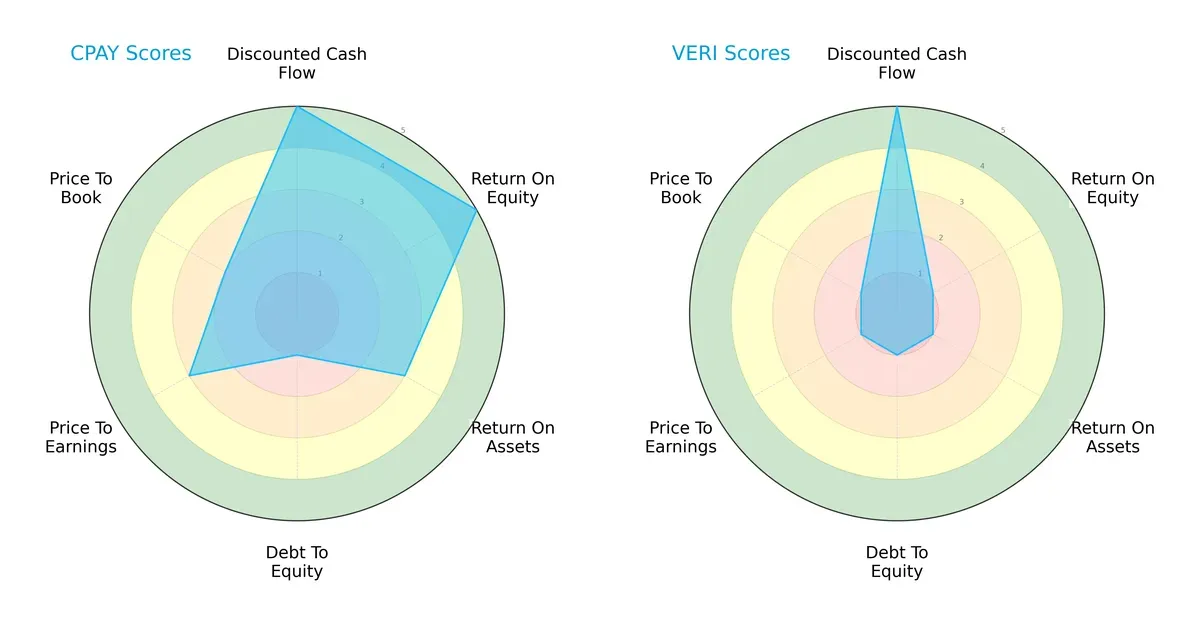
Corpay displays a balanced profile with strong DCF and ROE scores, moderate ROA, and average valuation metrics. However, its high debt-to-equity risk stands out as a red flag. Veritone, while sharing a top DCF score, suffers from very weak profitability and valuation scores, relying heavily on discounted cash flow projections alone.
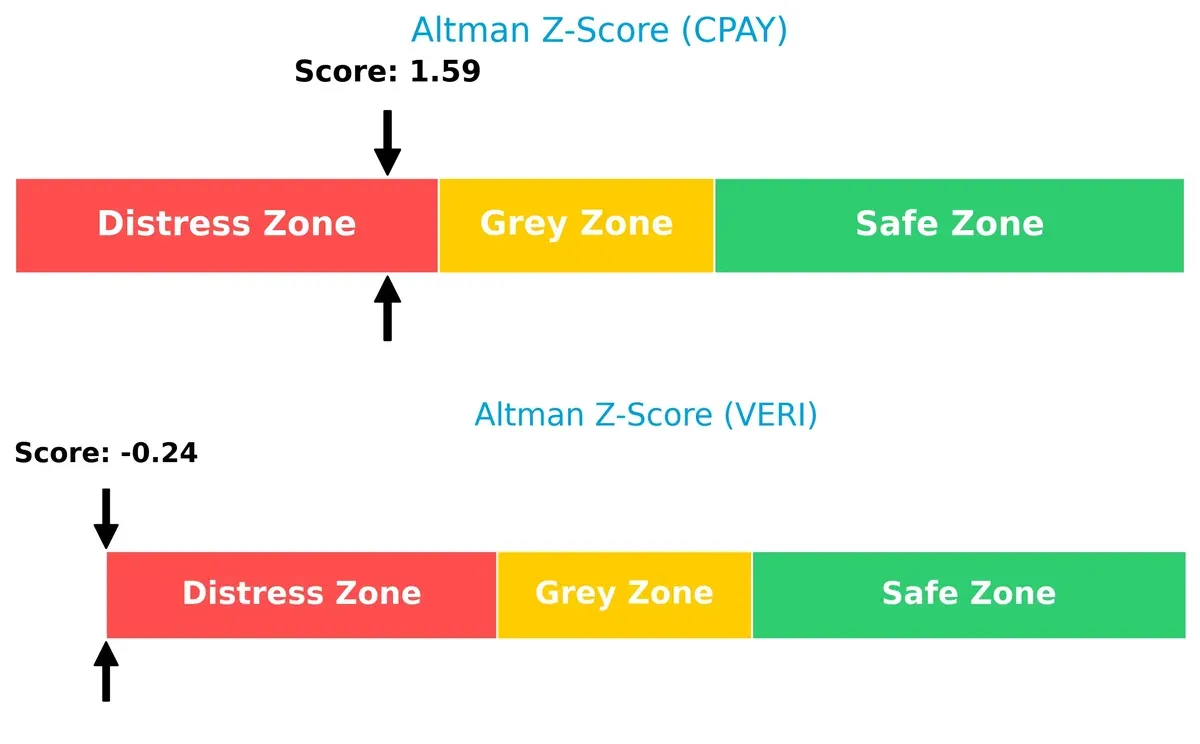
Bankruptcy Risk: Solvency Showdown
Corpay’s Altman Z-Score of 1.59 slightly outperforms Veritone’s -0.24, yet both remain in the distress zone. This signals elevated bankruptcy risk in this cycle, urging caution:
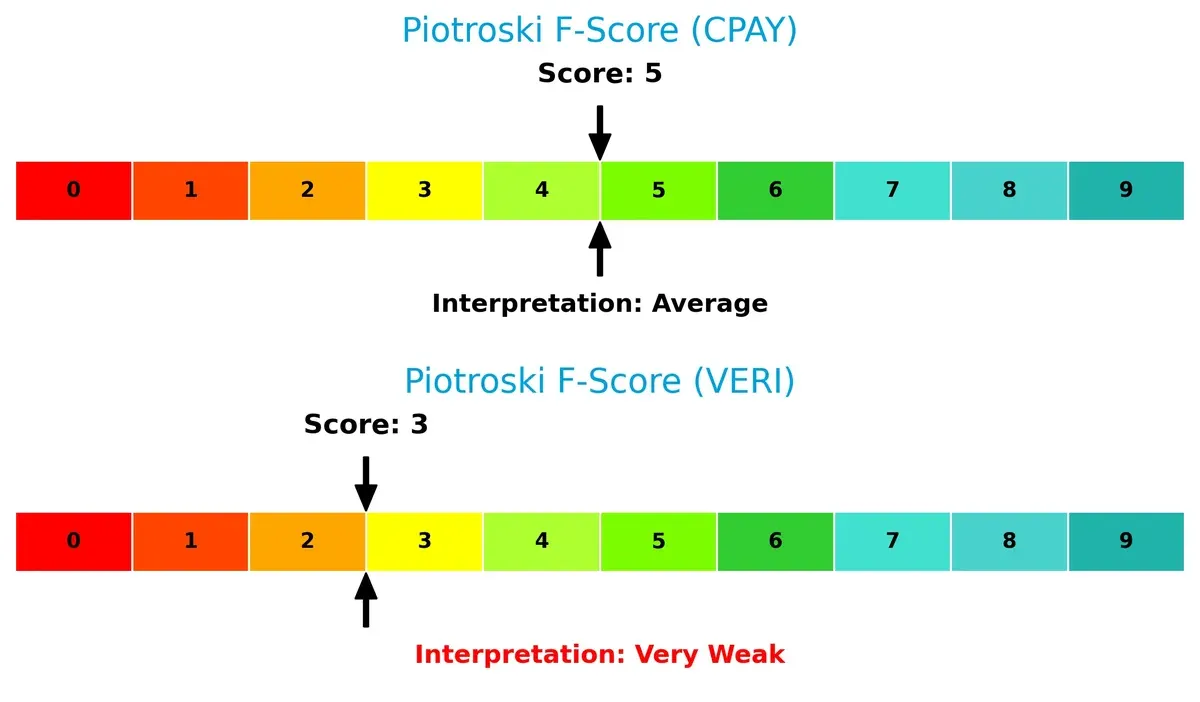
Financial Health: Quality of Operations
Corpay’s Piotroski F-Score of 5 indicates average financial health, markedly better than Veritone’s weak score of 3. Veritone’s low score flags operational weaknesses and potential risk in earnings quality:
How are the two companies positioned?
This section dissects Corpay and Veritone’s operational DNA by comparing their revenue distribution and internal dynamics. The goal is to confront their economic moats and identify which model offers the most resilient, sustainable competitive advantage today.
Revenue Segmentation: The Strategic Mix
This visual comparison dissects how Corpay, Inc. and Veritone, Inc. diversify their income streams and where their primary sector bets lie:
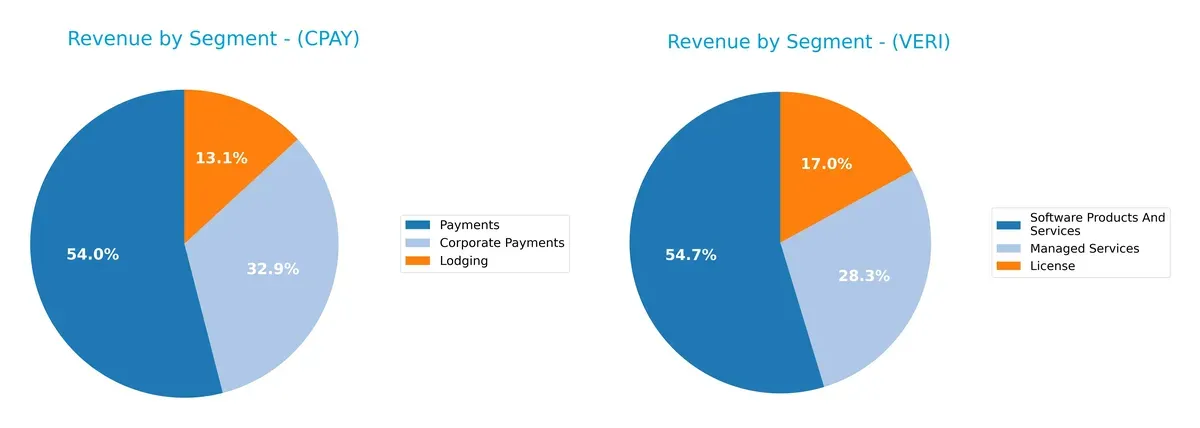
Corpay anchors its revenue on Payments at $2B, with Corporate Payments ($1.2B) and Lodging ($489M) trailing. This concentration reflects a stronghold in financial transaction services. Veritone’s top 2024 segments—Software Products and Services ($61M), Managed Services ($32M), and License ($19M)—show a more balanced spread. Corpay’s focus drives infrastructure dominance but carries concentration risk. Veritone’s diversification suggests strategic agility amid evolving AI and software markets.
Strengths and Weaknesses Comparison
This table compares the Strengths and Weaknesses of Corpay, Inc. and Veritone, Inc.:
Corpay Strengths
- Strong profitability with 23.62% net margin and 27.55% ROE
- Favorable WACC at 6.26% supports capital efficiency
- Large global presence including US, UK, Brazil
- Diversified revenue streams across payments and lodging
- High fixed asset turnover at 9.59 indicates efficient use of assets
Veritone Strengths
- Favorable PE ratio despite negative earnings hints market optimism
- Reasonable fixed asset turnover at 8.51
- Diverse product segments including licensing and managed services
- Neutral quick ratio reflects some liquidity stability
Corpay Weaknesses
- Low current ratio at 0.98 signals liquidity risk
- High debt-to-equity at 2.58 increases financial leverage
- Unfavorable PB at 5.43 suggests overvaluation
- Asset turnover weak at 0.17 lowers operational efficiency
- Zero dividend yield may deter income investors
Veritone Weaknesses
- Deep negative profitability with -40.36% net margin and -277.91% ROE
- Very unfavorable ROIC at -58.27% and high WACC at 11.27%
- High leverage with debt-to-equity of 8.91 and interest coverage negative
- Poor liquidity with current ratio at 0.97
- Unfavorable PB at 9.27 and zero dividend yield
Corpay’s strengths lie in its profitability and geographic diversification, while liquidity and leverage remain concerns. Veritone struggles with profitability and high financial risk, despite some operational diversity. Both companies face valuation and liquidity challenges, impacting their strategic options going forward.
The Moat Duel: Analyzing Competitive Defensibility
A structural moat is the only true shield protecting long-term profits from relentless competition erosion. Let’s dissect how these companies defend their turf:
Corpay, Inc.: Cost Advantage in Payments Infrastructure
Corpay’s moat stems from cost advantage via scale in global payments processing. This shows in its robust 43% EBIT margin and consistent revenue growth. Expansion into cross-border payments could deepen its lead in 2026.
Veritone, Inc.: Intangible Asset Moat in AI Software
Veritone relies on proprietary AI algorithms and platform integration as its moat, unlike Corpay’s cost edge. However, its negative EBIT margin signals fragile profitability. Innovation in AI applications offers upside but also risk of disruption.
Verdict: Cost Efficiency vs. AI Innovation Moat
Corpay’s wider moat rests on proven cost leadership and positive ROIC above WACC, delivering stable profits. Veritone’s moat is narrower and unprofitable, facing shrinking returns. Corpay stands better equipped to defend market share amid competitive pressures.
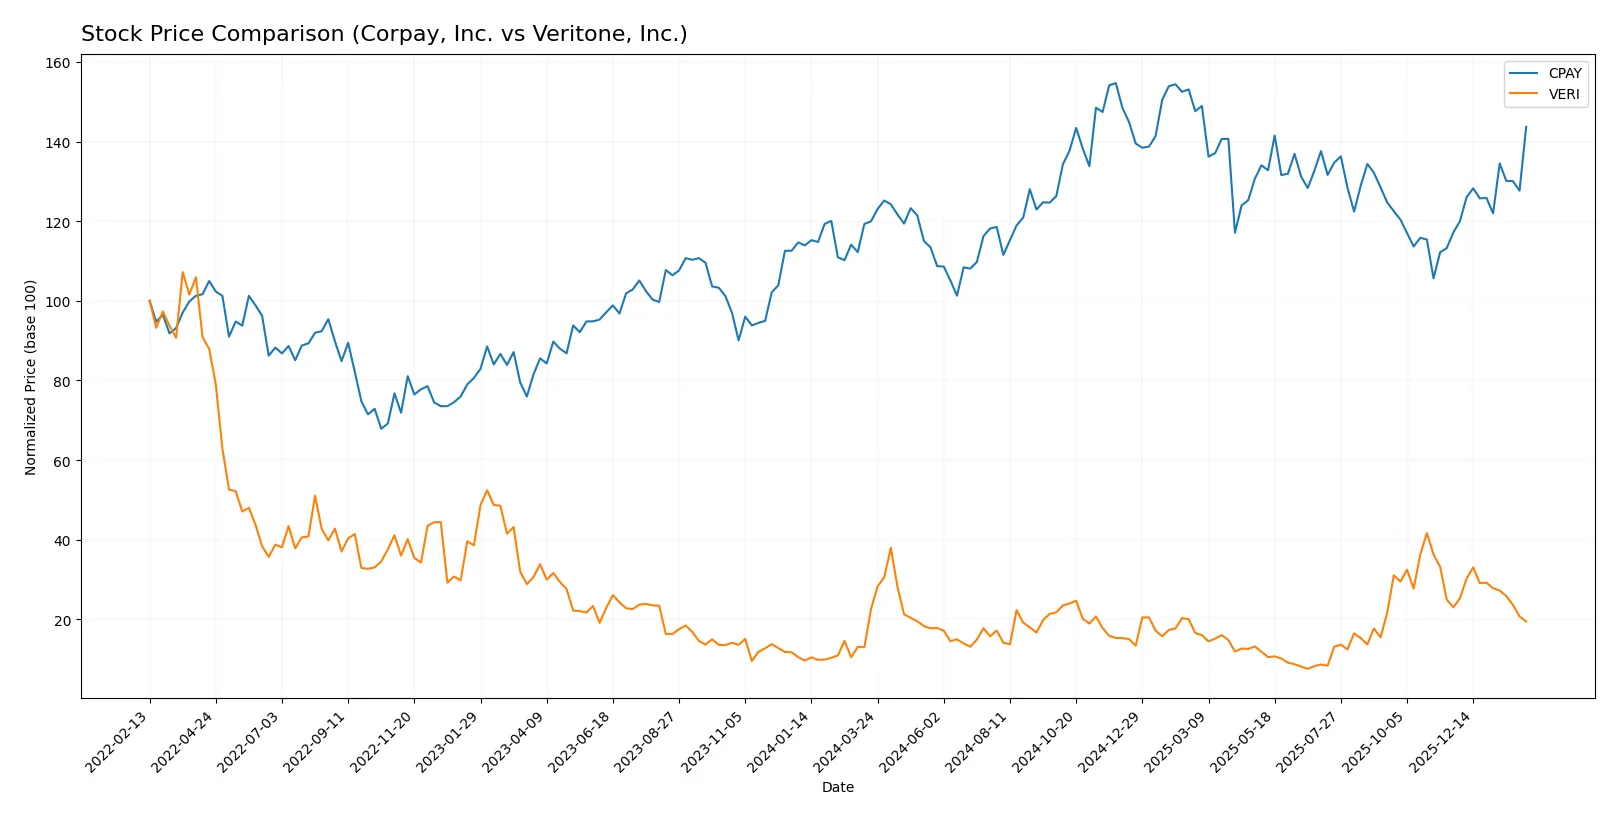
Which stock offers better returns?
Over the past 12 months, Corpay, Inc. and Veritone, Inc. displayed contrasting price moves, with Corpay accelerating upward and Veritone declining steadily.
Trend Comparison
Corpay, Inc. shows a bullish trend with a 19.8% price increase over the past year. The acceleration in momentum and a high volatility of 31.25 highlight strong investor interest and price swings.
Veritone, Inc. exhibits a bearish trend with a 13.66% price decrease during the same period. The deceleration and low volatility of 1.25 reflect waning investor confidence and subdued price movement.
Corpay’s bullish trend significantly outperforms Veritone’s bearish trajectory, delivering the highest market performance in the 12-month span.
Target Prices
Analysts present a clear consensus on target prices for Corpay, Inc. and Veritone, Inc.
| Company | Target Low | Target High | Consensus |
|---|---|---|---|
| Corpay, Inc. | 300 | 390 | 359.33 |
| Veritone, Inc. | 9 | 10 | 9.5 |
Corpay’s target consensus sits slightly above its current price of 354.19, indicating moderate upside potential. Veritone’s targets far exceed its current 3.35 price, suggesting strong expected growth but also high risk.

Don’t Let Luck Decide Your Entry Point
Optimize your entry points with our advanced ProRealTime indicators. You’ll get efficient buy signals with precise price targets for maximum performance. Start outperforming now!
How do institutions grade them?
Below is a summary of recent stock grades assigned to Corpay, Inc. and Veritone, Inc. by recognized financial institutions:
Corpay, Inc. Grades
The table below lists recent grades from reputable analysts for Corpay, Inc.:
| Grading Company | Action | New Grade | Date |
|---|---|---|---|
| Mizuho | Maintain | Neutral | 2026-02-06 |
| JP Morgan | Maintain | Overweight | 2026-02-05 |
| RBC Capital | Maintain | Sector Perform | 2026-02-05 |
| Morgan Stanley | Maintain | Overweight | 2026-02-05 |
| Morgan Stanley | Upgrade | Overweight | 2026-01-26 |
| Oppenheimer | Maintain | Outperform | 2026-01-12 |
| Oppenheimer | Upgrade | Outperform | 2025-12-05 |
| UBS | Maintain | Neutral | 2025-11-06 |
| RBC Capital | Maintain | Sector Perform | 2025-11-06 |
| JP Morgan | Maintain | Overweight | 2025-11-06 |
Veritone, Inc. Grades
The table below shows recent grades from reliable grading companies for Veritone, Inc.:
| Grading Company | Action | New Grade | Date |
|---|---|---|---|
| D. Boral Capital | Maintain | Buy | 2026-01-30 |
| D. Boral Capital | Maintain | Buy | 2025-12-09 |
| D. Boral Capital | Maintain | Buy | 2025-12-04 |
| D. Boral Capital | Maintain | Buy | 2025-12-02 |
| Needham | Maintain | Buy | 2025-12-02 |
| D. Boral Capital | Maintain | Buy | 2025-11-07 |
| D. Boral Capital | Maintain | Buy | 2025-10-28 |
| HC Wainwright & Co. | Maintain | Buy | 2025-10-20 |
| D. Boral Capital | Maintain | Buy | 2025-10-15 |
| D. Boral Capital | Maintain | Buy | 2025-09-24 |
Which company has the best grades?
Veritone, Inc. consistently receives “Buy” ratings, indicating stronger analyst confidence. Corpay, Inc.’s grades range from “Neutral” to “Outperform.” Veritone’s superior grades may signal higher investor enthusiasm and potential momentum.
Risks specific to each company
The following categories identify the critical pressure points and systemic threats facing both firms in the 2026 market environment:
1. Market & Competition
Corpay, Inc.
- Established payments infrastructure with global reach faces intense competition from fintech and legacy firms.
Veritone, Inc.
- AI platform competes in a fast-evolving, crowded market with rapid innovation and scale challenges.
2. Capital Structure & Debt
Corpay, Inc.
- High debt-to-equity ratio (2.58) raises financial risk despite decent interest coverage (4.83x).
Veritone, Inc.
- Excessive leverage (D/E 8.91) coupled with negative interest coverage (-7.3x) signals severe solvency concerns.
3. Stock Volatility
Corpay, Inc.
- Beta of 0.81 indicates moderate volatility, lower than the tech sector average.
Veritone, Inc.
- High beta of 2.14 reflects extreme price swings and investor uncertainty.
4. Regulatory & Legal
Corpay, Inc.
- Payment processing exposed to stringent financial regulations across multiple jurisdictions.
Veritone, Inc.
- AI algorithms face increasing scrutiny over data privacy and compliance risks.
5. Supply Chain & Operations
Corpay, Inc.
- Reliant on stable partnerships for fuel, toll, and lodging services; operational disruptions could impact revenues.
Veritone, Inc.
- Dependent on cloud infrastructure and third-party data sources; interruptions may hinder AI service delivery.
6. ESG & Climate Transition
Corpay, Inc.
- Exposure to sustainability demands in fleet and fuel sectors; transition risks loom.
Veritone, Inc.
- Faces pressure to align AI solutions with ethical and climate-conscious standards.
7. Geopolitical Exposure
Corpay, Inc.
- Operates internationally, vulnerable to currency fluctuations and trade policies.
Veritone, Inc.
- Concentrated in US and UK markets; geopolitical tensions may affect cross-border data flows.
Which company shows a better risk-adjusted profile?
Corpay’s most impactful risk is its stretched capital structure with a high debt load. Veritone’s critical risk lies in its severe financial distress, marked by negative margins and solvency ratios. Between the two, Corpay offers a better risk-adjusted profile, supported by more stable market positioning and lower volatility. Veritone’s alarming Altman Z-score and high beta underscore its precarious financial health and market uncertainty.
Final Verdict: Which stock to choose?
Corpay, Inc. wields unmatched efficiency as its strategic superpower, consistently creating value above its cost of capital. Its main point of vigilance is the elevated leverage and tight liquidity, which could pressure stability in volatile markets. This stock suits investors with an appetite for aggressive growth who can tolerate balance sheet risks.
Veritone, Inc. boasts a strategic moat in its innovative AI platform, aiming for recurring revenue growth. However, it faces significant financial headwinds, including persistent losses and high debt, making it a riskier choice compared to Corpay. It fits portfolios focused on GARP—growth at a reasonable price—seeking turnaround potential with caution.
If you prioritize stability and proven value creation, Corpay outshines Veritone with stronger profitability and a bullish price trend. However, if you seek speculative growth with a technology edge, Veritone offers superior upside potential but commands a premium risk profile. Both require careful risk management aligned with your investment horizon.
Disclaimer: Investment carries a risk of loss of initial capital. The past performance is not a reliable indicator of future results. Be sure to understand risks before making an investment decision.
Go Further
I encourage you to read the complete analyses of Corpay, Inc. and Veritone, Inc. to enhance your investment decisions: