Home > Comparison > Technology > VRSN vs CPAY
The strategic rivalry between VeriSign, Inc. and Corpay, Inc. shapes the future of the technology sector’s software infrastructure. VeriSign operates as a specialized domain name registry and internet security provider, while Corpay delivers comprehensive payment solutions across multiple industries. This head-to-head reflects a contest between niche infrastructure dominance and broad transactional service growth. This analysis aims to identify which trajectory offers superior risk-adjusted returns for a diversified portfolio in 2026.
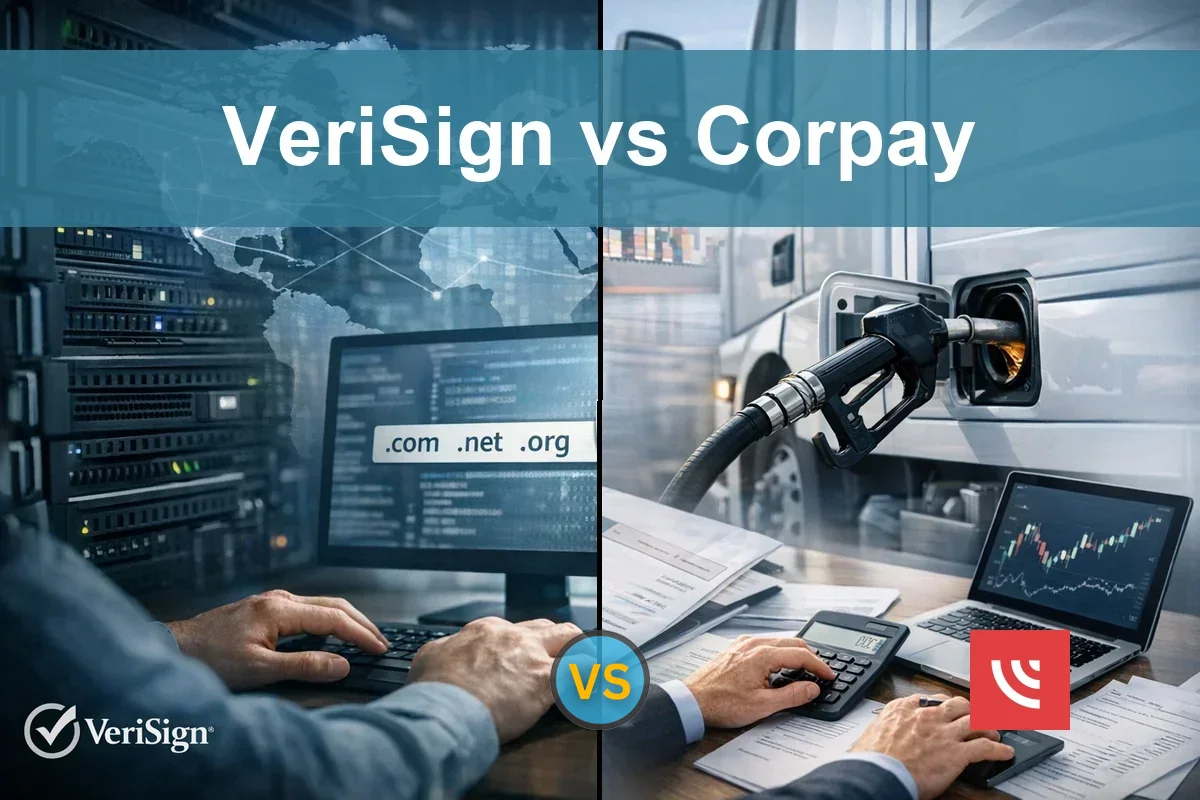
Table of contents
Companies Overview
VeriSign and Corpay both hold pivotal roles in the software infrastructure landscape, shaping digital commerce and payments.
VeriSign, Inc.: Internet Infrastructure Backbone
VeriSign dominates domain name registry services, securing global internet navigation through its control of .com and .net domains. Its core revenue stems from registration and resolution services crucial to e-commerce stability. In 2026, VeriSign emphasizes enhancing internet security, resiliency, and data integrity to maintain its leadership in internet infrastructure.
Corpay, Inc.: Global Payment Solutions Leader
Corpay leads in business payments, managing vehicle, lodging, and corporate expenses worldwide. Its primary revenue derives from vehicle payment solutions and corporate payment automation, including virtual cards and cross-border services. In 2026, Corpay focuses on expanding its payment ecosystem to support business travel and cross-border commerce efficiency.
Strategic Collision: Similarities & Divergences
VeriSign operates a closed ecosystem securing internet infrastructure, while Corpay champions an open payment network serving diverse business needs. Their battleground centers on enabling seamless digital commerce—VeriSign through domain control, Corpay via transactional flow. Their distinct investment profiles reflect VeriSign’s stability and network moat versus Corpay’s growth in global payment innovation.
Income Statement Comparison
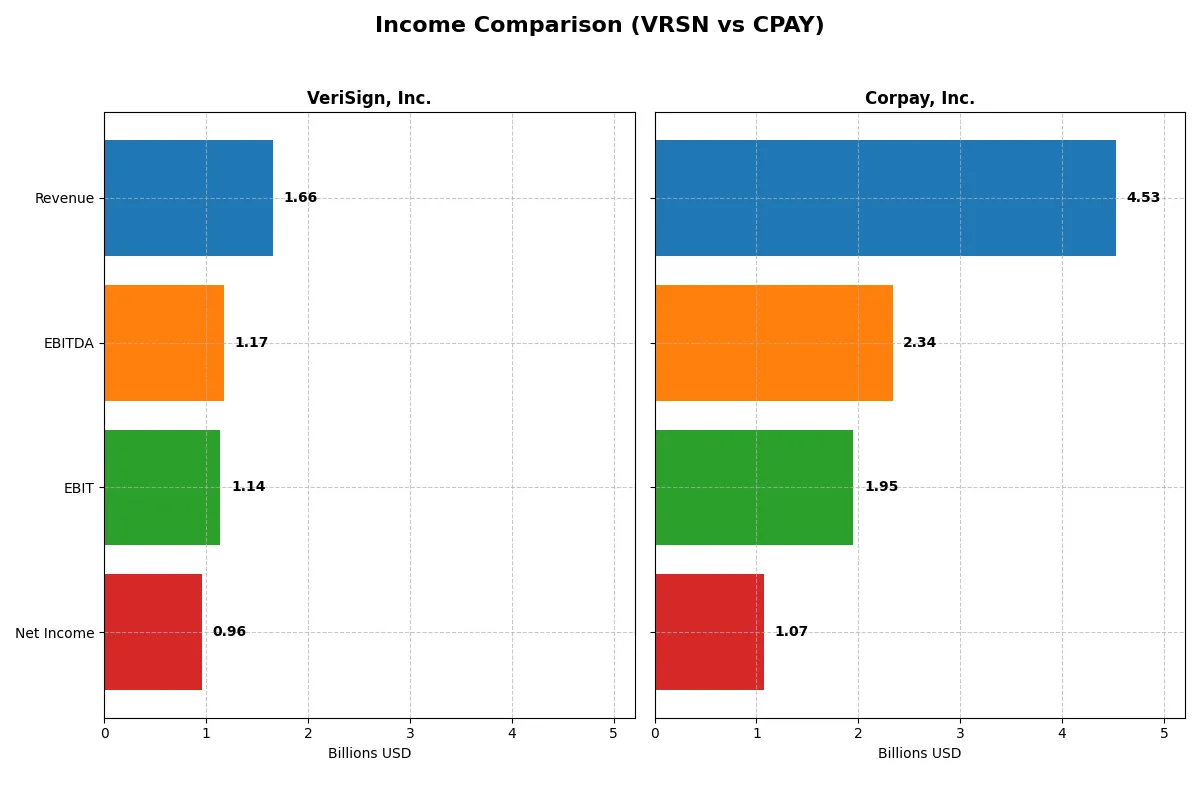
This data dissects the core profitability and scalability of both corporate engines to reveal who dominates the bottom line:
| Metric | VeriSign, Inc. (VRSN) | Corpay, Inc. (CPAY) |
|---|---|---|
| Revenue | 1.66B | 4.53B |
| Cost of Revenue | 196M | 1.36B |
| Operating Expenses | 339M | 1.21B |
| Gross Profit | 1.46B | 3.17B |
| EBITDA | 1.17B | 2.34B |
| EBIT | 1.14B | 1.95B |
| Interest Expense | 77M | 404M |
| Net Income | 956M | 1.07B |
| EPS | 8.83 | 15.25 |
| Fiscal Year | 2025 | 2025 |
Income Statement Analysis: The Bottom-Line Duel
The income statement comparison highlights each company’s ability to convert sales into profit, revealing their operational efficiency and financial health.
VeriSign, Inc. Analysis
VeriSign’s revenue climbed steadily from $1.33B in 2021 to $1.66B in 2025, reflecting a 25% growth over five years. Net income also rose sharply, reaching $955M in 2025, supported by a robust net margin near 58%. Gross and EBIT margins consistently exceed 68%, signaling strong cost control and operational efficiency. The 2025 year shows solid momentum with net income up 14% year-over-year.
Corpay, Inc. Analysis
Corpay’s revenues surged from $2.83B in 2021 to $4.53B in 2025, marking a 60% increase. Despite impressive top-line growth, net margin remains modest at 24%, reflecting higher interest expenses and operating costs. Net income grew to $1.07B in 2025 but declined slightly in margin percentage terms. Corpay’s EBIT margin of 43% and significant revenue growth indicate strong scale but with margin pressure.
Margin Power vs. Revenue Scale
VeriSign excels in margin strength and profitability efficiency with a 58% net margin, while Corpay dominates in revenue scale with 2.7x VeriSign’s sales but lower margin at 24%. VeriSign’s consistent margin expansion and solid net income growth position it as the fundamental earnings leader. Investors valuing profitability and efficiency will find VeriSign’s profile more compelling than Corpay’s high-growth but lower-margin model.
Financial Ratios Comparison
These vital ratios act as a diagnostic tool to expose the underlying fiscal health, valuation premiums, and capital efficiency of the companies analyzed:
| Ratios | VeriSign, Inc. (VRSN) | Corpay, Inc. (CPAY) |
|---|---|---|
| ROE | -64.8% | 27.5% |
| ROIC | -152.0% | 8.8% |
| P/E | 23.5 | 19.7 |
| P/B | -15.2 | 5.4 |
| Current Ratio | 0.49 | 0.98 |
| Quick Ratio | 0.49 | 0.98 |
| D/E | -1.21 | 2.58 |
| Debt-to-Assets | 2.7 | 37.9% |
| Interest Coverage | 14.6 | 4.8 |
| Asset Turnover | 2.46 | 0.17 |
| Fixed Asset Turnover | 7.75 | 9.59 |
| Payout Ratio | 22.5% | 0% |
| Dividend Yield | 0.96% | 0% |
| Fiscal Year | 2025 | 2025 |
Efficiency & Valuation Duel: The Vital Signs
Financial ratios act as a company’s DNA, revealing hidden risks and operational excellence that drive investor decisions.
VeriSign, Inc.
VeriSign posts a striking 57.7% net margin but suffers from a deeply negative ROE of -64.8% and ROIC at -152%, signaling profitability challenges despite operational strength. Its P/E ratio at 23.5 appears fairly valued. Dividend yield is modest at 0.96%, reflecting some shareholder returns amid reinvestment in R&D (6.25% of revenue).
Corpay, Inc.
Corpay delivers a healthier ROE of 27.5% and an 8.8% ROIC, with a solid 23.6% net margin, underpinning efficient capital use. Its P/E ratio at 19.7 suggests reasonable valuation. Corpay pays no dividend, preferring to reinvest in growth, evident from a neutral WACC of 6.3% and focus on asset turnover efficiency.
Operational Strength vs. Capital Efficiency
VeriSign’s exceptional margins contrast with weak returns on equity and invested capital, raising caution on shareholder value creation. Corpay exhibits balanced profitability and capital returns but shows weaker asset turnover. Investors seeking operational resilience might lean towards VeriSign, while those prioritizing balanced capital returns may favor Corpay’s profile.
Which one offers the Superior Shareholder Reward?
I see VeriSign, Inc. (VRSN) pays a modest dividend yield of 0.96%, with a sustainable payout ratio near 22.5% supported by strong free cash flow coverage (4.58x). It does not rely on buybacks, focusing on steady dividends. Corpay, Inc. (CPAY) pays no dividends but aggressively reinvests in growth, funded by a robust free cash flow (18.5/share) and active share buybacks (implied by its capital deployment). CPAY’s higher leverage and lower cash flow coverage ratios add risk. I judge VRSN’s balanced, dividend-plus-growth model more sustainable. For investors prioritizing total return and risk management in 2026, VeriSign offers the superior shareholder reward.
Comparative Score Analysis: The Strategic Profile
The radar chart reveals the fundamental DNA and trade-offs of VeriSign, Inc. and Corpay, Inc., highlighting their core financial strengths and vulnerabilities:
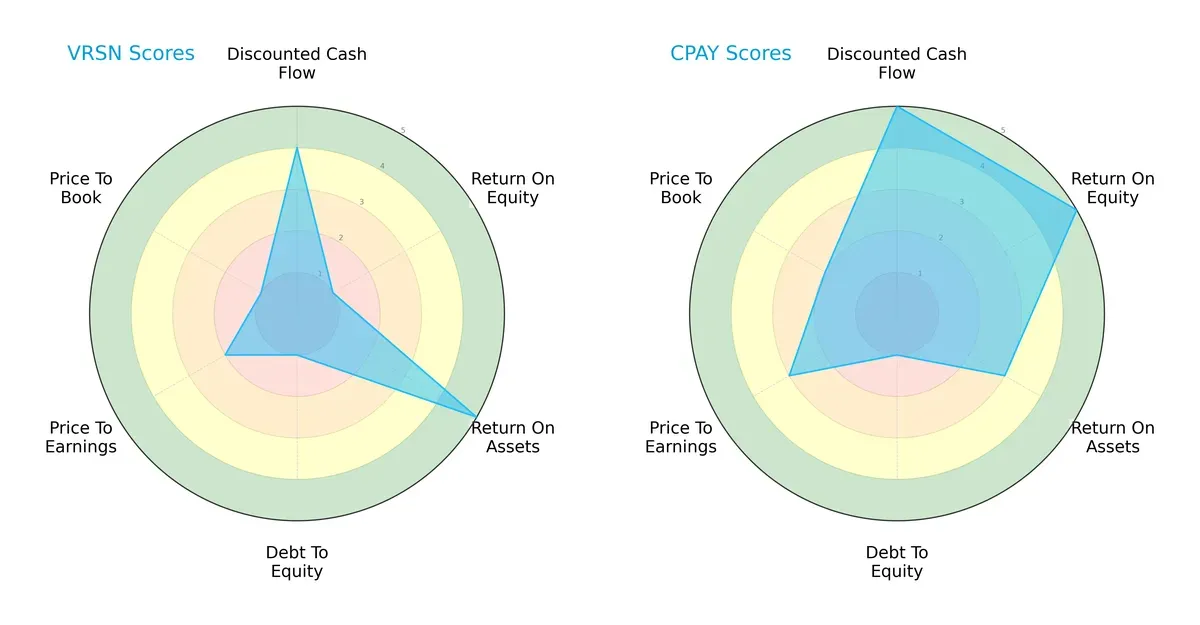
VeriSign leans heavily on asset efficiency (ROA score 5) but struggles with equity returns (ROE score 1) and balance sheet strength (Debt/Equity score 1). Corpay presents a more balanced profile, excelling in profitability (ROE score 5) and discounted cash flow (DCF score 5), though it shares VeriSign’s weakness in leverage. Corpay’s valuation metrics (PE/PB scores) also suggest a slightly more attractive pricing.
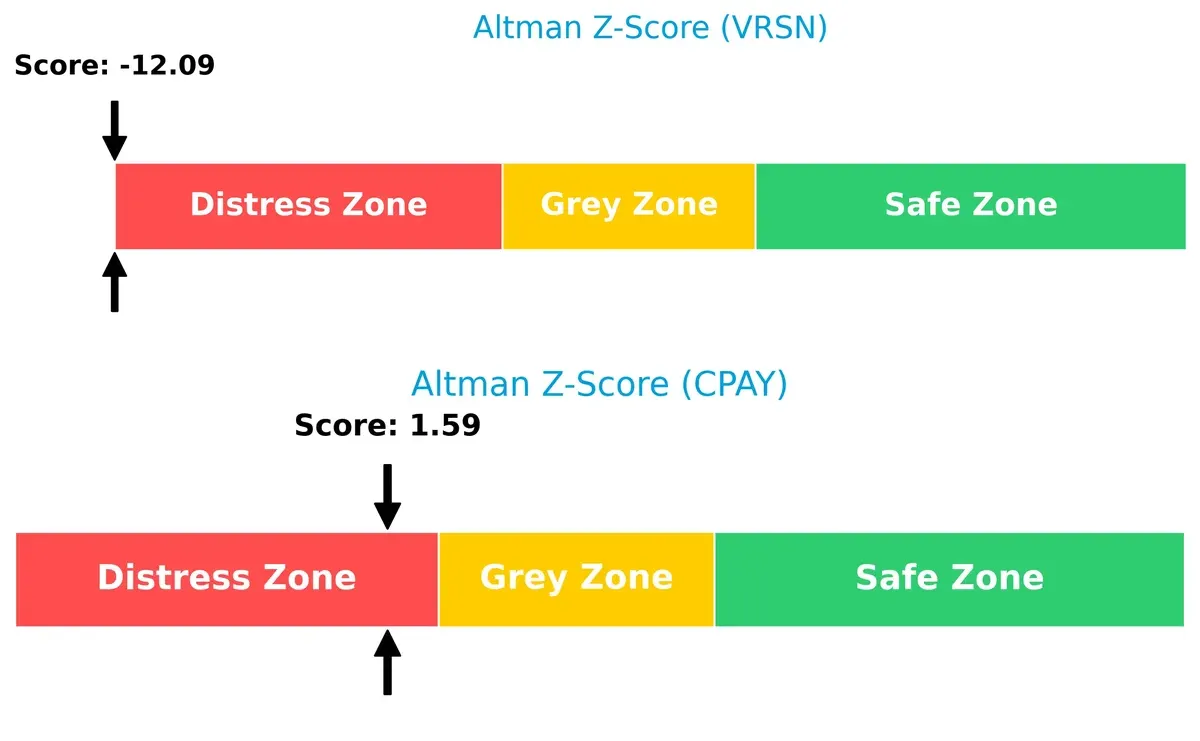
Bankruptcy Risk: Solvency Showdown
The Altman Z-Score gap shows VeriSign at -12.1 (distress zone) versus Corpay’s 1.6 (also distress zone but closer to grey), signaling severe long-term survival risks for VeriSign and moderate caution for Corpay:
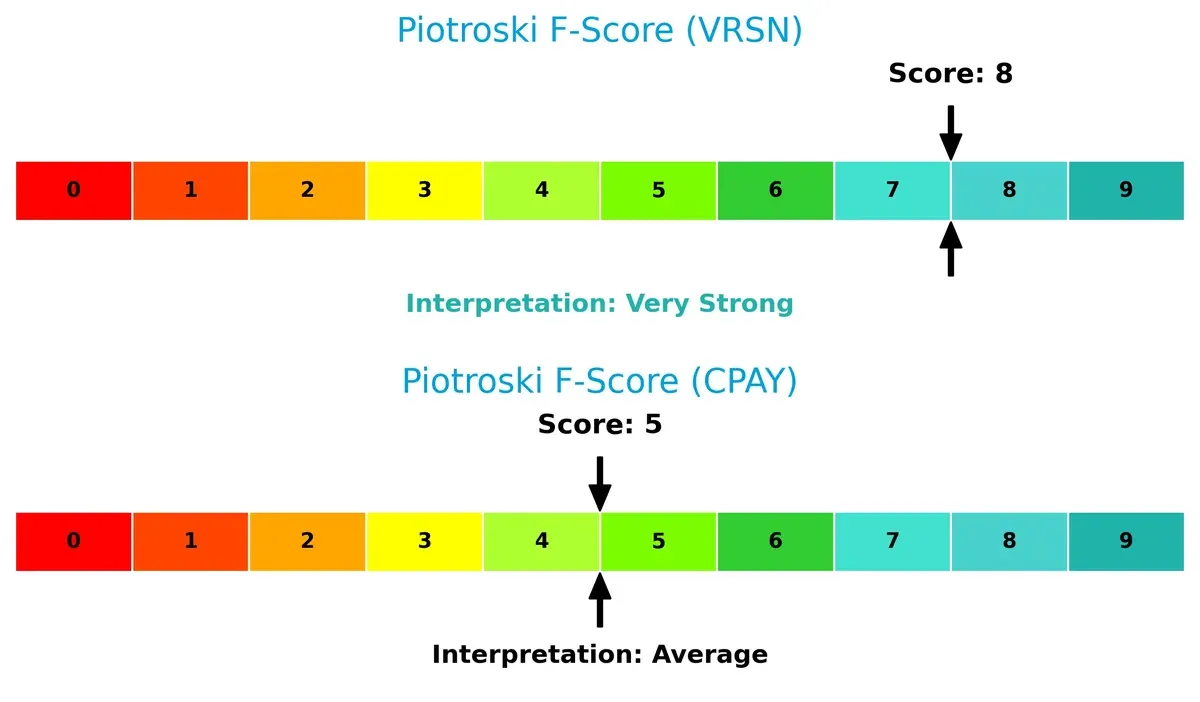
Financial Health: Quality of Operations
VeriSign scores an 8 on the Piotroski F-Score, indicating very strong financial health. Corpay’s 5 signals average operational quality, suggesting potential red flags in internal metrics compared to VeriSign’s robust fundamentals:
How are the two companies positioned?
This section dissects the operational DNA of VeriSign and Corpay by comparing their revenue distribution and internal strengths and weaknesses. The goal is to confront their economic moats and identify which model offers the most resilient, sustainable advantage in today’s market.
Strengths and Weaknesses Comparison
This table compares the Strengths and Weaknesses of VeriSign, Inc. and Corpay, Inc.:
VeriSign Strengths
- High net margin at 57.68%
- Favorable WACC of 7.02%
- Strong asset turnover ratios
- Favorable interest coverage
- Diverse global presence with significant US and EMEA revenues
Corpay Strengths
- Positive net margin at 23.62%
- Favorable ROE at 27.55%
- Favorable WACC of 6.26%
- Strong fixed asset turnover
- Diverse revenue streams in corporate payments, lodging, and payments
- Significant US revenue with important UK and Brazil markets
VeriSign Weaknesses
- Negative ROE and ROIC indicate profitability concerns
- Low current and quick ratios signal liquidity risk
- Very high debt-to-assets ratio at 265.55%
- Negative PB ratio raises valuation questions
- Low dividend yield
- Heavy reliance on US market
Corpay Weaknesses
- Current ratio below 1 signals liquidity constraints
- Unfavorable debt-to-equity ratio at 2.58
- Unfavorable asset turnover at 0.17
- Neutral interest coverage may strain debt service
- Unfavorable PB ratio
- No dividend yield
VeriSign shows operational efficiency and profitability strength but faces serious liquidity and leverage risks. Corpay maintains solid profitability and diversified revenue but struggles with liquidity and capital structure. Each company’s financial profile suggests distinct strategic challenges to address.
The Moat Duel: Analyzing Competitive Defensibility
A structural moat is the only reliable shield protecting long-term profits from relentless competition erosion. Let’s dissect the competitive defenses of two tech infrastructure leaders:
VeriSign, Inc.: Network Effects and Intangible Assets Fortress
VeriSign’s moat centers on its control of critical domain registries (.com, .net). This dominance yields robust margins—88% gross and 57% net in 2025. Yet, its ROIC has plunged sharply below WACC, signaling value destruction. Future growth hinges on extending registry services or innovating cybersecurity amidst intensifying internet infrastructure challenges.
Corpay, Inc.: Cost Advantage Through Payments Infrastructure
Corpay leverages cost advantages by streamlining corporate payments across multiple geographies, capturing 59% revenue growth over five years. Its margins are healthy though lower than VeriSign’s, with a net margin of 24%. Corpay’s ROIC exceeds WACC, indicating value creation despite a slight downtrend. Expanding cross-border payment solutions offers solid moat enhancement potential.
Moat Battle: Critical Network Effects vs. Scalable Payment Solutions
VeriSign commands a deeper moat rooted in irreplaceable internet infrastructure and intangible assets, but its declining ROIC is a red flag. Corpay’s moat is narrower but financially healthier, with positive value creation and scalable growth. I see Corpay better positioned to defend and grow market share through operational efficiency and geographic diversification.
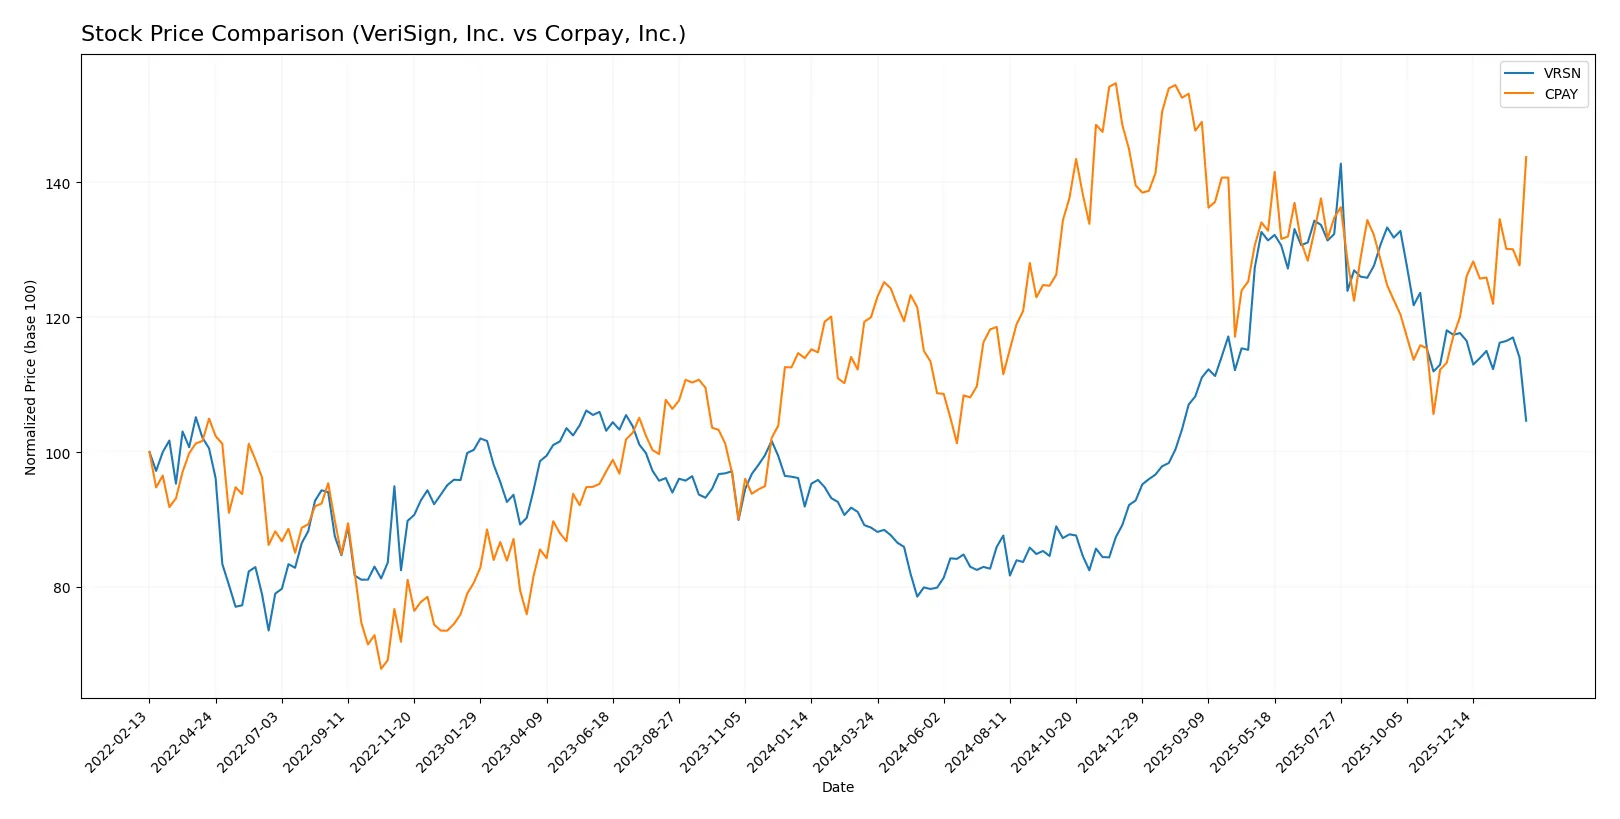
Which stock offers better returns?
Over the past year, VeriSign, Inc. and Corpay, Inc. exhibited strong upward price movements, with diverging momentum and trading volumes in recent months.
Trend Comparison
VeriSign, Inc. shows a bullish trend with a 17.83% price increase over 12 months, though momentum decelerates. The stock peaked at 305.79 and bottomed at 168.32. Recent months reveal a bearish short-term trend, down 10.84%.
Corpay, Inc. delivers a bullish trend with a 19.8% gain over the past year, accelerating steadily. It reached a high of 381.18 and a low of 249.66. Recent data shows continued strength, gaining 22.63% with buyer dominance.
Corpay’s stock outperformed VeriSign’s overall and recent trends, demonstrating stronger price appreciation and buyer momentum during the last quarter.
Target Prices
Analysts set a clear upside for VeriSign and Corpay, reflecting strong sector confidence.
| Company | Target Low | Target High | Consensus |
|---|---|---|---|
| VeriSign, Inc. | 325 | 325 | 325 |
| Corpay, Inc. | 300 | 390 | 359.33 |
VeriSign’s target price sits 45% above its current 224, signaling robust growth expectations. Corpay trades near its consensus, implying moderate upside with some volatility.
How do institutions grade them?
VeriSign, Inc. Grades
The table below summarizes recent institutional grades for VeriSign, Inc.:
| Grading Company | Action | New Grade | Date |
|---|---|---|---|
| JP Morgan | Maintain | Neutral | 2026-01-06 |
| Baird | Maintain | Outperform | 2025-07-01 |
| Baird | Maintain | Outperform | 2025-04-25 |
| Baird | Maintain | Outperform | 2025-04-01 |
| Citigroup | Maintain | Buy | 2025-02-04 |
| Citigroup | Maintain | Buy | 2025-01-03 |
| Baird | Upgrade | Outperform | 2024-12-09 |
| Baird | Maintain | Neutral | 2024-06-27 |
| Baird | Maintain | Neutral | 2024-04-26 |
| Citigroup | Maintain | Buy | 2024-04-02 |
Corpay, Inc. Grades
The table below summarizes recent institutional grades for Corpay, Inc.:
| Grading Company | Action | New Grade | Date |
|---|---|---|---|
| Mizuho | Maintain | Neutral | 2026-02-06 |
| JP Morgan | Maintain | Overweight | 2026-02-05 |
| RBC Capital | Maintain | Sector Perform | 2026-02-05 |
| Morgan Stanley | Maintain | Overweight | 2026-02-05 |
| Morgan Stanley | Upgrade | Overweight | 2026-01-26 |
| Oppenheimer | Maintain | Outperform | 2026-01-12 |
| Oppenheimer | Upgrade | Outperform | 2025-12-05 |
| UBS | Maintain | Neutral | 2025-11-06 |
| RBC Capital | Maintain | Sector Perform | 2025-11-06 |
| JP Morgan | Maintain | Overweight | 2025-11-06 |
Which company has the best grades?
Corpay, Inc. has consistently received overweight and outperform ratings from multiple firms recently. VeriSign, Inc. shows mostly outperform and buy ratings but includes some neutral grades. Corpay’s stronger recent upgrades could signal more positive institutional sentiment. Investors should weigh these trends carefully.

Don’t Let Luck Decide Your Entry Point
Optimize your entry points with our advanced ProRealTime indicators. You’ll get efficient buy signals with precise price targets for maximum performance. Start outperforming now!
Risks specific to each company
The following categories identify the critical pressure points and systemic threats facing both firms in the 2026 market environment:
1. Market & Competition
VeriSign, Inc.
- Dominates the domain registry niche but faces limited growth from market saturation.
Corpay, Inc.
- Operates in diverse payments markets with intense competition and dependency on cross-border volumes.
2. Capital Structure & Debt
VeriSign, Inc.
- Exhibits high debt-to-assets ratio (266%), signaling risky leverage despite strong interest coverage.
Corpay, Inc.
- Moderate debt-to-assets (38%) but higher debt-to-equity ratio (2.58) indicates financial risk and leverage concerns.
3. Stock Volatility
VeriSign, Inc.
- Low beta (0.75) suggests defensive stock behavior with moderate price swings.
Corpay, Inc.
- Slightly higher beta (0.81) points to increased sensitivity to market fluctuations.
4. Regulatory & Legal
VeriSign, Inc.
- Faces regulatory scrutiny on internet infrastructure and domain control, with potential antitrust risks.
Corpay, Inc.
- Subject to complex payment regulations internationally, increasing compliance costs and legal risk.
5. Supply Chain & Operations
VeriSign, Inc.
- Relies on stable internet infrastructure, low operational disruption risk but sensitive to tech failures.
Corpay, Inc.
- Complex payment processing depends on third-party networks, exposing it to operational and technological disruptions.
6. ESG & Climate Transition
VeriSign, Inc.
- Limited direct ESG impact but growing pressure on data security and privacy governance.
Corpay, Inc.
- Faces ESG risks in global operations, especially regarding sustainable practices in fleet and travel services.
7. Geopolitical Exposure
VeriSign, Inc.
- Primarily US-focused but global domain registry role exposes it to geopolitical internet governance shifts.
Corpay, Inc.
- Significant international footprint, especially in Brazil and UK, making it vulnerable to geopolitical and currency risks.
Which company shows a better risk-adjusted profile?
VeriSign’s most impactful risk is its precarious capital structure with extremely high debt-to-assets, raising financial distress concerns despite operational strength. Corpay’s critical risk lies in its regulatory complexity and leverage, which may pressure earnings. Corpay’s broader market and better Altman Z-Score (though still in distress zone) suggest a comparatively better risk-adjusted profile. VeriSign’s negative ROIC and Altman Z-Score highlight urgent balance sheet vulnerabilities, justifying my caution.
Final Verdict: Which stock to choose?
VeriSign’s superpower lies in its exceptional operational efficiency and robust cash generation, reflecting a company that commands premium pricing in its niche. Its key point of vigilance is the deteriorating return on invested capital, signaling potential value erosion. It fits a portfolio seeking aggressive growth with a tolerance for operational risks.
Corpay stands out for its strategic moat anchored in consistent value creation and a solid return on equity, despite a modest decline in profitability. Its safety profile appears stronger than VeriSign’s, supported by healthier liquidity ratios. Corpay suits investors looking for growth at a reasonable price with a balanced risk approach.
If you prioritize operational excellence and are comfortable with a higher risk profile, VeriSign emerges as the compelling choice due to its cash machine dynamics. However, if you seek better stability and value creation, Corpay offers a superior risk-adjusted profile despite slower momentum. Both present distinct scenarios for differentiated investor avatars.
Disclaimer: Investment carries a risk of loss of initial capital. The past performance is not a reliable indicator of future results. Be sure to understand risks before making an investment decision.
Go Further
I encourage you to read the complete analyses of VeriSign, Inc. and Corpay, Inc. to enhance your investment decisions: