Home > Comparison > Technology > CPAY vs PATH
The strategic rivalry between Corpay, Inc. and UiPath Inc. shapes the evolution of the software infrastructure sector. Corpay operates as a capital-intensive payments company specializing in vehicle and corporate expense management, while UiPath leads with high-margin robotic process automation software. This head-to-head pits a diversified service model against a pure-play automation innovator. This analysis aims to identify which trajectory offers superior risk-adjusted returns for a diversified portfolio in 2026.
Table of contents
Companies Overview
Corpay, Inc. and UiPath Inc. stand as pivotal players shaping the infrastructure software landscape.
Corpay, Inc.: Global Payment Solutions Leader
Corpay operates primarily as a payments company focusing on vehicle and corporate payment solutions. It generates revenue through fuel, tolls, parking, and lodging expense management, serving businesses across multiple countries. In 2026, Corpay emphasizes expanding its cross-border payment capabilities and accounts payable automation to deepen its market penetration and improve transaction efficiency.
UiPath Inc.: Robotic Process Automation Pioneer
UiPath delivers an end-to-end automation platform blending AI and robotic process automation to streamline enterprise workflows. Its core revenue comes from licensing software that enables organizations to automate complex processes with minimal coding. The company’s 2026 strategy centers on enhancing its low-code development environment and scaling professional services to accelerate adoption across banking, healthcare, and government sectors.
Strategic Collision: Similarities & Divergences
Both firms operate in the software infrastructure industry but diverge sharply in approach: Corpay leans on a payments ecosystem rooted in physical and virtual transactions, while UiPath champions a software-centric, AI-driven automation platform. Their competitive overlap lies in digitizing enterprise operations, yet Corpay targets payment efficiency, and UiPath targets process automation. This contrast defines their distinct investment profiles—Corpay offers stability through transaction volume, while UiPath presents growth potential via innovation adoption.
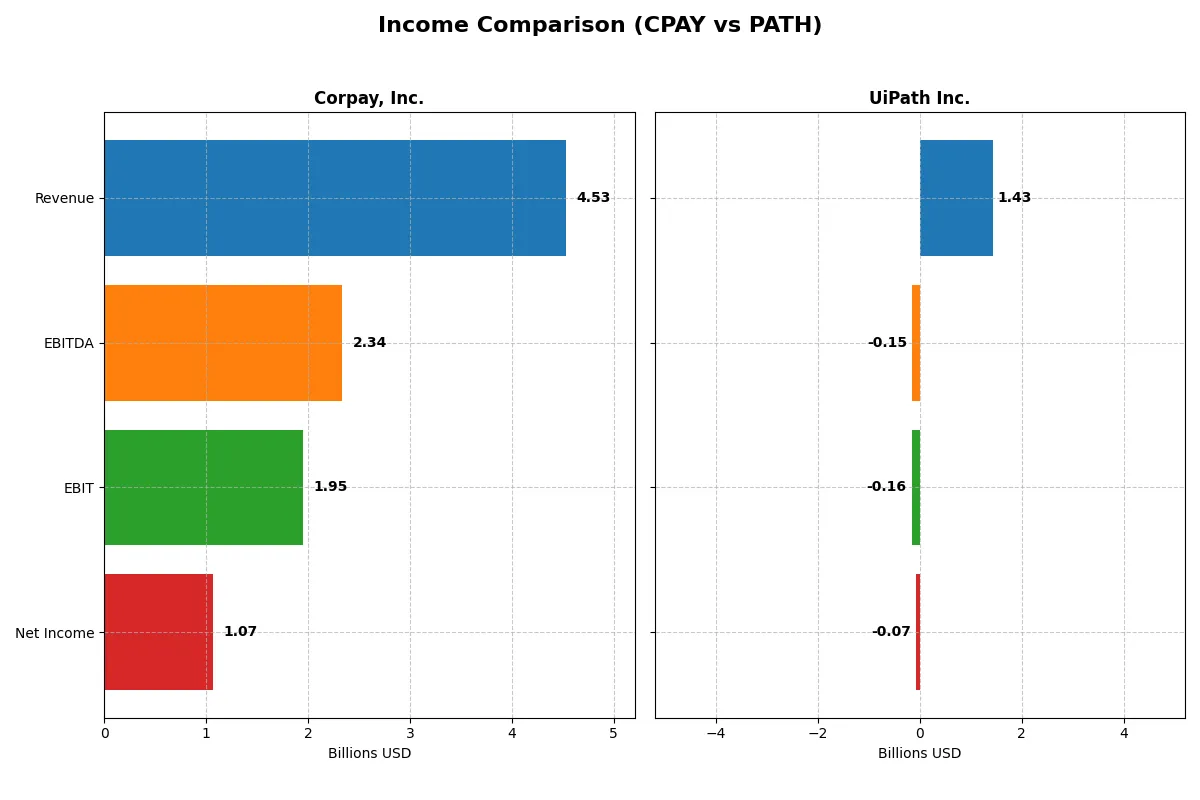
Income Statement Comparison
The following data dissects the core profitability and scalability of both corporate engines to reveal who dominates the bottom line:
| Metric | Corpay, Inc. (CPAY) | UiPath Inc. (PATH) |
|---|---|---|
| Revenue | 4.53B | 1.43B |
| Cost of Revenue | 1.36B | 247M |
| Operating Expenses | 1.21B | 1.35B |
| Gross Profit | 3.17B | 1.18B |
| EBITDA | 2.34B | -145M |
| EBIT | 1.95B | -163M |
| Interest Expense | 404M | 0 |
| Net Income | 1.07B | -74M |
| EPS | 15.25 | -0.13 |
| Fiscal Year | 2025 | 2025 |
Income Statement Analysis: The Bottom-Line Duel
The income statement comparison reveals each company’s true efficiency and growth momentum in converting revenue into profit.
Corpay, Inc. Analysis
Corpay’s revenue climbed steadily from 2.8B in 2021 to 4.5B in 2025, with net income rising from 840M to 1.07B. Gross margins remain robust near 70%, and net margins hold favorably at 23.6%. In 2025, Corpay’s strong EBIT margin of 43.1% highlights efficient cost control and solid operating leverage.
UiPath Inc. Analysis
UiPath’s revenue surged from 608M in 2021 to 1.43B in 2025, more than doubling over five years. Gross margin impresses at 82.7%, but it posts a negative EBIT margin of -11.4% and net loss of 74M in 2025, though margins show recent improvement. The company focuses on top-line growth with narrowing losses and improving net margin momentum.
Growth Scale vs. Profitability Strength
Corpay delivers consistent profitability with strong margins and positive net income growth of 27% over five years. UiPath leads in revenue expansion, growing 135% overall, yet struggles to reach profitability. For investors prioritizing steady returns and margin discipline, Corpay’s profile stands out as more attractive.
Financial Ratios Comparison
These vital ratios act as a diagnostic tool to expose the underlying fiscal health, valuation premiums, and capital efficiency of the companies compared below:
| Ratios | Corpay, Inc. (CPAY) | UiPath Inc. (PATH) |
|---|---|---|
| ROE | 27.5% | -4.0% |
| ROIC | 8.8% | -7.4% |
| P/E | 19.7 | -108.0 |
| P/B | 5.4 | 4.3 |
| Current Ratio | 1.0 | 2.9 |
| Quick Ratio | 1.0 | 2.9 |
| D/E | 2.58 | 0.04 |
| Debt-to-Assets | 37.9% | 2.7% |
| Interest Coverage | 4.8x | 0x |
| Asset Turnover | 0.17 | 0.50 |
| Fixed Asset Turnover | 9.6 | 14.4 |
| Payout Ratio | 0% | 0% |
| Dividend Yield | 0% | 0% |
| Fiscal Year | 2025 | 2025 |
Efficiency & Valuation Duel: The Vital Signs
Ratios act as a company’s DNA, uncovering hidden risks and operational excellence beneath surface-level financials.
Corpay, Inc.
Corpay posts a robust ROE of 27.55% and a healthy net margin of 23.62%, reflecting strong profitability. Its P/E ratio at 19.73 is fairly valued, but a high P/B of 5.43 signals a stretched balance sheet. The company pays no dividends, instead likely reinvesting earnings to support growth or maintain its moat.
UiPath Inc.
UiPath struggles with negative profitability metrics: a -3.99% ROE and -5.15% net margin. Its P/E is negative, which technically favors valuation but reflects losses. The firm maintains a strong liquidity position with a current ratio of 2.93 and low debt. No dividends exist; heavy R&D and stock-based comp drive reinvestment for future growth.
Profitability Strength vs. Liquid Stability
Corpay offers superior profitability and reasonable valuation, though its leverage and liquidity raise caution. UiPath shows solid liquidity and low debt but suffers from persistent losses, undermining valuation quality. Investors seeking operational earnings might prefer Corpay; those prioritizing balance sheet safety could lean toward UiPath’s profile.
Which one offers the Superior Shareholder Reward?
I observe that Corpay, Inc. (CPAY) and UiPath Inc. (PATH) follow distinct distribution strategies. Neither pays dividends, focusing instead on reinvestment and buybacks. CPAY boasts strong free cash flow (18.5/share in 2025) and a robust buyback capacity supported by a solid operating margin (~43%). PATH, however, operates at a loss, with negative net margins and limited buyback ability, relying on growth investments. CPAY’s sustainable cash generation and leverage (debt/equity ~2.6) support disciplined capital returns. PATH’s strategy bets on long-term expansion but carries higher risk given persistent losses. I conclude CPAY offers a superior total return profile in 2026, balancing cash flow strength with prudent capital allocation.
Comparative Score Analysis: The Strategic Profile
The radar chart reveals the fundamental DNA and trade-offs of Corpay, Inc. and UiPath Inc., highlighting each firm’s financial strengths and weaknesses:
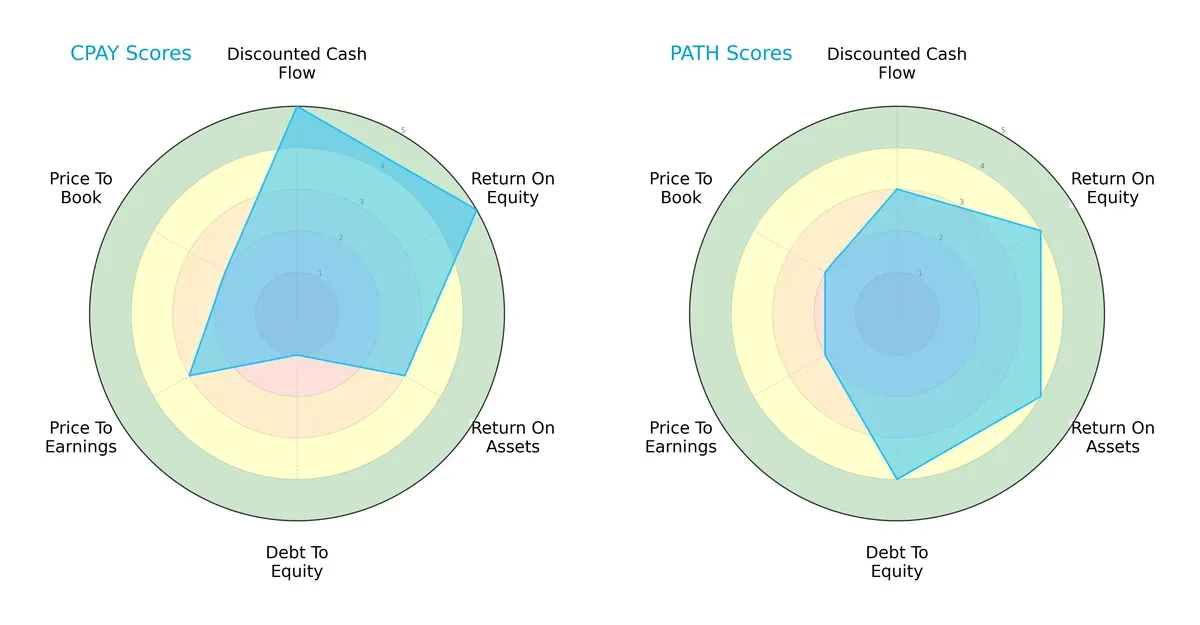
Corpay excels in discounted cash flow and return on equity, signaling strong profitability and valuation appeal. However, its debt-to-equity score is very unfavorable, indicating high leverage risk. UiPath shows a more balanced profile with solid debt management and better asset returns but weaker valuation scores. I see Corpay relying on operational efficiency, while UiPath emphasizes financial stability.
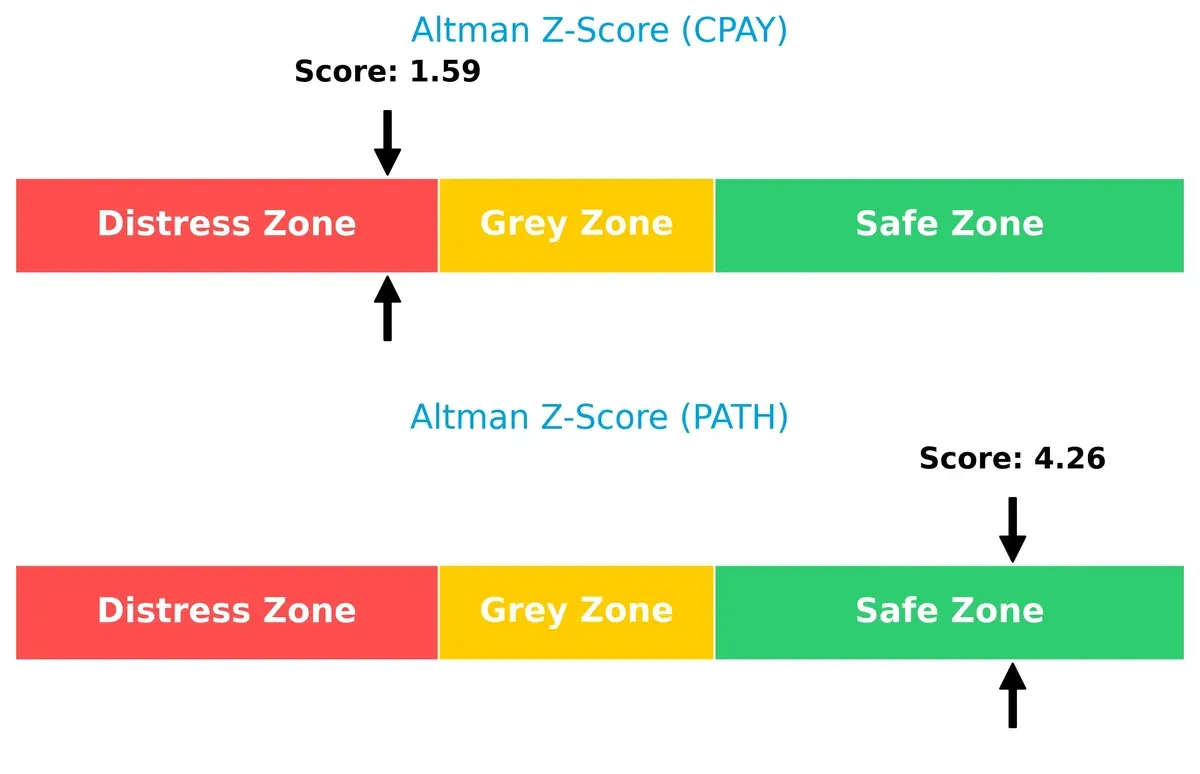
Bankruptcy Risk: Solvency Showdown
UiPath’s Altman Z-Score of 4.26 places it safely above distress, signaling robust long-term survival potential. Corpay’s 1.59 score warns of financial distress and bankruptcy risk in this cycle:
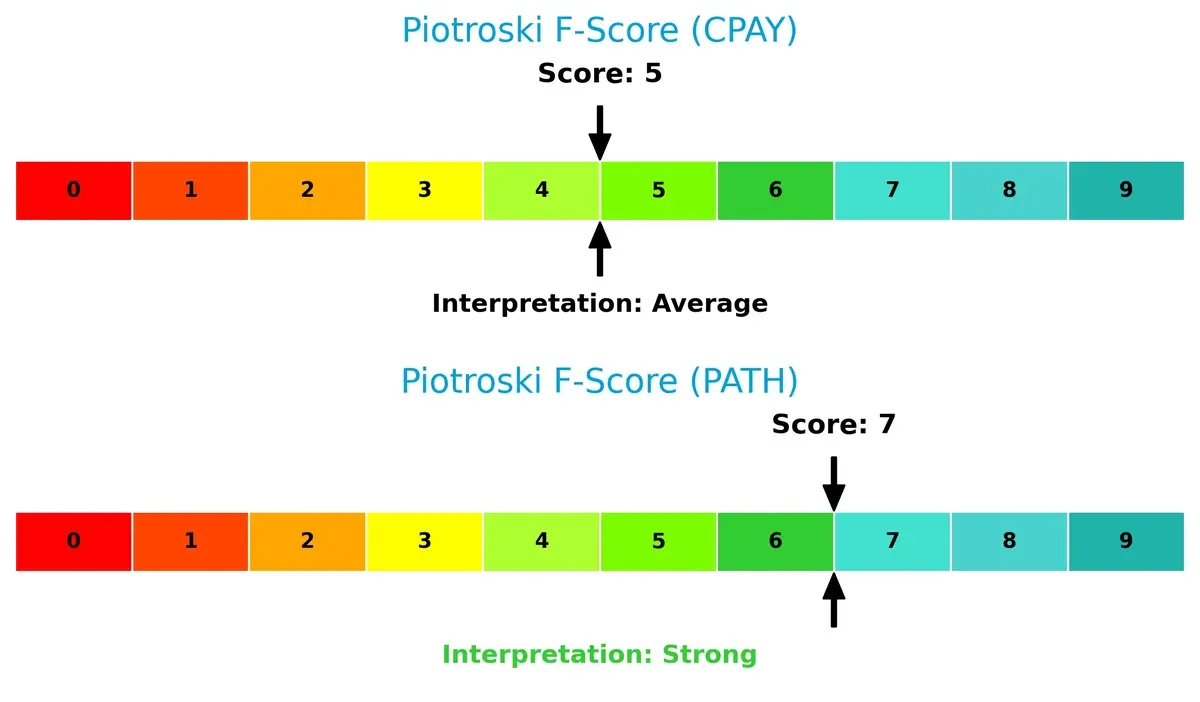
Financial Health: Quality of Operations
UiPath’s Piotroski score of 7 indicates strong financial health and operational quality. Corpay’s score of 5 is average, suggesting some internal red flags and weaker fundamentals relative to UiPath:
How are the two companies positioned?
This section dissects Corpay and UiPath’s operational DNA by comparing their revenue distribution and internal strengths and weaknesses. The goal is to confront their economic moats and reveal which business model holds the more durable competitive advantage today.
Revenue Segmentation: The Strategic Mix
This visual comparison dissects how Corpay, Inc. and UiPath Inc. diversify their income streams and where their primary sector bets lie:
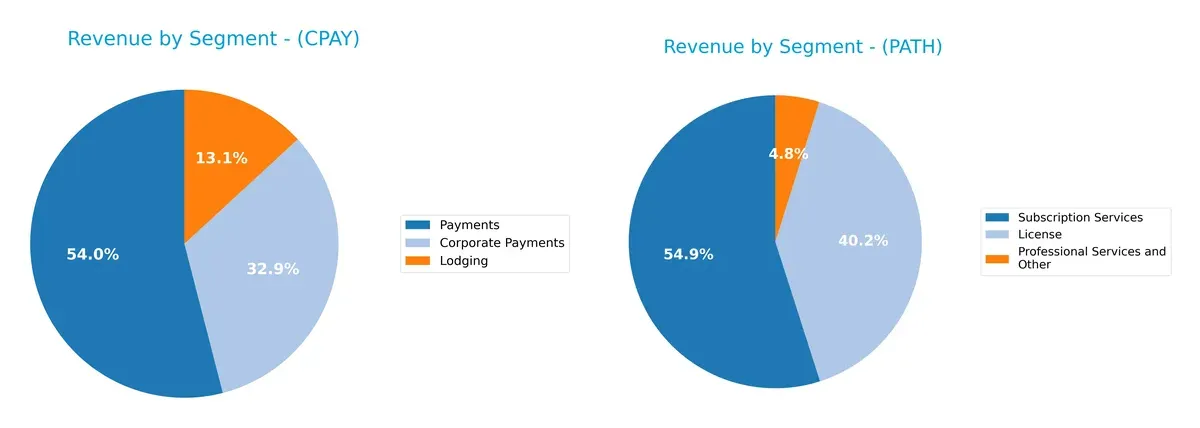
Corpay leans heavily on Payments at $2B, anchoring its revenue with a dominant segment, while Corporate Payments ($1.22B) and Lodging ($489M) add moderate diversity. UiPath displays a more balanced mix between License ($587M) and Subscription Services ($802M), with a smaller Professional Services slice ($71M). Corpay’s concentration suggests infrastructure dominance but raises concentration risk. UiPath’s spread pivots on SaaS growth, reducing dependency on any one segment.
Strengths and Weaknesses Comparison
This table compares the strengths and weaknesses of Corpay and UiPath based on diversification, profitability, financials, innovation, global presence, and market share:
Corpay Strengths
- Strong profitability with 23.6% net margin
- Favorable ROE at 27.6%
- Diverse revenue streams across payments and lodging
- Solid global presence including US, UK, Brazil
- High fixed asset turnover at 9.6
UiPath Strengths
- Robust liquidity ratios with current and quick ratios at 2.93
- Low leverage with D/E at 0.04 and 2.7% debt/assets
- Growing subscription revenue stream
- High fixed asset turnover at 14.4
- Diversified geographic revenue across Americas, Asia Pacific, EMEA
Corpay Weaknesses
- Current ratio below 1 signals liquidity risk
- High debt at 2.58 D/E ratio
- Unfavorable price-to-book at 5.43
- Low asset turnover at 0.17
- No dividend yield
UiPath Weaknesses
- Negative profitability with -5.15% net margin
- Negative ROE and ROIC
- Zero interest coverage raises solvency concerns
- Unfavorable price-to-book at 4.31
- No dividend yield
Corpay shows strong profitability and geographic diversity but faces liquidity and leverage challenges. UiPath benefits from solid liquidity and low debt but struggles with negative profitability and solvency. These contrasts highlight differing strategic priorities and financial health dynamics.
The Moat Duel: Analyzing Competitive Defensibility
A structural moat protects long-term profits from relentless competitive pressure. Without it, gains erode fast. Let’s examine the moats of two software infrastructure firms:
Corpay, Inc.: Stable Value Creation Through Cost Advantage
Corpay’s moat centers on a cost advantage via specialized payment solutions across multiple regions. This yields a solid 2.5% ROIC premium over WACC, reflecting efficient capital use. However, a declining ROIC trend signals emerging margin pressures in 2026.
UiPath Inc.: Innovation-Driven Growth Amid Profitability Challenges
UiPath relies on intangible assets and network effects in robotic process automation. Its ROIC lags WACC by 16%, indicating current value destruction, but a sharp ROIC increase signals improving profitability and expanding platform adoption.
Corpay’s Cost Efficiency vs. UiPath’s Innovation Trajectory
Corpay maintains a wider moat through consistent value creation, while UiPath’s moat is narrower but deepening as profitability recovers. Corpay is better positioned today to defend market share, yet UiPath’s future growth could disrupt this balance.
Which stock offers better returns?
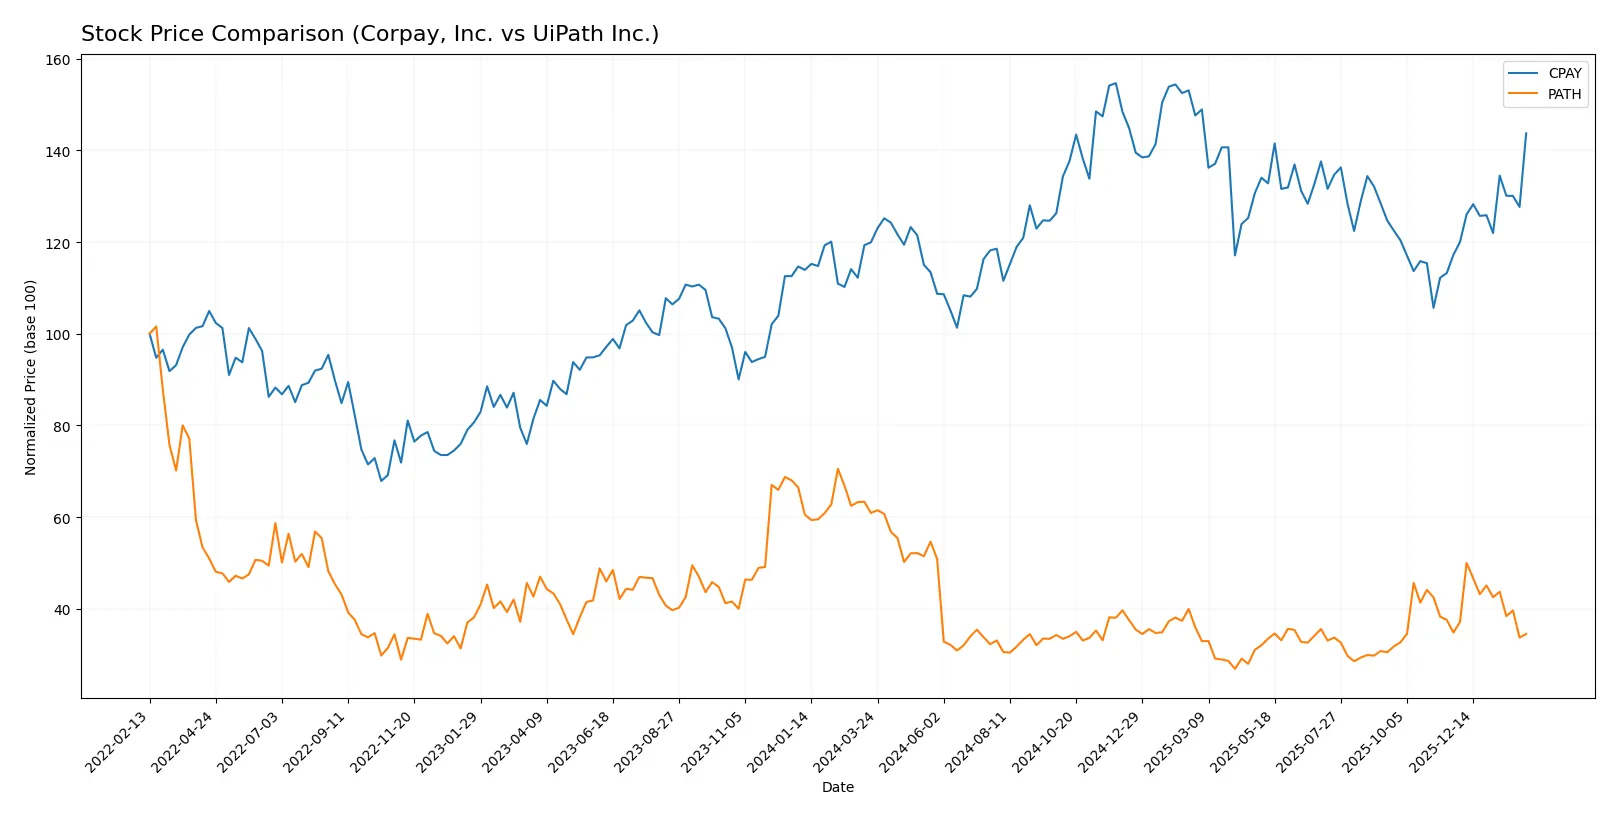
The past year saw Corpay, Inc. rally nearly 20%, accelerating gains amid rising volumes. UiPath Inc. dropped sharply by over 43%, with a decelerating downtrend and muted recent volatility.
Trend Comparison
Corpay, Inc. shows a bullish trend with a 19.8% price increase over 12 months, accelerating upward and hitting a high of 381.18. Volatility is significant, with a standard deviation of 31.25.
UiPath Inc. exhibits a bearish trend, declining 43.34% in one year. The downtrend decelerates, volatility is low at 2.89, and the stock ranges between 10.04 and 22.97.
Comparing trends, Corpay leads with strong positive momentum and higher returns. UiPath lags with a steep decline and weaker recovery signs.
Target Prices
Analysts present a cautiously optimistic consensus for Corpay, Inc. and UiPath Inc.
| Company | Target Low | Target High | Consensus |
|---|---|---|---|
| Corpay, Inc. | 300 | 390 | 359.33 |
| UiPath Inc. | 14 | 19 | 16.6 |
Corpay’s consensus target sits slightly above its current price of 354.19, suggesting moderate upside potential. UiPath’s target consensus of 16.6 is notably higher than its current 12.89, indicating stronger analyst confidence in growth.

Don’t Let Luck Decide Your Entry Point
Optimize your entry points with our advanced ProRealTime indicators. You’ll get efficient buy signals with precise price targets for maximum performance. Start outperforming now!
How do institutions grade them?
The following tables summarize the recent grades assigned by major financial institutions to Corpay, Inc. and UiPath Inc.:
Corpay, Inc. Grades
The table below shows the latest analyst grades and actions for Corpay, Inc.:
| Grading Company | Action | New Grade | Date |
|---|---|---|---|
| Mizuho | maintain | Neutral | 2026-02-06 |
| JP Morgan | maintain | Overweight | 2026-02-05 |
| RBC Capital | maintain | Sector Perform | 2026-02-05 |
| Morgan Stanley | maintain | Overweight | 2026-02-05 |
| Morgan Stanley | upgrade | Overweight | 2026-01-26 |
| Oppenheimer | maintain | Outperform | 2026-01-12 |
| Oppenheimer | upgrade | Outperform | 2025-12-05 |
| UBS | maintain | Neutral | 2025-11-06 |
| RBC Capital | maintain | Sector Perform | 2025-11-06 |
| JP Morgan | maintain | Overweight | 2025-11-06 |
UiPath Inc. Grades
The table below shows the latest analyst grades and actions for UiPath Inc.:
| Grading Company | Action | New Grade | Date |
|---|---|---|---|
| Barclays | maintain | Equal Weight | 2026-01-12 |
| RBC Capital | maintain | Sector Perform | 2026-01-05 |
| RBC Capital | maintain | Sector Perform | 2025-12-10 |
| Morgan Stanley | maintain | Equal Weight | 2025-12-09 |
| DA Davidson | maintain | Neutral | 2025-12-05 |
| BMO Capital | maintain | Market Perform | 2025-12-04 |
| Mizuho | maintain | Neutral | 2025-12-04 |
| RBC Capital | maintain | Sector Perform | 2025-12-04 |
| Needham | maintain | Hold | 2025-12-04 |
| Barclays | maintain | Equal Weight | 2025-12-04 |
Which company has the best grades?
Corpay, Inc. consistently receives higher ratings such as Overweight and Outperform, unlike UiPath Inc.’s more conservative Sector Perform and Equal Weight grades. This suggests stronger institutional confidence in Corpay’s near-term prospects.
Risks specific to each company
The following categories identify the critical pressure points and systemic threats facing both firms in the 2026 market environment:
1. Market & Competition
Corpay, Inc.
- Operates in competitive payments space with global presence; commoditization risk is moderate.
UiPath Inc.
- Faces intense RPA software competition; innovation pace and market adoption create high market pressure.
2. Capital Structure & Debt
Corpay, Inc.
- High debt-to-equity ratio (2.58) signals financial leverage risk; interest coverage is moderate.
UiPath Inc.
- Very low debt (0.04 D/E) and low debt-to-assets (2.72%) indicate conservative leverage and strong balance sheet.
3. Stock Volatility
Corpay, Inc.
- Beta of 0.808 shows lower volatility than market average; stock price range is relatively stable.
UiPath Inc.
- Beta of 1.072 suggests above-market volatility; wide trading volume and price range reflect investor uncertainty.
4. Regulatory & Legal
Corpay, Inc.
- Payment processing faces regulatory scrutiny across multiple jurisdictions; compliance costs can rise.
UiPath Inc.
- Automation software may encounter data privacy and AI regulatory risks, especially in US and EU markets.
5. Supply Chain & Operations
Corpay, Inc.
- Relies on global payment networks and infrastructure; operational risks from disruptions exist but manageable.
UiPath Inc.
- Software delivery depends on cloud infrastructure and skilled workforce; operational scalability is a key challenge.
6. ESG & Climate Transition
Corpay, Inc.
- ESG risks include sustainability of operations and data security; climate transition impacts are moderate.
UiPath Inc.
- Faces pressure on ethical AI use and energy consumption of data centers; ESG profile improving but vigilance needed.
7. Geopolitical Exposure
Corpay, Inc.
- Exposure to US, Brazil, UK markets; currency and political risks persist but diversified footprint mitigates impact.
UiPath Inc.
- Operations in US, Romania, Japan create geopolitical complexity; supply chain and data regulations add uncertainty.
Which company shows a better risk-adjusted profile?
UiPath’s strongest advantage is its low leverage and strong liquidity, cushioning it against financial distress despite negative profitability. Corpay carries higher financial risk with its elevated debt and weak liquidity ratios. However, Corpay’s stable market position and lower stock volatility reduce some external risks. UiPath’s risk-adjusted profile is superior, supported by its safe-zone Altman Z-Score (4.26) and strong Piotroski score (7). Corpay lingers in distress zone (Altman Z 1.59) with average operational strength.
UiPath’s biggest risk lies in market competition and innovation pace, while Corpay’s financial structure poses the most immediate threat. The recent data shows Corpay’s debt-to-equity at 2.58, a red flag for financial health, contrasted with UiPath’s robust liquidity (current ratio 2.93). This stark difference justifies my concern over Corpay’s solvency risks in a tightening credit environment.
Final Verdict: Which stock to choose?
Corpay, Inc. (CPAY) shines as a cash-generating engine with solid profitability and a value-creating moat. Its main point of vigilance is a stretched balance sheet and low liquidity, which could pressure its financial flexibility. CPAY fits well in portfolios seeking aggressive growth with some risk tolerance.
UiPath Inc. (PATH) leverages a strategic moat rooted in innovation and recurring revenue, supported by strong liquidity and low leverage. It offers better financial safety compared to CPAY but faces challenges in profitability and value creation. PATH suits investors focused on growth at a reasonable price with a preference for stability.
If you prioritize aggressive growth and value creation, CPAY is the compelling choice due to its cash machine profile and profitability edge. However, if you seek a more stable growth play with a solid balance sheet, PATH offers better stability and a promising innovation moat despite current profitability headwinds.
Disclaimer: Investment carries a risk of loss of initial capital. The past performance is not a reliable indicator of future results. Be sure to understand risks before making an investment decision.
Go Further
I encourage you to read the complete analyses of Corpay, Inc. and UiPath Inc. to enhance your investment decisions: