Home > Comparison > Technology > CPAY vs TDC
The strategic rivalry between Corpay, Inc. and Teradata Corporation shapes the evolving landscape of the technology sector. Corpay operates as a capital-intensive payments infrastructure firm with a global footprint, while Teradata specializes in high-margin multi-cloud data analytics solutions. This head-to-head pits scale and transactional expertise against advanced data platform innovation. This analysis will reveal which corporate model offers superior risk-adjusted returns for a diversified investor in 2026.

Table of contents
Companies Overview
Corpay, Inc. and Teradata Corporation stand as pivotal players in the software infrastructure market, each shaping digital transformation in distinct ways.
Corpay, Inc.: Payments Infrastructure Powerhouse
Corpay, Inc. operates as a payments company specializing in managing vehicle, lodging, and corporate payments across multiple countries. Its revenue engine centers on vehicle payment solutions and corporate payment products including virtual cards and cross-border services. In 2026, the company sharpens its strategic focus on expanding its global footprint and innovating payment automation.
Teradata Corporation: Multi-Cloud Data Platform Leader
Teradata Corporation delivers a connected multi-cloud data platform enabling enterprise analytics and data ecosystem integration. Its core revenue derives from Teradata Vantage and consulting services aimed at cloud migration and analytic infrastructure optimization. For 2026, Teradata prioritizes enhancing ecosystem simplification and supporting multi-cloud adoption for diverse industry clients.
Strategic Collision: Similarities & Divergences
Both companies excel in software infrastructure but diverge in focus—Corpay emphasizes payment automation and global transaction management, while Teradata leads in enterprise data analytics and cloud platforms. Their primary battleground lies in serving large enterprises seeking digital transformation tools. Corpay’s broad payment ecosystem contrasts with Teradata’s data-centric, consultative model, defining distinct investment profiles anchored in transaction volume versus analytic innovation.
Income Statement Comparison
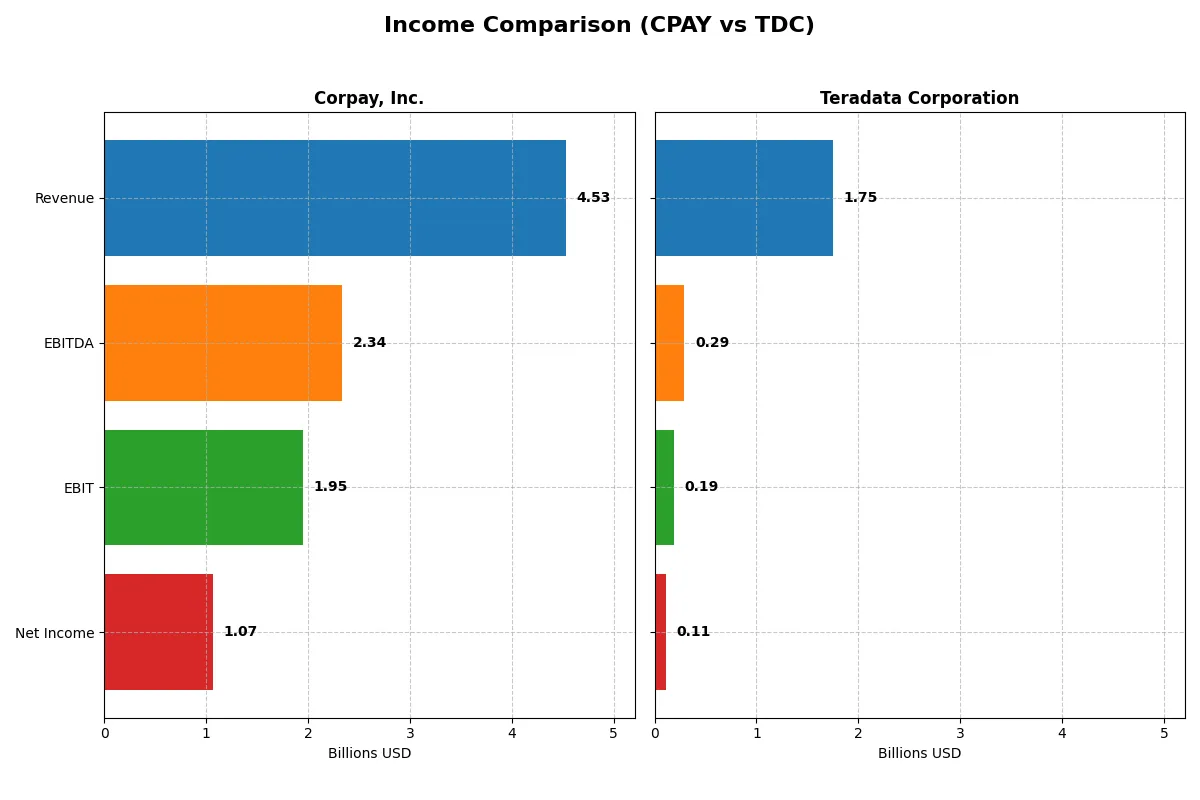
This data dissects the core profitability and scalability of both corporate engines to reveal who dominates the bottom line:
| Metric | Corpay, Inc. (CPAY) | Teradata Corporation (TDC) |
|---|---|---|
| Revenue | 4.53B | 1.75B |
| Cost of Revenue | 1.36B | 692M |
| Operating Expenses | 1.21B | 849M |
| Gross Profit | 3.17B | 1.06B |
| EBITDA | 2.34B | 293M |
| EBIT | 1.95B | 193M |
| Interest Expense | 404M | 29M |
| Net Income | 1.07B | 114M |
| EPS | 15.25 | 1.18 |
| Fiscal Year | 2025 | 2024 |
Income Statement Analysis: The Bottom-Line Duel
This income statement comparison reveals which company converts revenue into profit more efficiently and sustainably.
Corpay, Inc. Analysis
Corpay’s revenue surged from 2.8B in 2021 to 4.5B in 2025, reflecting a robust 60% growth over five years. Net income rose 27% to 1.07B in 2025, sustaining a strong net margin near 24%. Its gross margin remains high at 70%, and EBIT margin impresses at 43%, signaling excellent cost controls and operational efficiency. Momentum remains positive with healthy revenue and EBIT growth in the latest year.
Teradata Corporation Analysis
Teradata’s revenue declined slightly from 1.9B in 2021 to 1.75B in 2024, losing about 5% over four years. Net income halved, dropping to 114M in 2024, but net margin improved to 6.5%. Gross margin holds at 60%, with EBIT margin modest at 11%. Despite top-line softness, Teradata’s 2024 EBIT and net margin growth reflect operational gains, yet profitability remains far below Corpay’s scale and efficiency.
Margin Power vs. Revenue Scale
Corpay dominates with superior revenue growth, wider margins, and stronger absolute profits, reflecting a well-oiled profit engine. Teradata shows some margin recovery but struggles with stagnant revenue and lower profitability. For investors, Corpay’s profile offers compelling scale and margin leverage, while Teradata’s turnaround remains tentative and less attractive fundamentally.
Financial Ratios Comparison
These vital ratios act as a diagnostic tool to expose the underlying fiscal health, valuation premiums, and capital efficiency of the companies compared below:
| Ratios | Corpay, Inc. (CPAY) | Teradata Corporation (TDC) |
|---|---|---|
| ROE | 27.5% | 85.7% |
| ROIC | 8.8% | 16.9% |
| P/E | 19.7 | 26.3 |
| P/B | 5.43 | 22.58 |
| Current Ratio | 0.98 | 0.81 |
| Quick Ratio | 0.98 | 0.79 |
| D/E (Debt-to-Equity) | 2.58 | 4.33 |
| Debt-to-Assets | 37.9% | 33.8% |
| Interest Coverage | 4.83 | 7.21 |
| Asset Turnover | 0.17 | 1.03 |
| Fixed Asset Turnover | 9.59 | 9.07 |
| Payout ratio | 0 | 0 |
| Dividend yield | 0 | 0 |
| Fiscal Year | 2025 | 2024 |
Efficiency & Valuation Duel: The Vital Signs
Financial ratios act as a company’s DNA, uncovering hidden risks and highlighting operational strengths essential for investment decisions.
Corpay, Inc.
Corpay delivers a strong 27.55% return on equity and a healthy 23.62% net margin, signaling solid profitability. Its P/E of 19.73 appears fairly valued, though a high P/B of 5.43 suggests stretched equity prices. Corpay pays no dividends, focusing instead on reinvestment rather than shareholder returns.
Teradata Corporation
Teradata boasts an impressive 85.71% ROE and a favorable 16.89% ROIC, showcasing operational efficiency. However, its P/E of 26.34 and P/B of 22.58 indicate an expensive valuation. Teradata also offers no dividend, channeling capital toward growth and R&D, reflecting a growth-centric strategy.
Premium Valuation vs. Operational Safety
Teradata’s superior profitability comes with a higher valuation premium and more financial risks, while Corpay balances solid returns with a more moderate valuation. Investors seeking operational safety may lean toward Corpay; growth-focused investors might prefer Teradata’s aggressive profile.
Which one offers the Superior Shareholder Reward?
I observe Corpay, Inc. (CPAY) and Teradata Corporation (TDC) both pay no dividends, focusing shareholder rewards on share buybacks and reinvestment. CPAY’s free cash flow per share reaches $18.5 in 2025, supporting buybacks and growth investments, while TDC’s free cash flow stands at $2.87 with a more leveraged balance sheet. CPAY’s zero dividend payout ratio and robust buyback capacity contrast with TDC’s higher financial leverage (debt/equity 4.33 vs. 2.58) risking sustainability. I find CPAY’s capital allocation more prudent, with stronger operating margins (~43% vs. 11%) fueling sustainable buybacks. Thus, CPAY offers superior total shareholder return potential through disciplined reinvestment and buybacks in 2026.
Comparative Score Analysis: The Strategic Profile
The radar chart reveals the core financial DNA and trade-offs of Corpay, Inc. and Teradata Corporation, highlighting their operational strengths and valuation nuances:
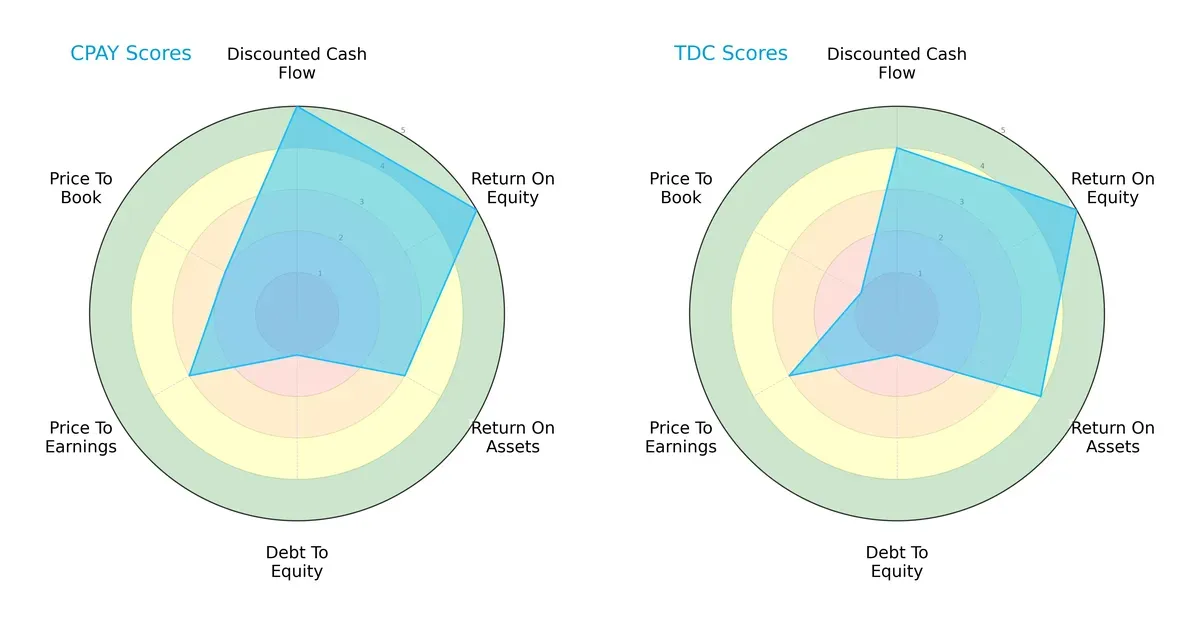
Corpay excels in discounted cash flow and return on equity, signaling robust profit generation and cash prospects. Teradata offers a more balanced asset utilization and slightly better return on assets. Both struggle with debt-to-equity, indicating high leverage risk. Corpay’s valuation is less attractive on price-to-book, while Teradata’s lower price-to-book suggests potential undervaluation. Overall, Teradata presents a steadier profile; Corpay leans heavily on cash flow and equity efficiency.
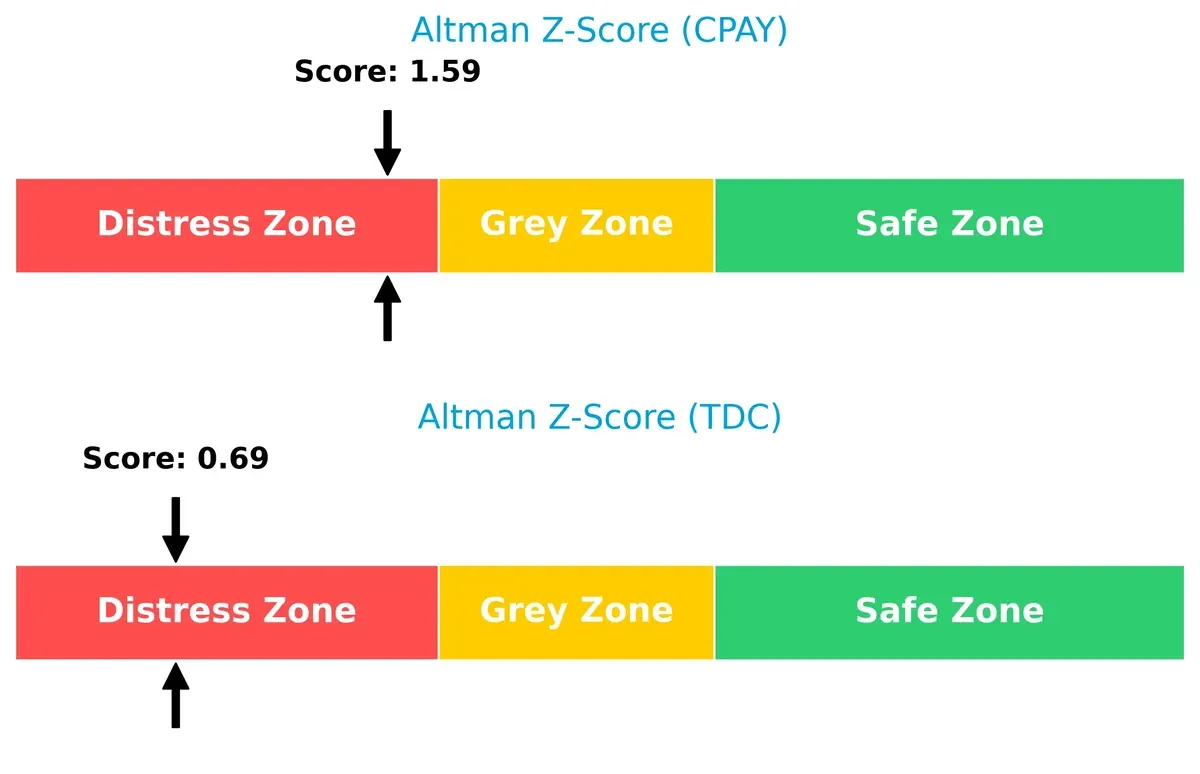
Bankruptcy Risk: Solvency Showdown
Corpay’s Altman Z-Score of 1.59 slightly outperforms Teradata’s 0.69, but both remain in the distress zone, signaling elevated bankruptcy risk amid ongoing market pressures:
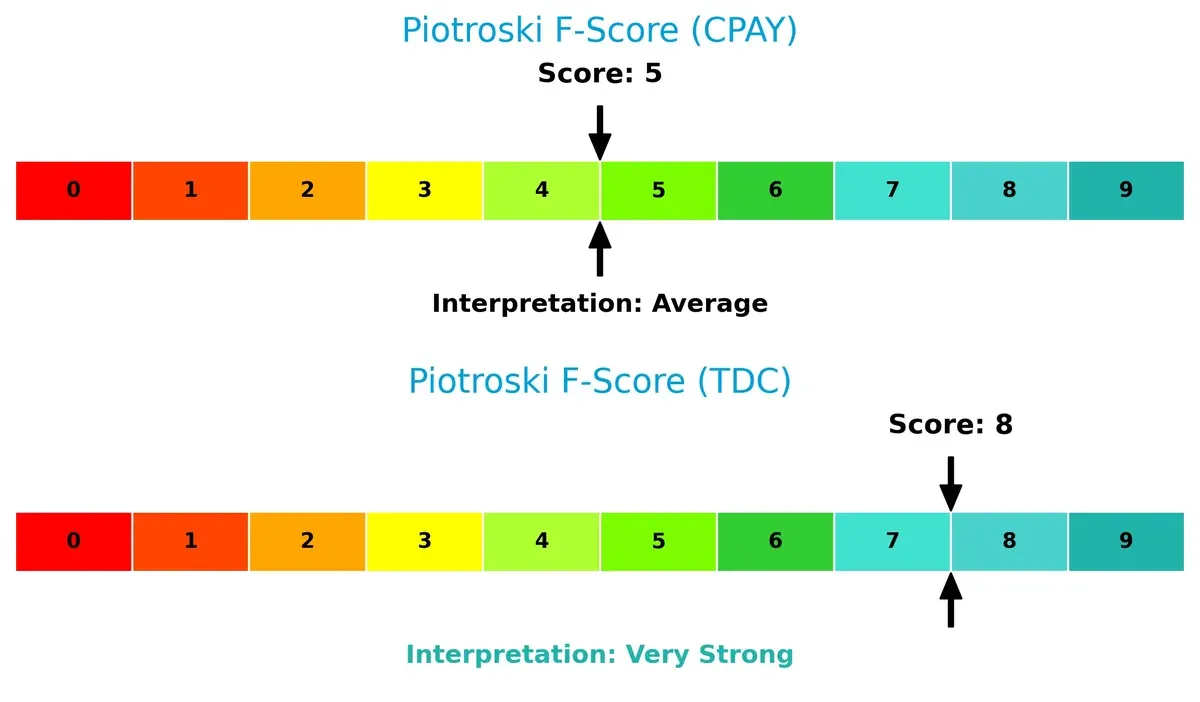
Financial Health: Quality of Operations
Teradata’s Piotroski F-Score of 8 indicates very strong financial health, outperforming Corpay’s average score of 5. Corpay shows possible red flags in operational efficiency and liquidity compared to Teradata’s solid internal metrics:
How are the two companies positioned?
This section dissects Corpay and Teradata’s operational DNA by comparing their revenue distribution and internal strengths and weaknesses. The goal is to confront their economic moats and identify which model offers the most resilient competitive advantage today.
Revenue Segmentation: The Strategic Mix
This visual comparison dissects how Corpay, Inc. and Teradata Corporation diversify their income streams and reveals their primary sector bets:
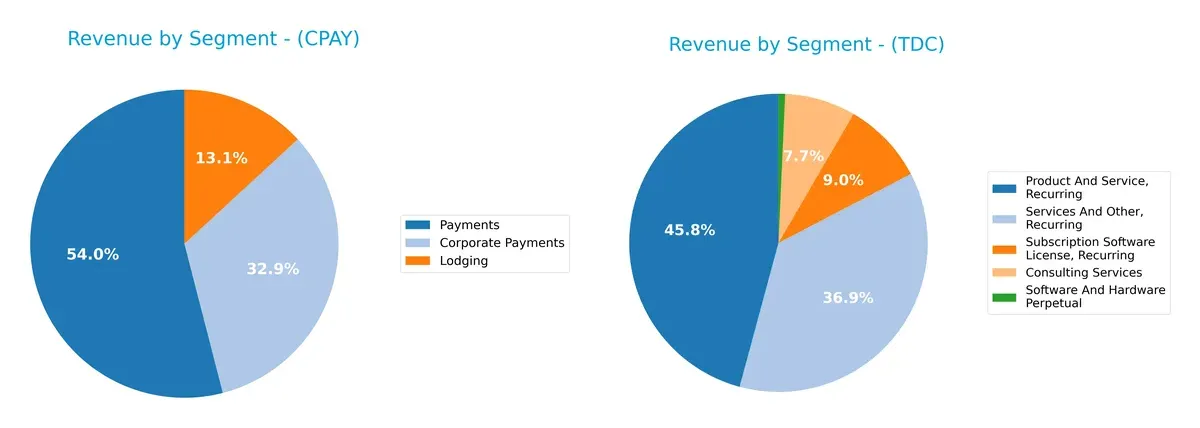
Corpay anchors its revenue in Payments at $2B, with Corporate Payments ($1.22B) and Lodging ($489M) trailing. Teradata boasts a more balanced mix, with Product and Service Recurring ($1.48B) and Services and Other Recurring ($1.19B) closely matched, plus Consulting Services ($248M). Corpay’s reliance on Payments signals concentration risk, while Teradata’s diversified recurring revenue suggests resilience and ecosystem lock-in.
Strengths and Weaknesses Comparison
This table compares the strengths and weaknesses of Corpay, Inc. and Teradata Corporation based on key financial and business metrics:
Corpay Strengths
- Favorable net margin at 23.62%
- Strong ROE of 27.55%
- WACC at 6.26% supports capital efficiency
- High fixed asset turnover of 9.59
- Diversified revenue with corporate payments and lodging
- Significant US revenue of 2.08B
Teradata Strengths
- High ROE at 85.71%
- Strong ROIC at 16.89% exceeding WACC of 5.65%
- Favorable interest coverage at 6.66
- Asset turnover at 1.03 indicates operational efficiency
- Diverse product and service recurring revenues totaling over 2.75B
- Global presence across Americas, EMEA, Asia Pacific
Corpay Weaknesses
- Low current ratio at 0.98 signals liquidity risk
- Unfavorable debt-to-equity ratio at 2.58
- High PB ratio of 5.43 may indicate overvaluation
- Neutral ROIC at 8.78% close to WACC
- Unfavorable asset turnover at 0.17 suggests underutilization
- No dividend yield
Teradata Weaknesses
- Unfavorable current ratio at 0.81 and quick ratio at 0.79
- High debt-to-equity ratio at 4.33 raises leverage concerns
- Elevated PB ratio at 22.58 and PE at 26.34 suggest valuation premium
- Dividend yield is zero despite strong profitability
- Neutral global ratios with 43% unfavorable metrics
Both companies show strong profitability and capital efficiency in different ways. Corpay has higher net margins and asset turnover in fixed assets but weaker liquidity and leverage metrics. Teradata’s strengths lie in exceptional ROE and recurring revenues, balanced against higher leverage and valuation risk. These financial dynamics shape each firm’s strategic opportunities and risk profile.
The Moat Duel: Analyzing Competitive Defensibility
A structural moat shields long-term profits from relentless competition erosion. It defines who wins in sustainable value creation:
Corpay, Inc.: Switching Costs Moat
Corpay’s advantage stems from high switching costs embedded in corporate payment solutions. Its 44% EBIT margin and 70% gross margin confirm strong pricing power. Yet, its declining ROIC signals caution; innovation in cross-border payments could deepen this moat if executed well in 2026.
Teradata Corporation: Data Platform Network Effects
Teradata leverages network effects from its multi-cloud analytics platform, driving ecosystem lock-in. Its ROIC surpasses WACC by 11%, with a rising trend and improving EBIT margin near 11%. Expansion into AI-driven analytics could accelerate growth and fortify its moat in 2026.
Switching Costs vs. Network Effects: The Moat Face-off
Teradata’s rapidly growing ROIC and ecosystem integration create a deeper moat than Corpay’s steady but eroding switching cost advantage. I believe Teradata is better positioned to defend and expand market share amid evolving data demands.
Which stock offers better returns?
Over the past 12 months, Corpay, Inc. and Teradata Corporation showed divergent price movements, with Corpay accelerating upward and Teradata declining sharply, reflecting contrasting trading dynamics.
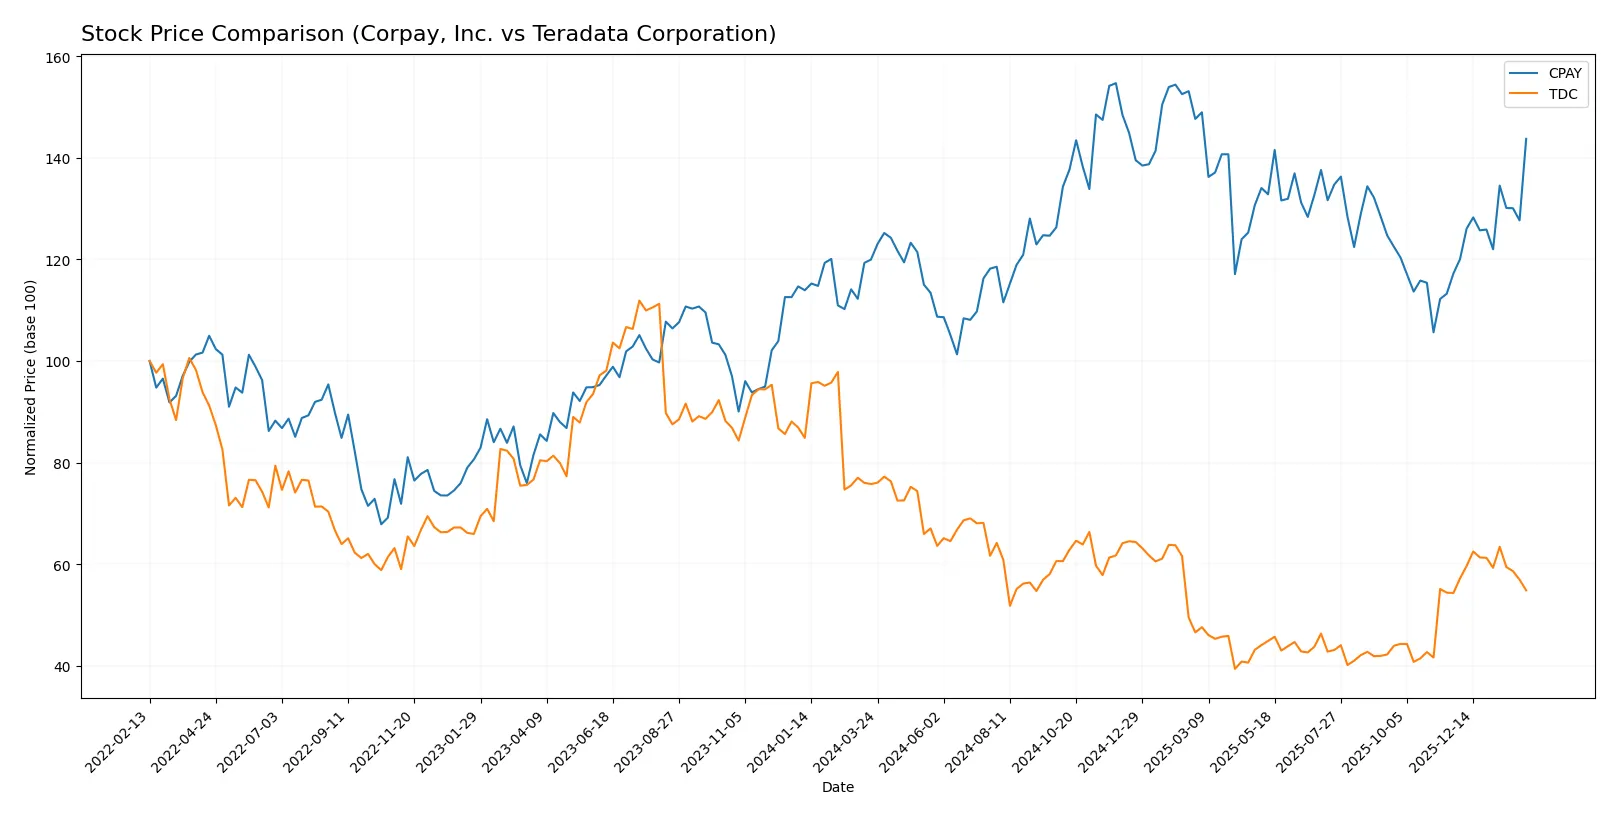
Trend Comparison
Corpay, Inc. posted a bullish trend with a 19.8% gain over 12 months, accelerating upward and reaching a high of 381.18 with notable volatility (std dev 31.25). Recent momentum remains strong with a 22.63% rise.
Teradata Corporation experienced a bearish trend, falling 27.6% over the same period with accelerating decline and relatively low volatility (std dev 5.35). Recent price change is neutral at 0.99%, showing deceleration.
Corpay’s stock outperformed Teradata by delivering robust gains and acceleration, while Teradata’s trend remains negative with minimal recent recovery.
Target Prices
Analysts show a positive outlook with moderate upside potential for both Corpay, Inc. and Teradata Corporation.
| Company | Target Low | Target High | Consensus |
|---|---|---|---|
| Corpay, Inc. | 300 | 390 | 359.33 |
| Teradata Corporation | 27 | 35 | 31 |
Corpay’s consensus target of 359.33 slightly exceeds its current price of 354.19, suggesting modest upside. Teradata’s target consensus of 31 also implies a potential gain from its current 27.47 price.

Don’t Let Luck Decide Your Entry Point
Optimize your entry points with our advanced ProRealTime indicators. You’ll get efficient buy signals with precise price targets for maximum performance. Start outperforming now!
How do institutions grade them?
Corpay, Inc. Grades
The following table summarizes recent institutional grades for Corpay, Inc.:
| Grading Company | Action | New Grade | Date |
|---|---|---|---|
| Mizuho | Maintain | Neutral | 2026-02-06 |
| JP Morgan | Maintain | Overweight | 2026-02-05 |
| RBC Capital | Maintain | Sector Perform | 2026-02-05 |
| Morgan Stanley | Maintain | Overweight | 2026-02-05 |
| Morgan Stanley | Upgrade | Overweight | 2026-01-26 |
| Oppenheimer | Maintain | Outperform | 2026-01-12 |
| Oppenheimer | Upgrade | Outperform | 2025-12-05 |
| UBS | Maintain | Neutral | 2025-11-06 |
| RBC Capital | Maintain | Sector Perform | 2025-11-06 |
| JP Morgan | Maintain | Overweight | 2025-11-06 |
Teradata Corporation Grades
The following table summarizes recent institutional grades for Teradata Corporation:
| Grading Company | Action | New Grade | Date |
|---|---|---|---|
| Citigroup | Maintain | Buy | 2026-02-04 |
| Barclays | Maintain | Underweight | 2026-01-12 |
| RBC Capital | Maintain | Sector Perform | 2026-01-05 |
| Morgan Stanley | Maintain | Overweight | 2025-12-17 |
| Citizens | Upgrade | Market Outperform | 2025-11-10 |
| Barclays | Maintain | Underweight | 2025-11-05 |
| TD Cowen | Maintain | Hold | 2025-11-05 |
| Evercore ISI Group | Maintain | Outperform | 2025-11-05 |
| UBS | Maintain | Neutral | 2025-08-06 |
| Guggenheim | Maintain | Buy | 2025-05-07 |
Which company has the best grades?
Teradata Corporation holds stronger overall grades, including multiple Buy and Outperform ratings. Corpay, Inc. maintains consistent Overweight and Outperform ratings but lacks Buy endorsements. This difference could influence investor confidence and portfolio positioning.
Risks specific to each company
The following categories identify the critical pressure points and systemic threats facing both firms in the 2026 market environment:
1. Market & Competition
Corpay, Inc.
- Faces intense competition in payments and corporate expense software; market leadership challenged by fintech innovation and global expansion risks.
Teradata Corporation
- Operates in a crowded analytics platform market; must continuously innovate against cloud-native competitors and maintain multi-cloud relevance.
2. Capital Structure & Debt
Corpay, Inc.
- High debt-to-equity ratio (2.58) signals financial leverage risk; interest coverage moderate (4.83), warranting cautious monitoring.
Teradata Corporation
- Even higher leverage (4.33 D/E) and better interest coverage (6.66) indicate aggressive debt use but manageable servicing capacity.
3. Stock Volatility
Corpay, Inc.
- Beta at 0.808 suggests moderate sensitivity to market swings; price range wide, reflecting episodic volatility.
Teradata Corporation
- Lower beta of 0.544 implies less market fluctuation; steadier trading range supports risk-averse investor profiles.
4. Regulatory & Legal
Corpay, Inc.
- Exposure to cross-border payments regulation adds complexity; data privacy and financial compliance remain ongoing risks.
Teradata Corporation
- Faces regulatory scrutiny in data management and cloud services; compliance costs may rise with evolving privacy laws globally.
5. Supply Chain & Operations
Corpay, Inc.
- Operational risks stem from global payment network dependencies; technology integration challenges could affect service continuity.
Teradata Corporation
- Relies on cloud infrastructure partners; disruptions in data centers or migration delays could impact client delivery and retention.
6. ESG & Climate Transition
Corpay, Inc.
- Limited direct carbon footprint but must address ESG criteria from payment partners and sustainability reporting pressures.
Teradata Corporation
- Increasing ESG demands from enterprise clients require transparent data governance and energy-efficient cloud operations.
7. Geopolitical Exposure
Corpay, Inc.
- Operates in multiple jurisdictions including Brazil and UK; geopolitical tensions and currency volatility pose risks to cross-border business.
Teradata Corporation
- Global client base exposes it to regional instability; US-China tensions and trade policies could affect supply chains and market access.
Which company shows a better risk-adjusted profile?
Corpay’s high leverage and suboptimal liquidity ratios present financial caution despite strong market positioning. Teradata, while heavily leveraged, shows stronger operational efficiency and lower market volatility. Teradata’s superior Piotroski score (8 vs. 5) and favorability in asset turnover underpin a more resilient financial footing. Yet, both firms lie in the distress zone per Altman Z-scores, signaling bankruptcy risk concerns. The decisive factor is Teradata’s better operational metrics and lower beta, giving it a marginally superior risk-adjusted profile.
Final Verdict: Which stock to choose?
Corpay, Inc. (CPAY) showcases a superpower in its robust profitability and cash flow generation, driving strong shareholder returns. Its declining ROIC trend and balance sheet leverage are points of vigilance. CPAY suits investors targeting aggressive growth with a tolerance for operational risks.
Teradata Corporation (TDC) leverages a strategic moat in its growing ROIC and efficient capital allocation, underpinned by recurring revenue streams. Despite a weaker recent revenue trajectory and balance sheet concerns, TDC offers better stability relative to CPAY. It fits well with GARP investors seeking growth tempered by quality.
If you prioritize high growth fueled by operational efficiency and market expansion, CPAY is the compelling choice due to its superior profit margins and cash generation. However, if you seek a more stable investment with a durable moat and improving profitability, TDC offers better stability despite its recent challenges. Both stocks command careful risk assessment given their leverage and liquidity profiles.
Disclaimer: Investment carries a risk of loss of initial capital. The past performance is not a reliable indicator of future results. Be sure to understand risks before making an investment decision.
Go Further
I encourage you to read the complete analyses of Corpay, Inc. and Teradata Corporation to enhance your investment decisions: