Home > Comparison > Technology > SNPS vs CPAY
The strategic rivalry between Synopsys, Inc. and Corpay, Inc. shapes the Technology sector’s infrastructure software landscape. Synopsys operates as a capital-intensive software giant specializing in electronic design automation, while Corpay focuses on high-margin corporate payment solutions. This analysis pits Synopsys’ engineering-driven growth against Corpay’s transaction-based model. I aim to identify which company’s trajectory offers the superior risk-adjusted outlook for a diversified portfolio in this dynamic industry.
Table of contents
Companies Overview
Synopsys and Corpay anchor critical niches within the software infrastructure landscape, shaping distinct industry facets.
Synopsys, Inc.: Electronic Design Automation Leader
Synopsys dominates the electronic design automation market, generating revenue through software that designs and tests integrated circuits. It offers platforms for digital design, verification, and FPGA prototyping, alongside intellectual property for various connectivity standards. In 2026, Synopsys sharpened its focus on enhancing SoC architecture tools and security testing to support semiconductor innovation.
Corpay, Inc.: Corporate Payments Specialist
Corpay specializes in payments infrastructure, serving businesses and consumers with vehicle, lodging, and corporate payment solutions. Its revenue stems from automated accounts payable, virtual cards, and cross-border payment services. In 2026, Corpay prioritized expanding its global footprint and refining payment automation to streamline expense management for enterprises.
Strategic Collision: Similarities & Divergences
Both companies operate in software infrastructure but pursue divergent philosophies: Synopsys invests heavily in a closed ecosystem of design and IP tools, while Corpay champions an open payments network integrated across industries and borders. They compete primarily on innovation in automation and integration efficiency. Synopsys offers a capital-intensive, tech-driven moat; Corpay provides scalable, client-centric payment solutions, framing distinct risk and growth profiles.
Income Statement Comparison
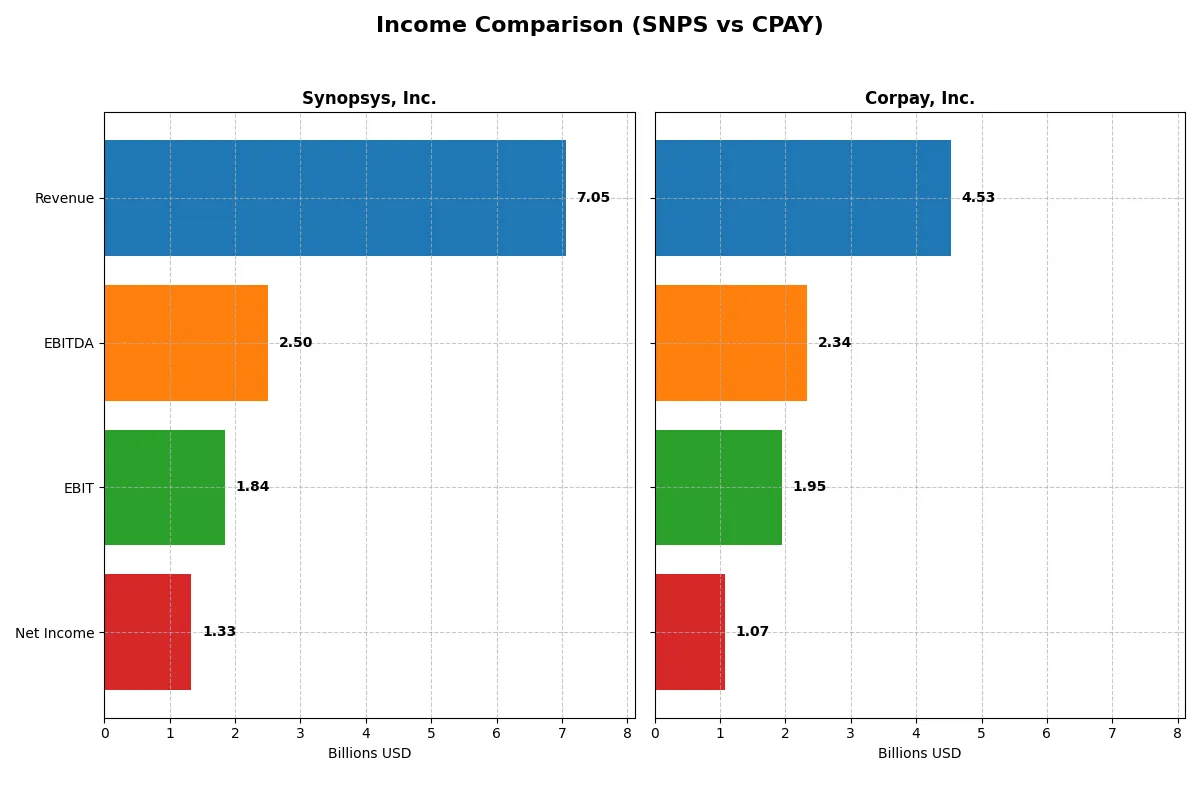
This data dissects the core profitability and scalability of both corporate engines to reveal who dominates the bottom line:
| Metric | Synopsys, Inc. (SNPS) | Corpay, Inc. (CPAY) |
|---|---|---|
| Revenue | 7.05B | 4.53B |
| Cost of Revenue | 1.62B | 1.36B |
| Operating Expenses | 4.52B | 1.21B |
| Gross Profit | 5.43B | 3.17B |
| EBITDA | 2.50B | 2.34B |
| EBIT | 1.84B | 1.95B |
| Interest Expense | 447M | 404M |
| Net Income | 1.33B | 1.07B |
| EPS | 8.13 | 15.25 |
| Fiscal Year | 2025 | 2025 |
Income Statement Analysis: The Bottom-Line Duel
This income statement comparison reveals how efficiently Synopsys and Corpay convert sales into profit and manage operational costs.
Synopsys, Inc. Analysis
Synopsys grew revenue from $4.2B in 2021 to $7.1B in 2025, a 68% rise, with net income climbing 76% over the period. Gross margin stays strong near 77%, reflecting robust cost control. However, net margin slipped sharply in 2025 to 18.9%, indicating pressure on profitability despite a healthy EBIT margin of 26%. R&D investments remain significant, signaling growth focus.
Corpay, Inc. Analysis
Corpay’s revenue expanded from $2.8B in 2021 to $4.5B in 2025, a 60% gain, with net income up 27%. Gross margin at 70% is solid but below Synopsys, while an impressive EBIT margin of 43% highlights operational efficiency. Net margin improved to 23.6% in 2025, supported by effective expense management. Interest expense remains elevated but neutral in impact.
Margin Strength vs. Revenue Expansion
Synopsys leads in top-line growth and gross profit scaling, but its net margin contraction raises efficiency concerns. Corpay delivers superior net and EBIT margins with steadier profitability growth, reflecting disciplined cost control. Investors favoring margin resilience and operating leverage may find Corpay’s profile more attractive, while those prioritizing rapid revenue expansion might lean toward Synopsys.
Financial Ratios Comparison
These vital ratios act as a diagnostic tool to expose the underlying fiscal health, valuation premiums, and capital efficiency of companies:
| Ratios | Synopsys, Inc. (SNPS) | Corpay, Inc. (CPAY) |
|---|---|---|
| ROE | 25.17% | 27.55% |
| ROIC | 12.04% | 8.78% |
| P/E | 54.56 | 19.73 |
| P/B | 2.57 | 5.43 |
| Current Ratio | 1.62 | 0.98 |
| Quick Ratio | 1.52 | 0.98 |
| D/E (Debt-to-Equity) | 0.50 | 2.58 |
| Debt-to-Assets | 29.64% | 37.86% |
| Interest Coverage | 2.05 | 4.83 |
| Asset Turnover | 0.15 | 0.17 |
| Fixed Asset Turnover | 5.04 | 9.59 |
| Payout Ratio | 0 | 0 |
| Dividend Yield | 0 | 0 |
| Fiscal Year | 2025 | 2025 |
Efficiency & Valuation Duel: The Vital Signs
Financial ratios act as a company’s DNA, revealing operational strengths and hidden risks that guide investment decisions.
Synopsys, Inc.
Synopsys posts a modest 4.7% ROE, trailing industry benchmarks, with a stretched P/E ratio at 54.6 signaling high valuation. Its 18.9% net margin reflects operational efficiency, but reinvestment dominates as it pays no dividends. Strong current and quick ratios indicate solid liquidity despite moderate leverage.
Corpay, Inc.
Corpay delivers a commanding 27.6% ROE and a healthy 23.6% net margin, underpinned by a reasonable P/E near 19.7. The stock appears fairly valued but carries high debt (D/E 2.58) and a weak current ratio below 1, raising liquidity concerns. Lack of dividends suggests focus on growth and capital structure optimization.
Valuation Stretch vs. Operational Power
Synopsys shows operational discipline but suffers from a stretched valuation and below-WACC returns, limiting margin for error. Corpay offers stronger profitability and better earnings yield but bears liquidity risks and high leverage. Investors seeking stability may lean toward Synopsys; those favoring growth might consider Corpay’s aggressive profile.
Which one offers the Superior Shareholder Reward?
I see Synopsys (SNPS) and Corpay (CPAY) both forgo dividends, focusing instead on reinvestment and buybacks. Synopsys shows no dividends or buybacks, signaling full reinvestment in R&D and growth, with a strong free cash flow of 8.4/share. Corpay also pays no dividends but backs substantial buybacks, fueled by 18.5/share in free cash flow and a more aggressive capital return policy. However, Corpay’s heavy debt (debt/equity ~2.6) risks sustainability, unlike Synopsys’ conservative leverage and solid margins. For 2026, I favor Synopsys for sustainable long-term value despite slower buybacks, as Corpay’s yield via buybacks is riskier under its financial structure.
Comparative Score Analysis: The Strategic Profile
The radar chart reveals the fundamental DNA and trade-offs of Synopsys, Inc. and Corpay, Inc., highlighting their distinct strategic strengths and vulnerabilities:
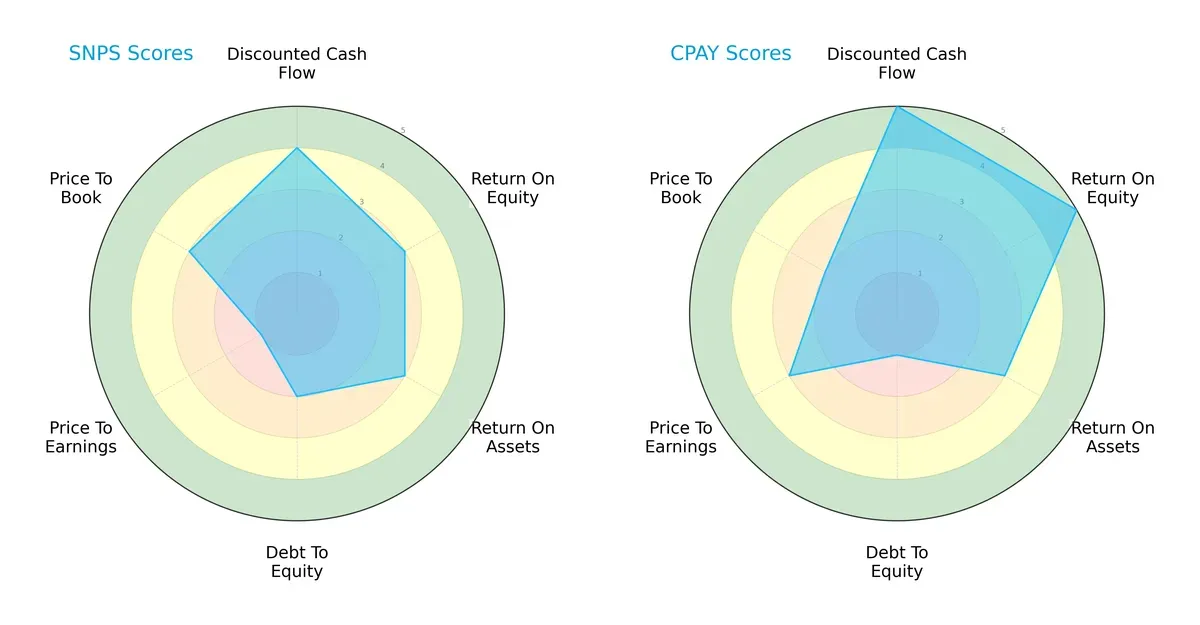
Synopsys shows balanced scores in DCF (4), ROE (3), and ROA (3), but suffers from weak debt management (2) and valuation (P/E at 1). Corpay excels in DCF (5) and ROE (5), leveraging strong profitability but carries higher financial risk with a poor debt-to-equity score (1). Synopsys offers a more balanced profile, while Corpay relies heavily on operational efficiency amid leverage concerns.
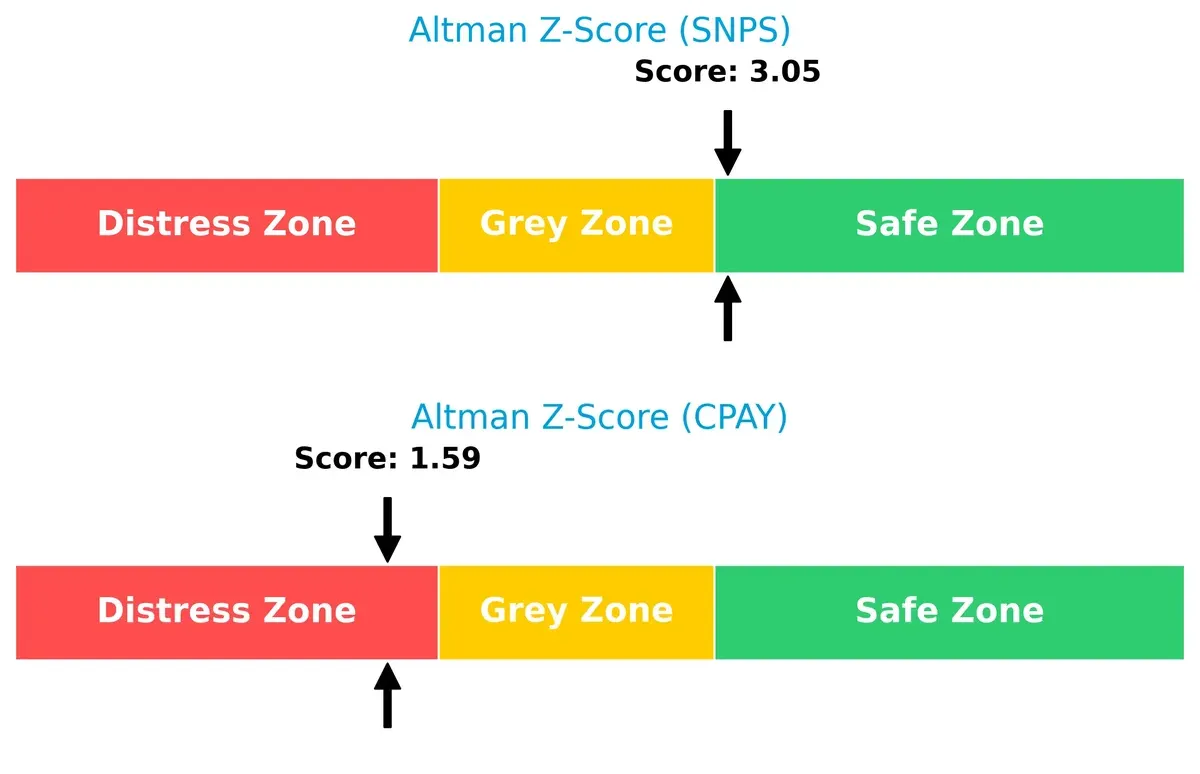
Bankruptcy Risk: Solvency Showdown
The Altman Z-Score difference indicates Synopsys is comfortably in the safe zone (3.05), while Corpay teeters in the distress zone (1.59), signaling elevated bankruptcy risk in this cycle:
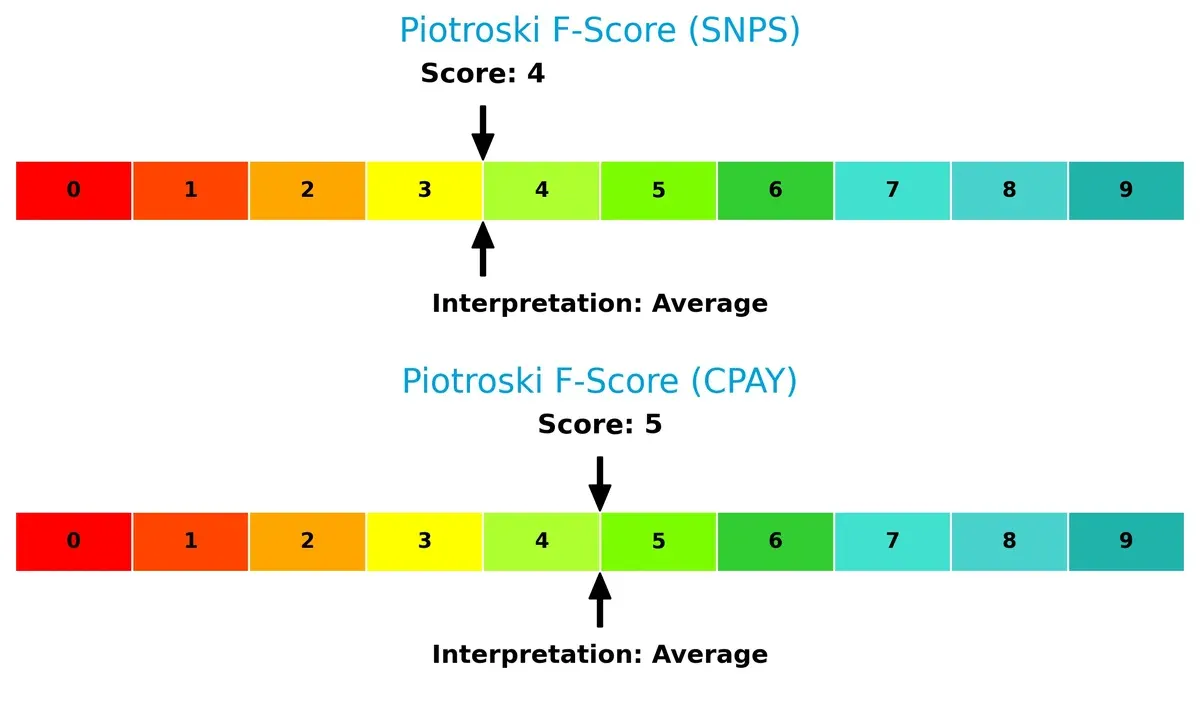
Financial Health: Quality of Operations
Both firms show average Piotroski F-Scores—Synopsys at 4 and Corpay at 5—suggesting moderate financial health with no glaring red flags but room for improvement in operational robustness:
How are the two companies positioned?
This section dissects the operational DNA of Synopsys and Corpay by comparing their revenue distribution and internal dynamics. The goal is to confront their economic moats and identify which business model offers the most resilient competitive advantage today.
Revenue Segmentation: The Strategic Mix
This visual comparison dissects how Synopsys, Inc. and Corpay, Inc. diversify their income streams and reveals where each firm’s primary sector bets lie:
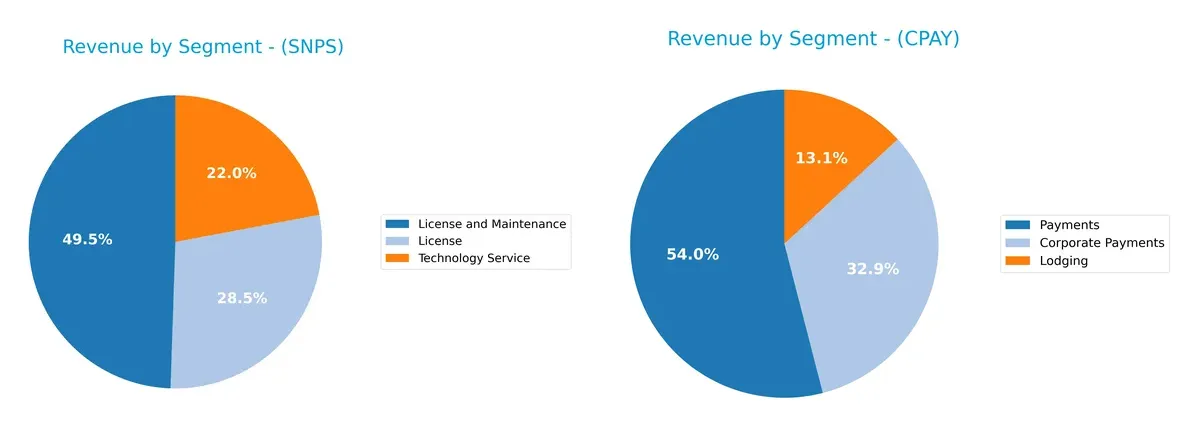
Synopsys anchors revenue in “License and Maintenance” with $3.49B in 2025, complemented by $2.01B from “License” and $1.55B from “Technology Service.” This mix shows a solid focus on software licensing and service, emphasizing ecosystem lock-in. Corpay, however, pivots heavily on “Payments” at $2B, supplemented by “Corporate Payments” and “Lodging” at $1.22B and $489M. Corpay’s concentration in payments signals infrastructure dominance but exposes it to sector-specific risks. Synopsys maintains broader diversification versus Corpay’s payment-centric profile.
Strengths and Weaknesses Comparison
This table compares the Strengths and Weaknesses of Synopsys, Inc. and Corpay, Inc.:
Synopsys Strengths
- Diverse revenue streams including License, Maintenance, and Technology Service
- Strong US market presence with 3.1B revenue
- Favorable net margin at 18.89%
- Healthy liquidity ratios with current ratio 1.62 and quick ratio 1.52
- Low debt to assets at 29.64%
- Efficient fixed asset turnover at 5.04
Corpay Strengths
- Higher net margin at 23.62% and ROE at 27.55%
- Favorable WACC at 6.26% indicating cost-efficient capital
- Strong fixed asset turnover at 9.59
- Significant US revenue of 2.08B
- Diversified geographically with strong UK and Brazil presence
- Neutral P/E at 19.73
Synopsys Weaknesses
- Low ROE at 4.7% and ROIC at 1.97%, below WACC
- High P/E ratio of 54.56 suggests overvaluation risk
- Unfavorable asset turnover at 0.15 indicates low asset efficiency
- No dividend yield limits income returns
- Neutral debt/equity of 0.5, could limit leverage benefits
Corpay Weaknesses
- Current ratio below 1 at 0.98 signals liquidity risk
- High debt/equity at 2.58 raises solvency concerns
- Unfavorable asset turnover at 0.17
- Unfavorable PB ratio at 5.43 questions valuation
- No dividend yield limits shareholder income
Both companies show strengths in profitability and market presence but face challenges in asset efficiency and capital structure. Synopsys’s higher liquidity contrasts with Corpay’s leverage risks, influencing their strategic financial positioning.
The Moat Duel: Analyzing Competitive Defensibility
A structural moat is the only reliable shield protecting long-term profits from relentless competitive erosion:
Synopsys, Inc.: Intangible Assets Powerhouse
Synopsys relies on deep intangible assets like proprietary IP and design platforms. This moat yields high gross margins (~77%) but suffers declining ROIC, signaling profitability pressures in 2026.
Corpay, Inc.: Cost Advantage Specialist
Corpay’s moat stems from cost-efficient payment networks and scale in corporate expenses. It delivers superior EBIT margins (43%) and positive ROIC spread, though profitability slightly wanes amid market shifts.
Verdict: Intangible Assets vs. Cost Advantage
Corpay holds a wider moat with ROIC above WACC and superior margin stability. Synopsys’ shrinking ROIC warns of value erosion. Corpay is better positioned to defend market share in 2026.
Which stock offers better returns?
Over the past 12 months, Synopsys, Inc. experienced a significant price decline, while Corpay, Inc. showed strong upward momentum with accelerating gains and increasing buyer dominance.
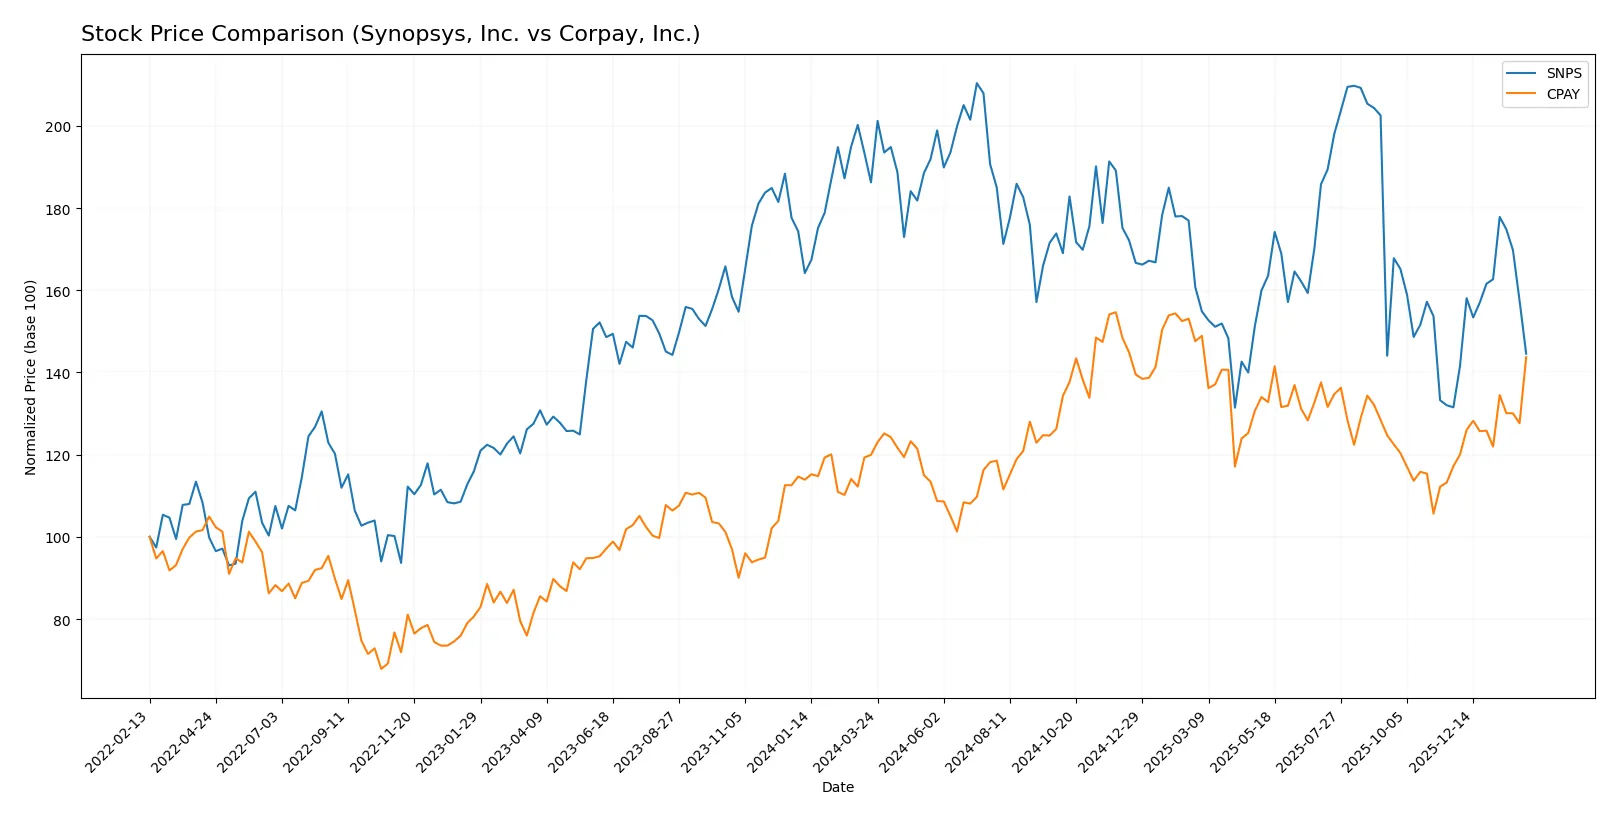
Trend Comparison
Synopsys, Inc. stock fell by 22.39% over the past year, marking a bearish trend with accelerating decline. The price ranged from a high of 621.3 to a low of 388.13, showing significant volatility.
Corpay, Inc. stock rose by 19.8% over the same period, sustaining a bullish trend with accelerating gains. Volatility is moderate, with a price range between 249.66 and 381.18.
Corpay delivered the highest market performance, outperforming Synopsys with positive returns and stronger buyer dominance throughout the year.
Target Prices
Analysts present a constructive consensus for Synopsys, Inc. and Corpay, Inc., indicating upside potential.
| Company | Target Low | Target High | Consensus |
|---|---|---|---|
| Synopsys, Inc. | 425 | 600 | 530 |
| Corpay, Inc. | 300 | 390 | 359.33 |
Synopsys trades near its target low at 427, suggesting modest upside to the 530 consensus. Corpay’s current price of 354 aligns closely with consensus, indicating balanced market expectations.

Don’t Let Luck Decide Your Entry Point
Optimize your entry points with our advanced ProRealTime indicators. You’ll get efficient buy signals with precise price targets for maximum performance. Start outperforming now!
How do institutions grade them?
Here is a comparison of the most recent institutional grades for Synopsys, Inc. and Corpay, Inc.:
Synopsys, Inc. Grades
The table below summarizes recent grade changes and actions from major grading companies for Synopsys, Inc.
| Grading Company | Action | New Grade | Date |
|---|---|---|---|
| Piper Sandler | Downgrade | Neutral | 2026-01-13 |
| Morgan Stanley | Maintain | Overweight | 2025-12-12 |
| Wells Fargo | Maintain | Equal Weight | 2025-12-11 |
| JP Morgan | Maintain | Overweight | 2025-12-11 |
| Keybanc | Maintain | Overweight | 2025-12-11 |
| Piper Sandler | Maintain | Overweight | 2025-12-11 |
| B of A Securities | Upgrade | Buy | 2025-12-11 |
| Needham | Maintain | Buy | 2025-12-11 |
| Rosenblatt | Maintain | Buy | 2025-12-11 |
| Rosenblatt | Upgrade | Buy | 2025-12-09 |
Corpay, Inc. Grades
The table below shows recent grades and actions from established grading firms for Corpay, Inc.
| Grading Company | Action | New Grade | Date |
|---|---|---|---|
| Mizuho | Maintain | Neutral | 2026-02-06 |
| JP Morgan | Maintain | Overweight | 2026-02-05 |
| RBC Capital | Maintain | Sector Perform | 2026-02-05 |
| Morgan Stanley | Maintain | Overweight | 2026-02-05 |
| Morgan Stanley | Upgrade | Overweight | 2026-01-26 |
| Oppenheimer | Maintain | Outperform | 2026-01-12 |
| Oppenheimer | Upgrade | Outperform | 2025-12-05 |
| UBS | Maintain | Neutral | 2025-11-06 |
| RBC Capital | Maintain | Sector Perform | 2025-11-06 |
| JP Morgan | Maintain | Overweight | 2025-11-06 |
Which company has the best grades?
Corpay, Inc. has consistently received strong grades such as Overweight and Outperform, with several recent upgrades. Synopsys, Inc. holds mostly Overweight and Buy grades but includes a recent downgrade to Neutral. Corpay’s steady upgrades may signal greater institutional confidence, potentially influencing investor sentiment positively.
Risks specific to each company
The following categories identify the critical pressure points and systemic threats facing Synopsys, Inc. and Corpay, Inc. in the 2026 market environment:
1. Market & Competition
Synopsys, Inc.
- Faces intense competition in electronic design automation with innovation-driven pressure.
Corpay, Inc.
- Operates in payments, exposed to fintech disruption and evolving corporate payment needs.
2. Capital Structure & Debt
Synopsys, Inc.
- Maintains moderate leverage with debt-to-assets at 29.6%, interest coverage neutral at 4.12x.
Corpay, Inc.
- Exhibits higher leverage with debt-to-equity ratio of 2.58, raising financial risk concerns.
3. Stock Volatility
Synopsys, Inc.
- Beta of 1.13 indicates above-market volatility, reflecting tech sector cyclicality.
Corpay, Inc.
- Lower beta at 0.81 suggests less volatility but possibly lower growth expectations.
4. Regulatory & Legal
Synopsys, Inc.
- Subject to software export controls and IP protection regulations globally.
Corpay, Inc.
- Faces complex compliance across multiple countries in payments, increasing regulatory risk.
5. Supply Chain & Operations
Synopsys, Inc.
- Relies on semiconductor ecosystem stability; risks from chip shortages remain.
Corpay, Inc.
- Operational risks tied to global payment infrastructure and third-party service providers.
6. ESG & Climate Transition
Synopsys, Inc.
- Moderate ESG focus; technology footprint requires ongoing energy efficiency improvements.
Corpay, Inc.
- Increasing scrutiny on sustainable finance and social governance in payment services.
7. Geopolitical Exposure
Synopsys, Inc.
- Exposure to US-China trade tensions affecting semiconductor supply chain.
Corpay, Inc.
- Geographic footprint in US, Brazil, UK, exposing it to variable regulatory and political risks.
Which company shows a better risk-adjusted profile?
Synopsys faces its largest risk from market competition and innovation pace, threatening its high valuation. Corpay’s most significant risk is its elevated debt load, which strains financial flexibility. Despite Synopsys’s higher stock volatility, its safer Altman Z-Score and stronger liquidity ratios offer a more balanced risk profile. Corpay’s Z-Score in the distress zone and weaker current ratio underline financial vulnerability. Thus, Synopsys demonstrates a better risk-adjusted profile amid 2026’s uncertainties.
Final Verdict: Which stock to choose?
Synopsys, Inc. excels as a technology powerhouse with unmatched efficiency in R&D investment, fueling strong revenue growth. Its main point of vigilance lies in a declining ROIC that signals potential value destruction. Synopsys suits an aggressive growth portfolio willing to weather short-term profitability challenges.
Corpay, Inc. leverages a strategic moat rooted in steady cash flow generation and solid returns on equity. Despite higher leverage and weaker liquidity compared to Synopsys, Corpay offers a comparatively safer profile with better value creation. It fits well within a GARP (Growth at a Reasonable Price) portfolio seeking stability alongside growth.
If you prioritize innovation-driven expansion and can tolerate cyclical profitability dips, Synopsys is the compelling choice due to its robust gross margins and R&D focus. However, if you seek better capital efficiency and superior earnings stability, Corpay offers better long-term value creation despite financial leverage concerns. Both present distinct risk-reward profiles aligned with different investor strategies.
Disclaimer: Investment carries a risk of loss of initial capital. The past performance is not a reliable indicator of future results. Be sure to understand risks before making an investment decision.
Go Further
I encourage you to read the complete analyses of Synopsys, Inc. and Corpay, Inc. to enhance your investment decisions: