Home > Comparison > Technology > CPAY vs STNE
The strategic rivalry between Corpay, Inc. and StoneCo Ltd. shapes the evolution of the global technology infrastructure sector. Corpay operates as a capital-intensive payments company focused on vehicle and corporate expense management across multiple countries. In contrast, StoneCo targets digital commerce with fintech solutions for Brazilian merchants, emphasizing hyper-local service. This analysis dissects their divergent models to identify which trajectory offers the superior risk-adjusted return for a diversified portfolio.

Table of contents
Companies Overview
Corpay, Inc. and StoneCo Ltd. stand as pivotal players shaping payment infrastructure across global and regional markets.
Corpay, Inc.: Global Payments Powerhouse
Corpay leads in payments infrastructure for vehicle and corporate expenses worldwide. It generates revenue via fuel, toll, lodging, and corporate payment solutions across multiple countries. In 2026, Corpay sharpens its focus on cross-border payments and automated accounts payable services, driving efficiency for business clients.
StoneCo Ltd.: Brazil’s Fintech Innovator
StoneCo dominates Brazilian fintech by enabling digital and in-store commerce for small and medium enterprises. Its core revenue stems from software and payment solutions distributed through proprietary Stone Hubs and sales networks. The company prioritizes expanding merchant penetration and integrating digital platforms in 2026 to deepen market roots.
Strategic Collision: Similarities & Divergences
Both operate in software infrastructure but diverge in scope—Corpay targets global corporate payments while StoneCo focuses on Brazil’s SME commerce. Their battleground is payment innovation, with Corpay leveraging cross-border scale and StoneCo emphasizing hyper-local service. These differences define distinct investment profiles: global diversification versus concentrated regional growth.
Income Statement Comparison
This data dissects the core profitability and scalability of both corporate engines to reveal who dominates the bottom line:
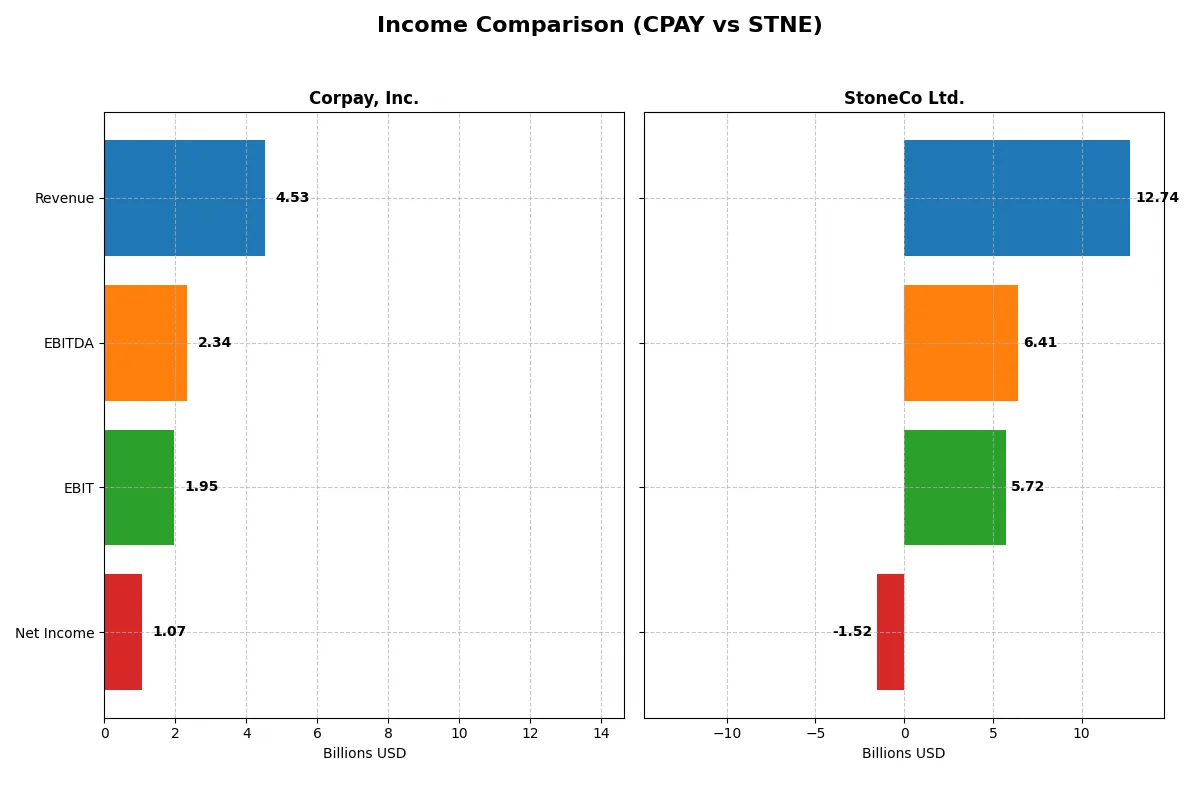
| Metric | Corpay, Inc. (CPAY) | StoneCo Ltd. (STNE) |
|---|---|---|
| Revenue | 4.53B | 12.74B |
| Cost of Revenue | 1.36B | 3.39B |
| Operating Expenses | 1.21B | 3.47B |
| Gross Profit | 3.17B | 9.35B |
| EBITDA | 2.34B | 6.41B |
| EBIT | 1.95B | 5.72B |
| Interest Expense | 404M | 1.06B |
| Net Income | 1.07B | -1.52B |
| EPS | 15.25 | -5.02 |
| Fiscal Year | 2025 | 2024 |
Income Statement Analysis: The Bottom-Line Duel
This comparison reveals how Corpay and StoneCo convert revenue into profit, highlighting operational efficiency and bottom-line strength.
Corpay, Inc. Analysis
Corpay’s revenue climbs steadily, reaching $4.53B in 2025 with net income at $1.07B. Gross margin holds strong near 70%, and net margin remains healthy at 23.6%. The 2025 figures show efficient cost control and solid EBITDA growth, signaling robust momentum despite a slight dip in net margin growth.
StoneCo Ltd. Analysis
StoneCo’s revenue expands rapidly to BRL 12.7B in 2024, with gross margin at a favorable 73.4%. EBIT margin also impresses at 44.9%. However, the company posts a net loss of BRL 1.52B, reflecting persistent bottom-line challenges despite operational gains and top-line growth.
Margin Strength vs. Bottom-Line Profitability
Corpay delivers consistent profitability and margin stability, while StoneCo struggles with sustained losses despite higher revenue and gross margins. Corpay’s profile appeals to investors seeking dependable earnings and margin discipline. StoneCo offers growth but carries significant net income risk, making it a riskier investment proposition.
Financial Ratios Comparison
These vital ratios act as a diagnostic tool to expose the underlying fiscal health, valuation premiums, and capital efficiency of the companies analyzed:
| Ratios | Corpay, Inc. (CPAY) | StoneCo Ltd. (STNE) |
|---|---|---|
| ROE | 27.5% | -12.9% |
| ROIC | 8.8% | 22.4% |
| P/E | 19.7 | -9.8 |
| P/B | 5.43 | 1.27 |
| Current Ratio | 0.98 | 1.37 |
| Quick Ratio | 0.98 | 1.37 |
| D/E (Debt-to-Equity) | 2.58 | 1.10 |
| Debt-to-Assets | 37.9% | 23.5% |
| Interest Coverage | 4.83 | 5.57 |
| Asset Turnover | 0.17 | 0.23 |
| Fixed Asset Turnover | 9.59 | 6.95 |
| Payout Ratio | 0 | 0 |
| Dividend Yield | 0 | 0 |
| Fiscal Year | 2025 | 2024 |
Efficiency & Valuation Duel: The Vital Signs
Financial ratios serve as a company’s DNA, uncovering hidden risks and operational strengths crucial for investment analysis.
Corpay, Inc.
Corpay posts a strong ROE of 27.55% and a healthy net margin of 23.62%, signaling robust profitability. The P/E of 19.73 suggests a fairly valued stock, but a high P/B of 5.43 and a low current ratio of 0.98 flag some balance sheet risks. Corpay does not pay dividends, opting to reinvest earnings for growth.
StoneCo Ltd.
StoneCo reveals a negative ROE of -12.87% and a net margin of -11.89%, reflecting operational challenges. However, its P/B of 1.27 and a P/E of -9.84 indicate a potentially undervalued stock. The company maintains a solid current ratio of 1.37 and reinvests cash flow to improve capital returns, with no dividend payout.
Risk-Adjusted Profitability vs. Valuation Discipline
Corpay offers superior profitability but shows stretched balance sheet metrics and no dividend yield. StoneCo struggles with losses yet benefits from a conservative valuation and stronger liquidity. Investors seeking operational safety may prefer StoneCo, while those targeting profitability might lean toward Corpay’s growth profile.
Which one offers the Superior Shareholder Reward?
Corpay, Inc. (CPAY) and StoneCo Ltd. (STNE) both forgo dividends, focusing on reinvestment and buybacks. CPAY boasts a robust free cash flow per share of $18.5 and consistent buyback activity, enhancing shareholder value. STNE, however, shows negative net margins and free cash flow, signaling distress despite modest buybacks. I find CPAY’s distribution model, underpinned by strong cash flow and disciplined capital allocation, more sustainable and rewarding for shareholders in 2026.
Comparative Score Analysis: The Strategic Profile
The radar chart reveals the fundamental DNA and trade-offs of Corpay, Inc. and StoneCo Ltd., highlighting their financial strengths and weaknesses across key metrics:
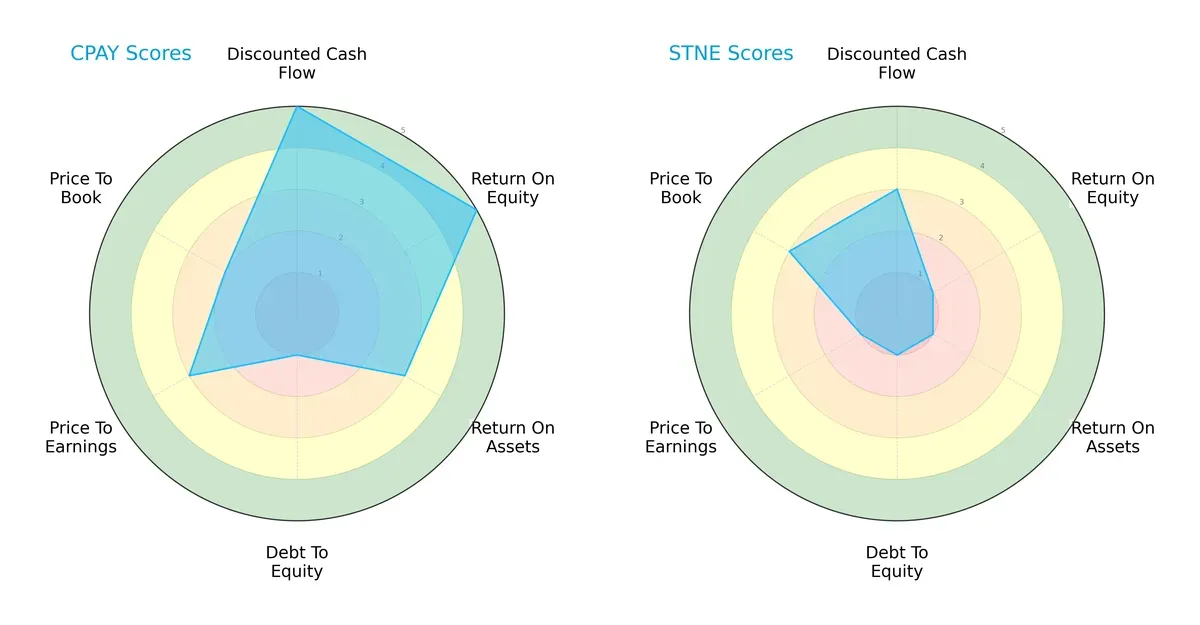
Corpay, Inc. demonstrates strong discounted cash flow (5) and return on equity (5), signaling efficient capital use and future cash generation. StoneCo Ltd. lags behind with weaker profitability scores (ROE 1, ROA 1) and valuation metrics (P/E 1). Both companies share a weak debt-to-equity score (1), indicating high leverage risks. Corpay offers a more balanced profile, while StoneCo relies on a modest price-to-book advantage (3) to attract value-focused investors.
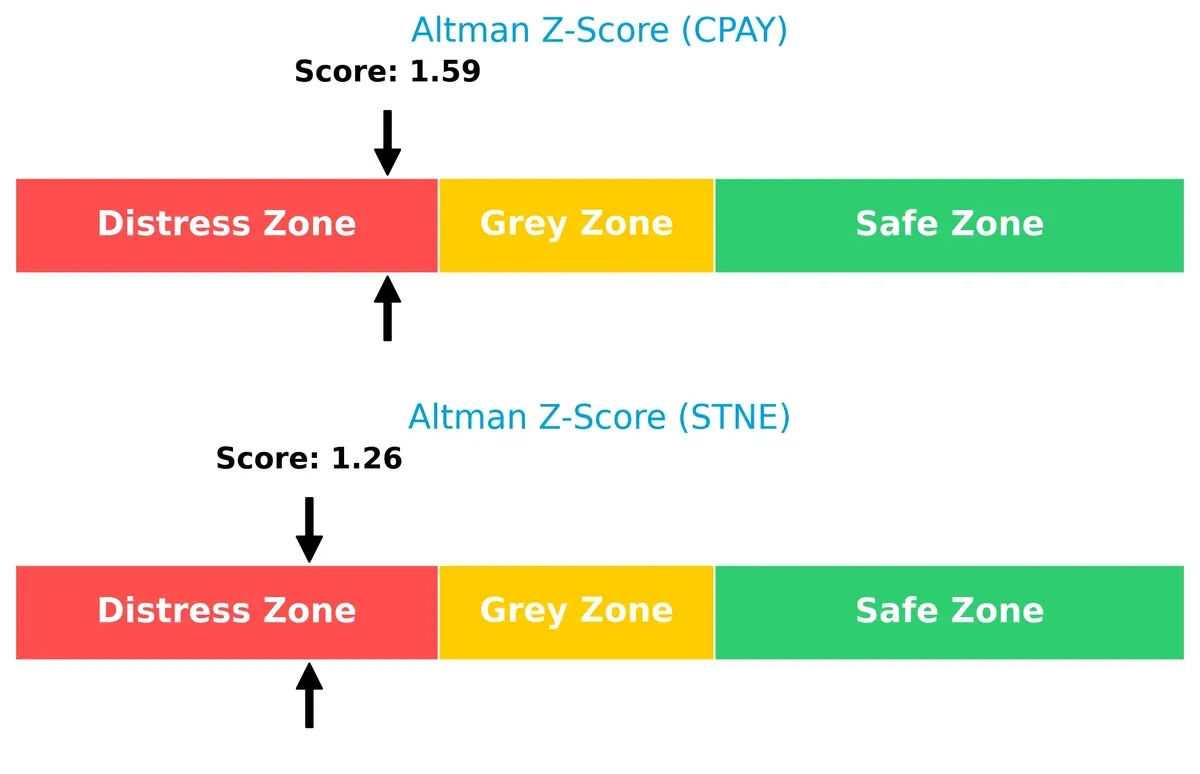
Bankruptcy Risk: Solvency Showdown
The Altman Z-Scores place both companies in the distress zone, with Corpay slightly ahead at 1.59 versus StoneCo’s 1.26, implying elevated bankruptcy risk amid current market pressures:
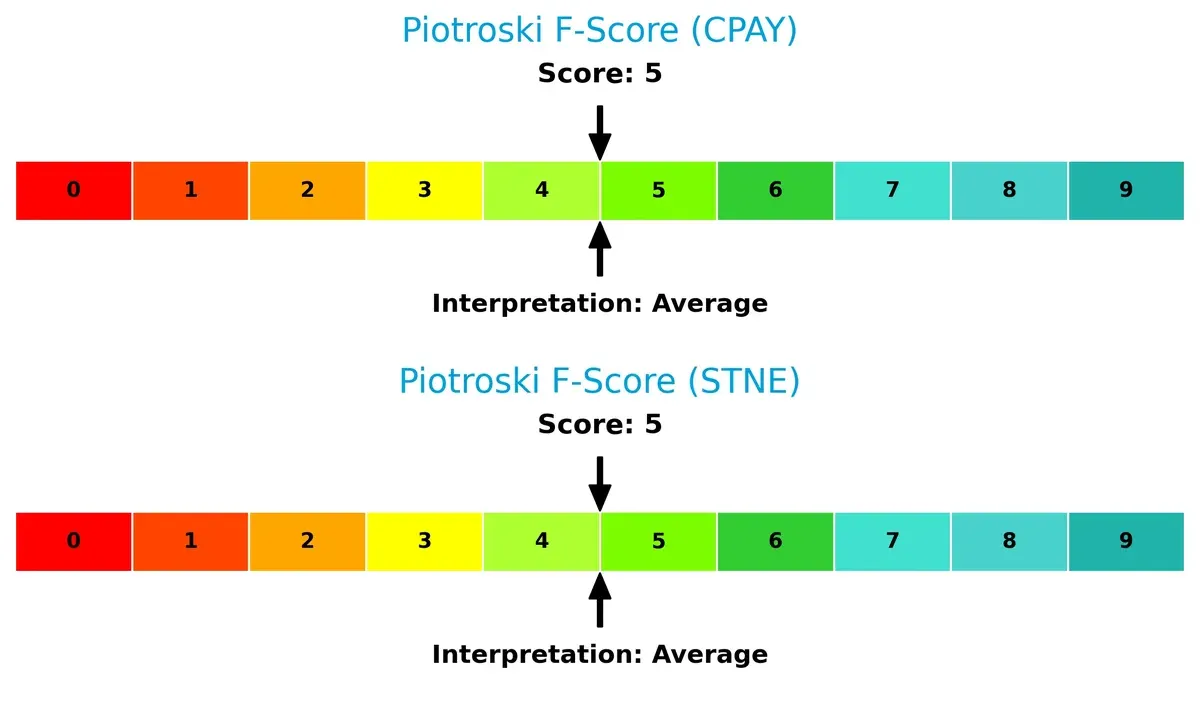
Financial Health: Quality of Operations
Both firms score a moderate Piotroski F-Score of 5, reflecting average operational quality with no clear red flags, but also no signs of peak financial health:
How are the two companies positioned?
This section dissects the operational DNA of Corpay and StoneCo by comparing their revenue distribution and internal dynamics. The goal is to confront their economic moats and identify which business model delivers the most resilient and sustainable competitive advantage today.
Revenue Segmentation: The Strategic Mix
This comparison dissects how Corpay, Inc. and StoneCo Ltd. diversify their income streams and reveals where each company stakes its primary sector bets:
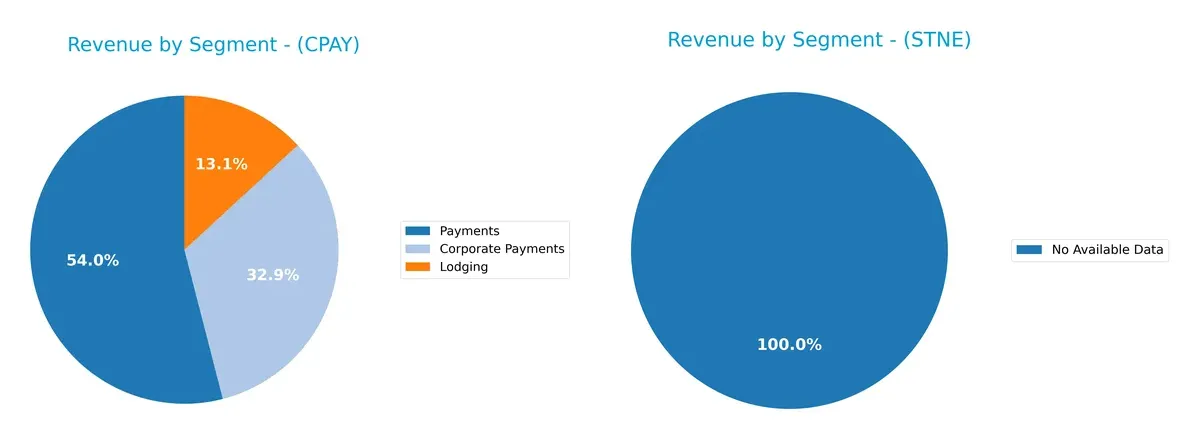
Corpay, Inc. anchors its revenue in Payments at $2B, with Corporate Payments ($1.22B) and Lodging ($489M) trailing. This mix shows moderate diversification, leaning on transaction ecosystems. StoneCo lacks available segmentation data, preventing a direct contrast. Corpay’s reliance on Payments signals infrastructure dominance but also concentration risk if market shifts occur in transaction volumes. Its diversified but weighted approach balances growth with ecosystem lock-in.
Strengths and Weaknesses Comparison
This table compares the Strengths and Weaknesses of Corpay, Inc. and StoneCo Ltd.:
Corpay Strengths
- Strong profitability with 23.6% net margin
- Favorable ROE at 27.55%
- Lower debt-to-assets at 37.86%
- High fixed asset turnover at 9.59
- Diversified revenue across US, UK, Brazil markets
StoneCo Strengths
- Favorable ROIC at 22.41%
- Strong asset efficiency with fixed asset turnover 6.95
- Good liquidity with current and quick ratios at 1.37
- Low debt-to-assets at 23.53%
- Favorable P/B ratio at 1.27
Corpay Weaknesses
- Unfavorable current ratio below 1 at 0.98
- High debt-to-equity at 2.58
- Asset turnover weak at 0.17
- Unfavorable P/B ratio at 5.43
- No dividend yield
- Neutral ROIC relative to WACC
StoneCo Weaknesses
- Negative net margin and ROE
- Unfavorable WACC at 10.66% above ROIC
- Higher debt-to-equity at 1.1
- Unfavorable asset turnover at 0.23
- No dividend yield
Corpay shows strong profitability and diversified geographic revenue but faces liquidity and leverage challenges. StoneCo has solid capital efficiency and liquidity but struggles with negative profitability and cost of capital pressures. These contrasts highlight different strategic and financial priorities.
The Moat Duel: Analyzing Competitive Defensibility
A structural moat is the only barrier protecting long-term profits from relentless competitive erosion in dynamic markets:
Corpay, Inc.: Intangible Assets and Scale Economies
Corpay’s moat stems from its comprehensive payment solutions spanning vehicle and corporate expenses, reflected in a solid 23.6% net margin. While ROIC exceeds WACC by 2.5%, its declining trend signals rising competitive pressure. Expansion into new corporate payment verticals in 2026 could reinforce this moat but requires vigilance.
StoneCo Ltd.: Network Effects and Market Penetration
StoneCo leverages strong network effects in Brazil’s SME fintech space, delivering a robust 44.9% EBIT margin and an impressive 11.7% ROIC premium over WACC. Unlike Corpay, StoneCo’s ROIC trend is sharply positive, demonstrating growing profitability. Its hyper-local Stone Hubs and digital merchant integrations position it well for market disruption and scale in 2026.
Network Effects vs. Intangible Asset Scale: The Moat Battle
StoneCo’s expanding ROIC and stronger margin profile reveal a wider, deeper moat than Corpay’s more vulnerable but stable asset base. StoneCo appears better equipped to defend and grow market share amid intensifying fintech competition.
Which stock offers better returns?
The past year shows contrasting dynamics: Corpay, Inc. surged nearly 20%, displaying accelerating strength, while StoneCo Ltd. edged slightly down, with modest recent gains.
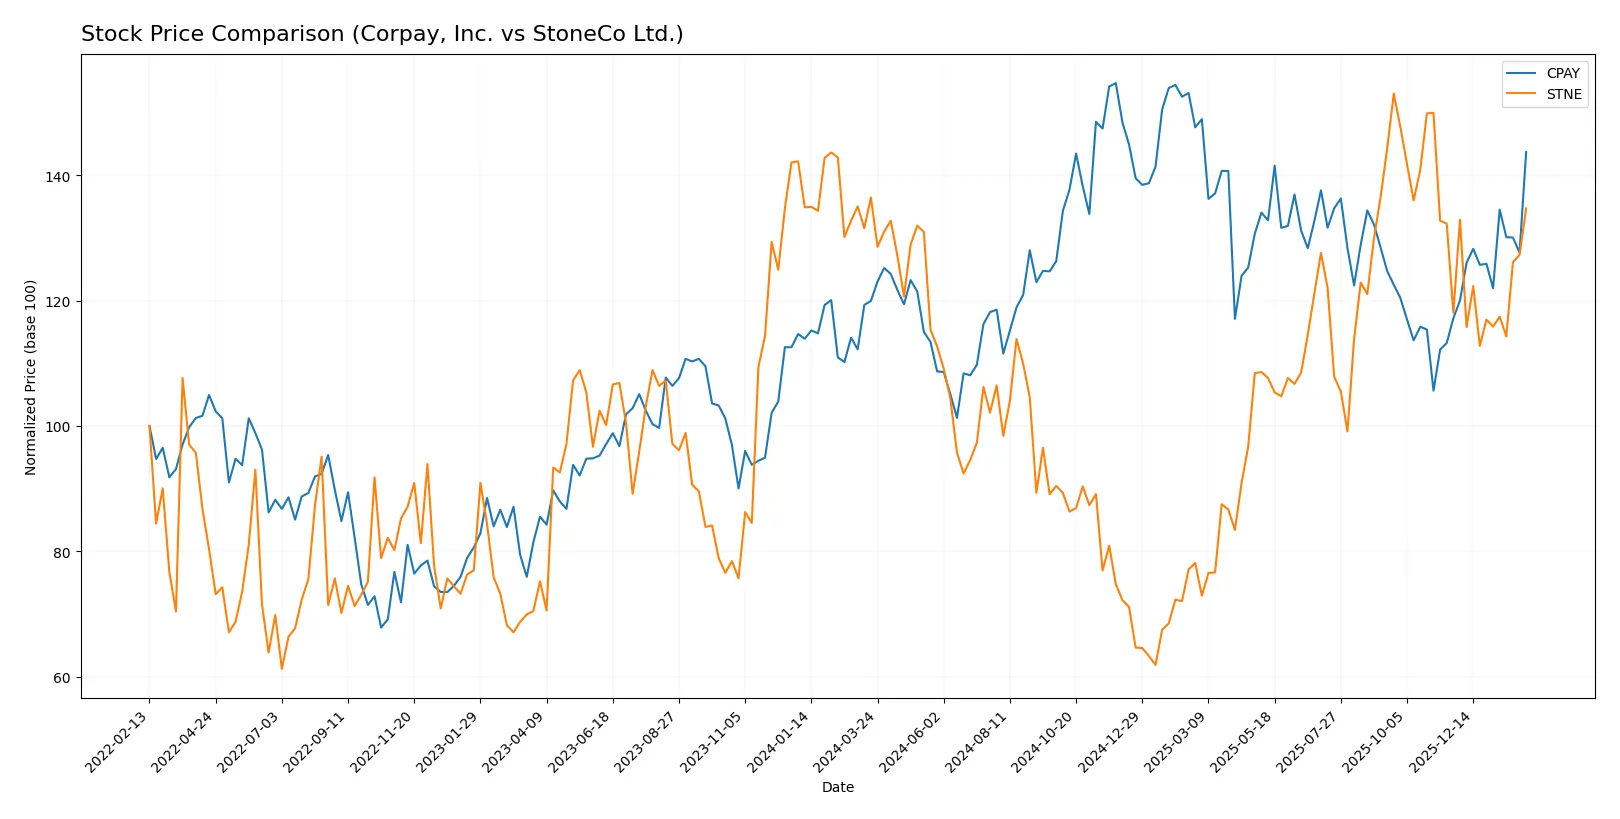
Trend Comparison
Corpay, Inc. posted a bullish 19.8% gain over 12 months, with accelerating upward momentum and high volatility, reaching a peak near 381. StoneCo Ltd. fell 1.27%, marking a bearish trend despite acceleration and low price volatility.
StoneCo Ltd.’s recent 14.09% rise suggests some recovery, but its full-year decline contrasts with Corpay’s sustained bullish trajectory and larger price swings. Corpay delivered the higher market performance overall.
Target Prices
Analysts present a clear target price consensus for Corpay, Inc. and StoneCo Ltd.
| Company | Target Low | Target High | Consensus |
|---|---|---|---|
| Corpay, Inc. | 300 | 390 | 359.33 |
| StoneCo Ltd. | 19 | 21 | 19.83 |
The consensus target for Corpay slightly exceeds its current price of 354.19, signaling moderate upside potential. StoneCo’s consensus target surpasses its current 17.08 price, suggesting expected growth but with a narrower margin.

Don’t Let Luck Decide Your Entry Point
Optimize your entry points with our advanced ProRealTime indicators. You’ll get efficient buy signals with precise price targets for maximum performance. Start outperforming now!
How do institutions grade them?
Here is a comparison of the recent institutional grades for Corpay, Inc. and StoneCo Ltd.:
Corpay, Inc. Grades
The following table lists recent grades issued by recognized financial institutions for Corpay, Inc.
| Grading Company | Action | New Grade | Date |
|---|---|---|---|
| Mizuho | Maintain | Neutral | 2026-02-06 |
| JP Morgan | Maintain | Overweight | 2026-02-05 |
| RBC Capital | Maintain | Sector Perform | 2026-02-05 |
| Morgan Stanley | Maintain | Overweight | 2026-02-05 |
| Morgan Stanley | Upgrade | Overweight | 2026-01-26 |
| Oppenheimer | Maintain | Outperform | 2026-01-12 |
| Oppenheimer | Upgrade | Outperform | 2025-12-05 |
| UBS | Maintain | Neutral | 2025-11-06 |
| RBC Capital | Maintain | Sector Perform | 2025-11-06 |
| JP Morgan | Maintain | Overweight | 2025-11-06 |
StoneCo Ltd. Grades
Below are the recent grades from reputable financial firms for StoneCo Ltd.
| Grading Company | Action | New Grade | Date |
|---|---|---|---|
| UBS | Maintain | Buy | 2026-01-28 |
| Goldman Sachs | Maintain | Buy | 2026-01-28 |
| Goldman Sachs | Maintain | Buy | 2025-10-14 |
| B of A Securities | Maintain | Buy | 2025-09-09 |
| UBS | Maintain | Buy | 2025-08-29 |
| JP Morgan | Maintain | Overweight | 2025-07-16 |
| Barclays | Maintain | Equal Weight | 2025-05-12 |
| Barclays | Maintain | Equal Weight | 2025-04-23 |
| Citigroup | Upgrade | Buy | 2025-04-22 |
| Morgan Stanley | Maintain | Underweight | 2025-03-21 |
Which company has the best grades?
StoneCo Ltd. consistently earns “Buy” ratings from multiple top-tier firms, signaling strong institutional confidence. Corpay, Inc. shows a mix of “Overweight,” “Outperform,” and “Neutral” grades, indicating moderate enthusiasm. Investors may interpret StoneCo’s superior grades as a sign of greater analyst conviction, potentially affecting demand and price momentum.
Risks specific to each company
The following categories identify critical pressure points and systemic threats facing Corpay, Inc. and StoneCo Ltd. in the 2026 market environment:
1. Market & Competition
Corpay, Inc.
- Strong global presence in payments, but faces intense competition from fintech giants and emerging startups.
StoneCo Ltd.
- Focused on Brazil’s fintech market, highly competitive with local and international players expanding digital commerce solutions.
2. Capital Structure & Debt
Corpay, Inc.
- High debt-to-equity ratio (2.58) signals financial leverage risk despite decent interest coverage of 4.83.
StoneCo Ltd.
- Moderate debt levels (D/E 1.1) with better interest coverage (5.41), but elevated WACC (10.66%) raises cost concerns.
3. Stock Volatility
Corpay, Inc.
- Beta of 0.808 indicates lower stock volatility, appealing for risk-averse investors.
StoneCo Ltd.
- High beta of 1.794 suggests significant stock price swings, increasing investor risk.
4. Regulatory & Legal
Corpay, Inc.
- Operates internationally, exposed to complex regulatory environments and cross-border compliance risks.
StoneCo Ltd.
- Subject to Brazil’s evolving fintech regulations and political uncertainty, raising compliance costs and operational risks.
5. Supply Chain & Operations
Corpay, Inc.
- Relies on diverse payment infrastructures, but asset turnover ratio (0.17) signals operational inefficiencies.
StoneCo Ltd.
- Faces logistical and technological challenges in scaling digital payment solutions across Brazil’s fragmented market.
6. ESG & Climate Transition
Corpay, Inc.
- No direct dividend yield and moderate ROIC (8.78%) suggest cautious capital allocation amid rising ESG demands.
StoneCo Ltd.
- Lower profitability metrics and higher WACC complicate investments in ESG initiatives and climate transition efforts.
7. Geopolitical Exposure
Corpay, Inc.
- Global footprint exposes it to geopolitical risks, including trade tensions and currency fluctuations.
StoneCo Ltd.
- Concentrated exposure to Brazil increases vulnerability to local political instability and economic volatility.
Which company shows a better risk-adjusted profile?
Corpay’s main risk is its elevated leverage, threatening financial stability despite strong profitability. StoneCo struggles with negative margins and high stock volatility, risking capital erosion. Corpay’s lower beta and favorable credit metrics give it a modest edge in risk-adjusted terms. However, both companies reside in the Altman Z-score distress zone, signaling caution. The recent rise in Corpay’s stock price (+5.7%) versus StoneCo’s volatile trading (+5.5% but higher beta) justifies my concern about StoneCo’s market sensitivity and operational risks.
Final Verdict: Which stock to choose?
Corpay, Inc. (CPAY) excels as a cash-generating machine with a strong return on equity and a solid moat, despite a slight decline in profitability. Its high leverage and tight liquidity are points of vigilance. CPAY fits an aggressive growth portfolio seeking robust operational efficiency.
StoneCo Ltd. (STNE) boasts a strategic moat with a growing ROIC that signals sustainable competitive advantage. It offers a safer balance sheet and better liquidity than CPAY but struggles with profitability and earnings consistency. STNE suits a GARP (Growth at a Reasonable Price) portfolio focused on long-term value creation.
If you prioritize aggressive growth and operational efficiency, Corpay outshines due to its cash flow strength and market momentum. However, if you seek stability with a focus on sustainable profitability improvements, StoneCo offers better risk management and a compelling moat expansion. Both present analytical scenarios that depend on your risk tolerance and investment horizon.
Disclaimer: Investment carries a risk of loss of initial capital. The past performance is not a reliable indicator of future results. Be sure to understand risks before making an investment decision.
Go Further
I encourage you to read the complete analyses of Corpay, Inc. and StoneCo Ltd. to enhance your investment decisions: