Home > Comparison > Technology > PANW vs CPAY
The strategic rivalry between Palo Alto Networks, Inc. and Corpay, Inc. shapes the evolution of the technology sector’s software infrastructure segment. Palo Alto Networks operates as a cybersecurity powerhouse focused on comprehensive threat prevention, while Corpay excels in payment solutions for corporate and consumer markets. This analysis contrasts their operational models and growth vectors to determine which offers superior risk-adjusted returns for a diversified portfolio in 2026.

Table of contents
Companies Overview
Palo Alto Networks and Corpay shape critical infrastructure sectors with distinct market leadership and innovative strategies.
Palo Alto Networks, Inc.: Cybersecurity Infrastructure Leader
Palo Alto Networks dominates the cybersecurity landscape with its firewall appliances and software. Its revenue stems from subscription services like threat prevention and cloud security. In 2026, it focuses on expanding security analytics, automation, and consulting to reinforce enterprise defenses globally.
Corpay, Inc.: Corporate Payments Innovator
Corpay excels in managing vehicle and corporate payments worldwide. The company generates revenue through payment solutions including fuel cards, tolls, cross-border payments, and lodging. In 2026, Corpay targets enhancing accounts payable automation and expanding global payment services for business customers.
Strategic Collision: Similarities & Divergences
Both firms operate in technology-driven infrastructure but diverge sharply. Palo Alto Networks pursues a closed ecosystem emphasizing cybersecurity, while Corpay adopts an open infrastructure model for payments. Their battleground is enterprise efficiency—security versus operational spending. These distinct approaches create unique investment profiles reflecting either defensive resilience or transactional innovation.
Income Statement Comparison
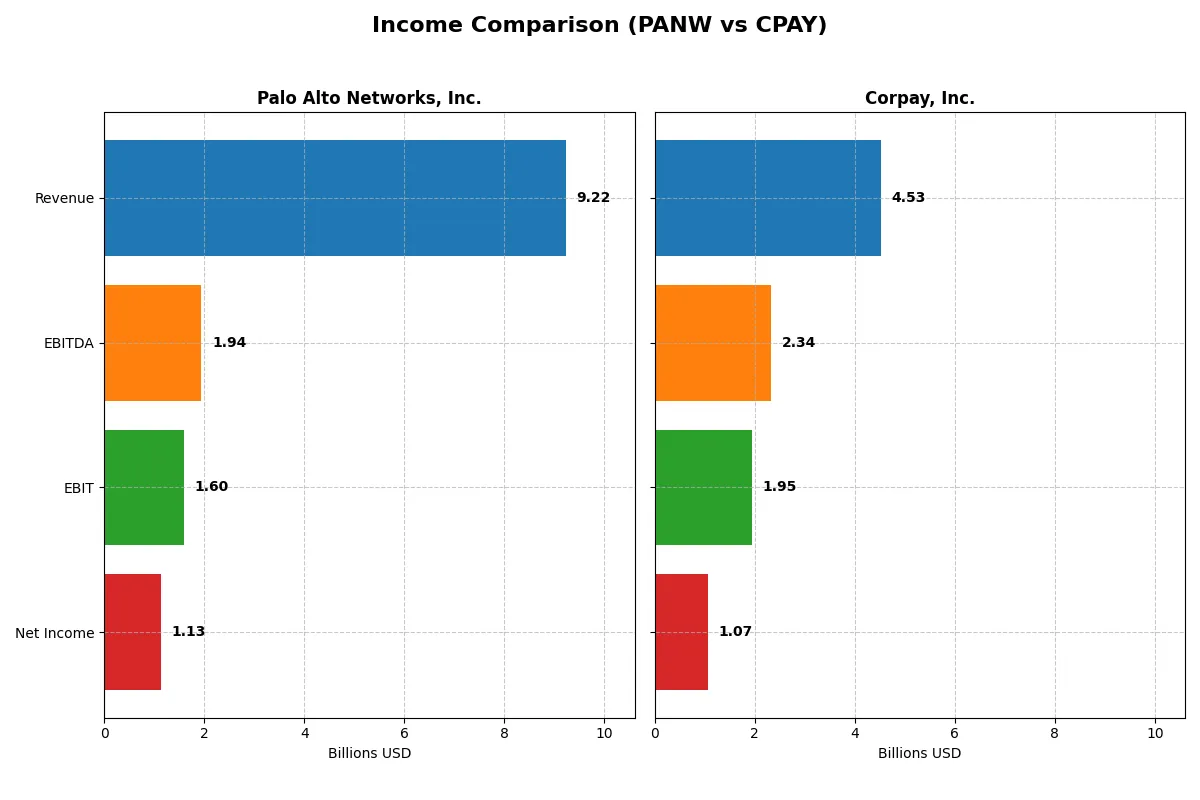
This data dissects the core profitability and scalability of both corporate engines to reveal who dominates the bottom line:
| Metric | Palo Alto Networks, Inc. (PANW) | Corpay, Inc. (CPAY) |
|---|---|---|
| Revenue | 9.22B | 4.53B |
| Cost of Revenue | 2.45B | 1.36B |
| Operating Expenses | 5.53B | 1.21B |
| Gross Profit | 6.77B | 3.17B |
| EBITDA | 1.94B | 2.34B |
| EBIT | 1.60B | 1.95B |
| Interest Expense | 3.0M | 404M |
| Net Income | 1.13B | 1.07B |
| EPS | 1.71 | 15.25 |
| Fiscal Year | 2025 | 2025 |
Income Statement Analysis: The Bottom-Line Duel
This income statement comparison exposes which company converts revenue into profit most efficiently, revealing their true operational strength.
Palo Alto Networks, Inc. Analysis
Palo Alto Networks grew revenue from $4.3B in 2021 to $9.2B in 2025, more than doubling sales. Gross margin remains strong at 73.4%, signaling robust product profitability. However, net margin slipped to 12.3% in 2025 despite a 61% jump in EBIT year-over-year, reflecting margin pressure on the bottom line.
Corpay, Inc. Analysis
Corpay’s revenue rose steadily from $2.8B in 2021 to $4.5B in 2025, with a solid 13.9% growth last year. Its gross margin held close to 70%, while EBIT margin impressively reached 43.1%, showcasing operational efficiency. Though net margin declined slightly to 23.6%, net income still grew 7.6% on an EPS basis.
Margin Power vs. Revenue Scale
Palo Alto Networks leads in revenue scale and has expanded net income over 300% since 2021, but margin erosion last year signals caution. Corpay delivers superior EBIT and net margins, emphasizing profitability over sheer size. For investors, Corpay’s strong margin profile presents a more attractive efficiency-focused growth story.
Financial Ratios Comparison
These vital ratios act as a diagnostic tool to expose the underlying fiscal health, valuation premiums, and capital efficiency of the companies compared below:
| Ratios | Palo Alto Networks, Inc. (PANW) | Corpay, Inc. (CPAY) |
|---|---|---|
| ROE | 14.5% | 27.5% |
| ROIC | 5.7% | 8.8% |
| P/E | 101.4 | 19.7 |
| P/B | 14.7 | 5.4 |
| Current Ratio | 0.89 | 0.98 |
| Quick Ratio | 0.89 | 0.98 |
| D/E | 0.04 | 2.58 |
| Debt-to-Assets | 1.4% | 37.9% |
| Interest Coverage | 414.3 | 4.8 |
| Asset Turnover | 0.39 | 0.17 |
| Fixed Asset Turnover | 12.6 | 9.6 |
| Payout ratio | 0% | 0% |
| Dividend yield | 0% | 0% |
| Fiscal Year | 2025 | 2025 |
Efficiency & Valuation Duel: The Vital Signs
Financial ratios serve as a company’s DNA, exposing operational strengths and hidden risks beneath headline figures.
Palo Alto Networks, Inc.
Palo Alto Networks posts a moderate 14.5% ROE and a solid 12.3% net margin, signaling reasonable profitability. However, its P/E of 101.4 marks the stock as severely stretched versus the S&P 500 average near 20. The absence of dividends suggests reinvestment in high R&D intensity, fueling growth but increasing risk for income-focused investors.
Corpay, Inc.
Corpay delivers a robust 27.5% ROE and a strong 23.6% net margin, reflecting efficient capital use and operational excellence. Its P/E of 19.7 is more reasonable, implying fair valuation. Despite no dividend payout, the firm balances growth with disciplined leverage and moderate interest coverage, supporting sustainable shareholder value expansion.
Premium Valuation vs. Operational Safety
Palo Alto Networks commands a premium valuation driven by growth prospects but faces heightened risk from stretched multiples and weak liquidity. Corpay offers better risk-reward balance with solid profitability at a fairer price and manageable debt. Growth investors may favor Palo Alto’s profile, while those seeking operational safety might lean toward Corpay.
Which one offers the Superior Shareholder Reward?
I observe that both Palo Alto Networks (PANW) and Corpay (CPAY) pay no dividends, focusing entirely on reinvestment and buybacks. PANW delivers free cash flow per share of 5.24 with minimal buyback indications, prioritizing growth and R&D. CPAY generates a robust free cash flow per share of 18.5 and executes more aggressive buybacks, supporting total shareholder return. CPAY’s lower P/E ratio (~20 vs. PANW’s 101) and stronger operating margins indicate better capital allocation efficiency. I conclude CPAY offers a superior total return profile in 2026 due to sustainable buybacks and higher free cash flow reinvested effectively.
Comparative Score Analysis: The Strategic Profile
The radar chart reveals the fundamental DNA and trade-offs of Palo Alto Networks and Corpay, highlighting their distinct financial strengths and risks:
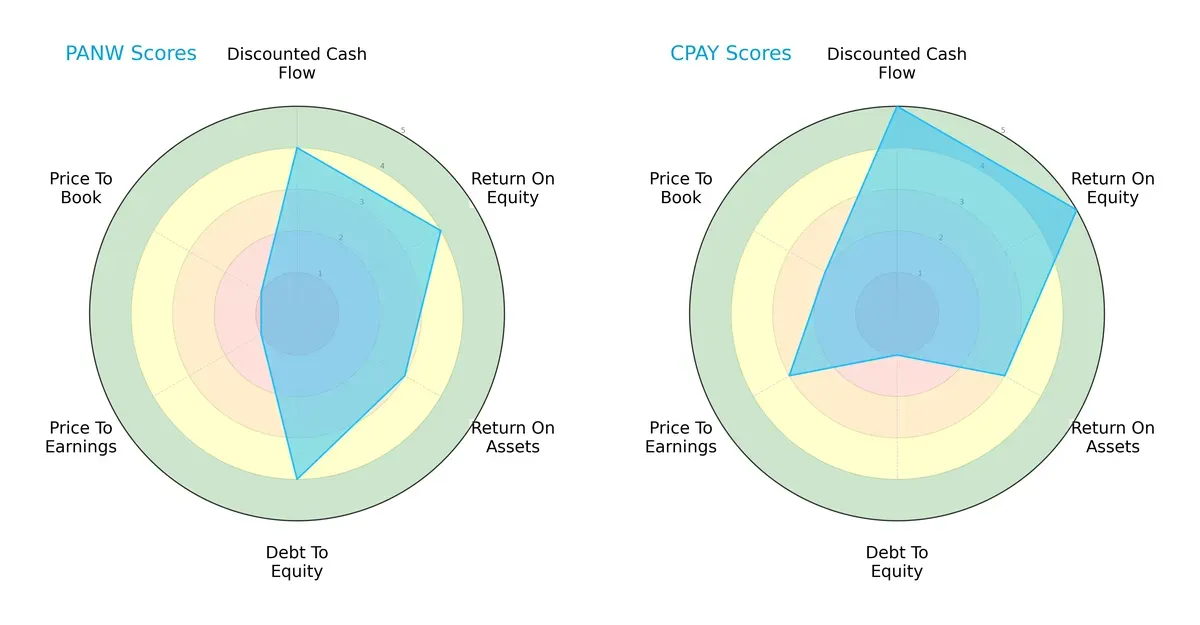
Palo Alto Networks shows balanced strength in discounted cash flow, return on equity, and debt management, but suffers from very unfavorable valuation scores. Corpay excels in cash flow and equity returns but carries heavy debt and moderate valuation. Palo Alto offers a steadier profile, while Corpay relies on its operational efficiency despite financial leverage.
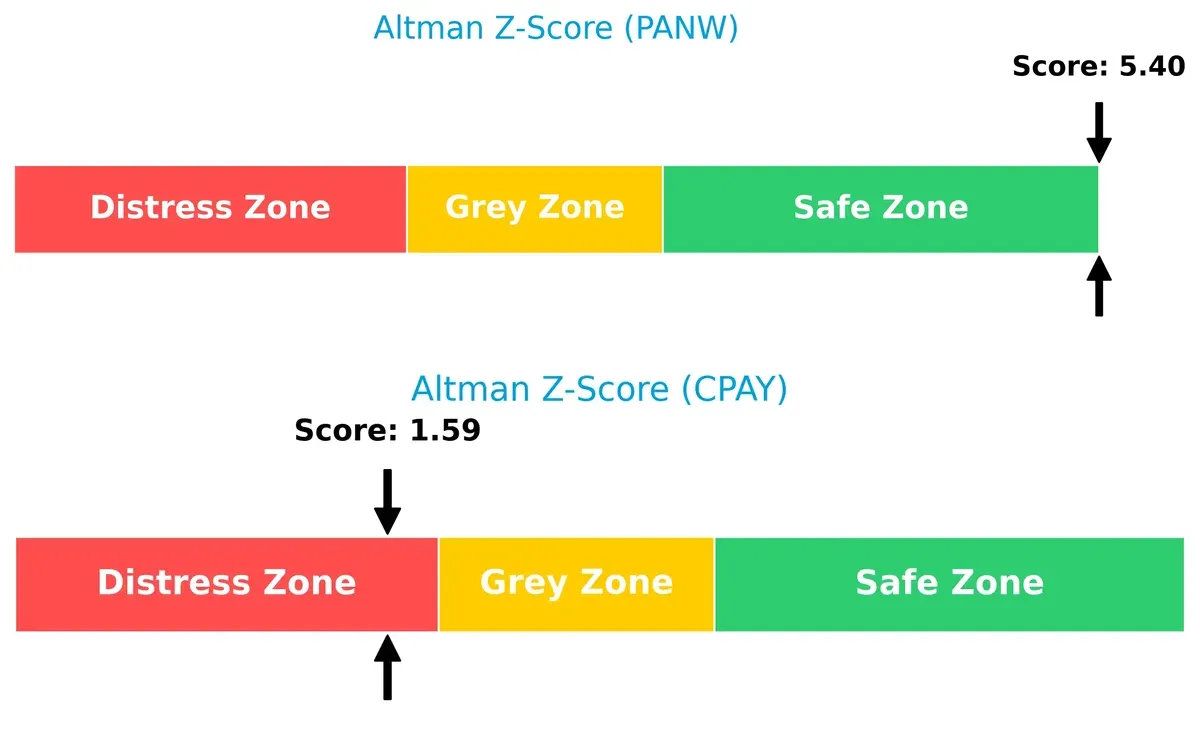
Bankruptcy Risk: Solvency Showdown
The Altman Z-Score gap signals stark differences in bankruptcy risk: Palo Alto Networks is firmly in the safe zone, while Corpay teeters in distress, raising long-term survival concerns:
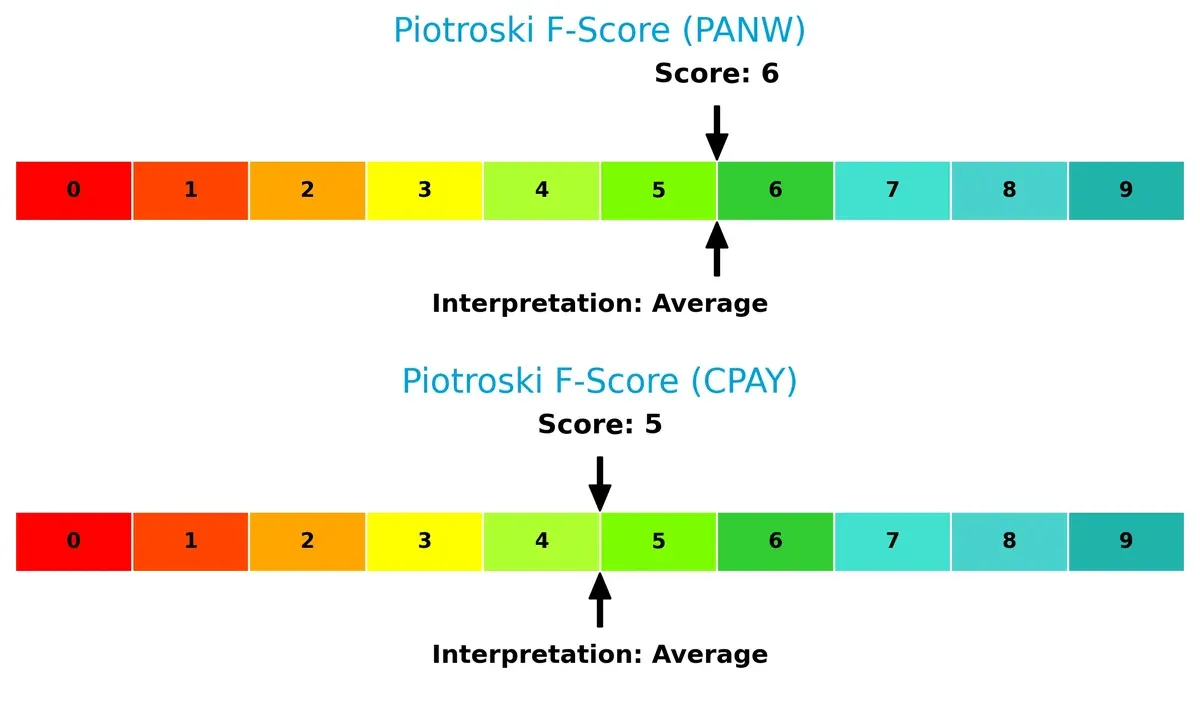
Financial Health: Quality of Operations
Both firms maintain average Piotroski F-Scores, indicating moderate financial health. Palo Alto Networks holds a slight edge, with no glaring red flags compared to Corpay:
How are the two companies positioned?
This section dissects PANW and CPAY’s operational DNA by comparing their revenue distribution by segment and internal dynamics. The goal is to confront their economic moats and identify which model offers the most resilient, sustainable competitive advantage today.
Revenue Segmentation: The Strategic Mix
The following visual comparison dissects how both firms diversify their income streams and where their primary sector bets lie:
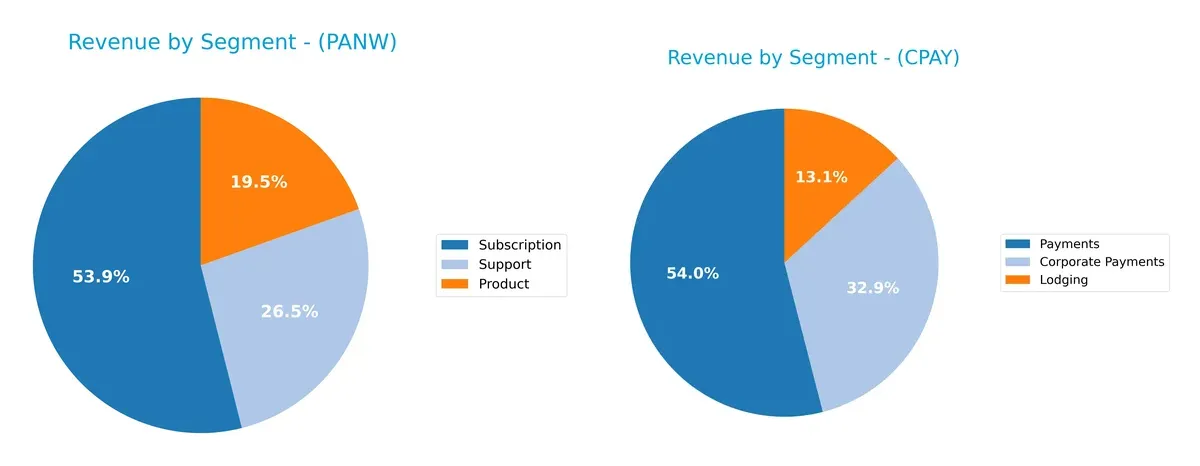
Palo Alto Networks anchors its revenue in Subscriptions at $4.97B, with significant Support ($2.45B) and Product sales ($1.80B), showing a balanced yet subscription-heavy model. Corpay leans heavily on Payments totaling $2.01B, dwarfing Corporate Payments ($1.22B) and Lodging ($489M). Palo Alto’s diversified streams reduce concentration risk, while Corpay’s reliance on Payments signals exposure to transaction volume cycles and competitive pressure.
Strengths and Weaknesses Comparison
This table compares the strengths and weaknesses of Palo Alto Networks and Corpay based on diversification, profitability, financials, innovation, global presence, and market share:
Palo Alto Networks Strengths
- Diverse revenue streams across product, subscription, and support
- Favorable net margin of 12.3%
- Very low debt-to-equity at 0.04
- Strong interest coverage at 533
- Global presence in Americas, EMEA, Asia Pacific
Corpay Strengths
- Superior net margin of 23.6%
- High return on equity at 27.6%
- Favorable WACC of 6.26%
- Large U.S. market share with $2.08B revenue
- Significant presence in Brazil and UK
Palo Alto Networks Weaknesses
- Unfavorable PE of 101.4 and PB of 14.7
- Current ratio below 1 at 0.89
- Asset turnover low at 0.39
- No dividend yield
- ROIC below WACC at 5.67% vs 7.29%
- Exposure concentrated in Americas
Corpay Weaknesses
- Elevated debt-to-equity at 2.58
- Current ratio below 1 at 0.98
- Low asset turnover of 0.17
- Interest coverage moderate at 4.83
- PB ratio unfavorable at 5.43
- No dividend yield
Palo Alto Networks excels in diversification and conservative leverage with strong global reach, but its valuation and liquidity ratios raise concerns. Corpay shows robust profitability and focus on key markets, yet carries higher debt and operational efficiency challenges. Both face risks related to low current ratios and absence of dividend income, suggesting cautious capital management is essential.
The Moat Duel: Analyzing Competitive Defensibility
A structural moat is the only reliable shield protecting long-term profits from relentless competitive erosion. Let’s dissect how these two firms defend their turf:
Palo Alto Networks, Inc.: Intangible Assets and Innovation Powerhouse
Palo Alto leverages strong intangible assets like proprietary cybersecurity tech and brand reputation. Its high ROIC growth signals deepening operational efficiency despite current value destruction. New cloud security products could fortify its moat further in 2026.
Corpay, Inc.: Cost Advantage and Payment Network Efficiency
Corpay’s moat stems from cost advantages and large payment network scale, driving consistent value creation with ROIC above WACC. However, its declining ROIC trend warns of margin pressure. Expansion in cross-border payment solutions offers growth potential.
Verdict: Innovation Edge vs. Payment Scale Efficiency
While Palo Alto’s innovation-based moat shows accelerating profitability, Corpay’s cost-driven moat currently creates more value but faces margin risks. Palo Alto Networks is better positioned to defend and expand its market share long term.
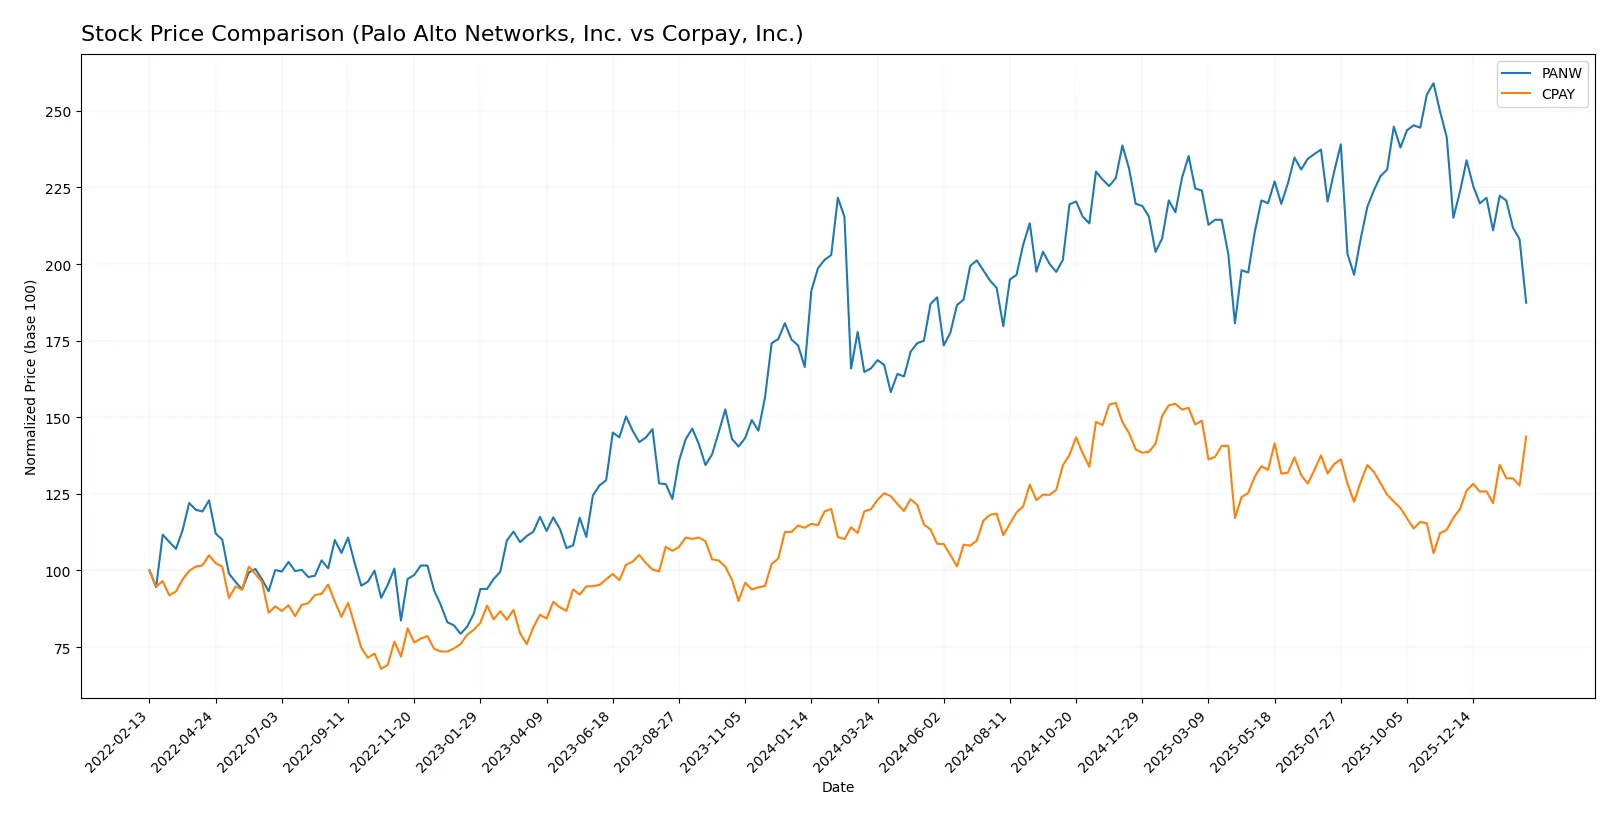
Which stock offers better returns?
The past year shows distinct price movements for Palo Alto Networks and Corpay, with PANW’s upward momentum slowing while CPAY gains accelerating sharply.
Trend Comparison
Palo Alto Networks’ stock rose 12.93% over the past 12 months, reflecting a bullish trend with decelerating gains. The price ranged from 134.51 to 220.24, showing moderate volatility.
Corpay’s stock gained 19.8% in the same period, marking a bullish trend with accelerating growth. Its price fluctuated between 249.66 and 381.18, accompanied by higher volatility than PANW.
Comparing the two, Corpay outperformed Palo Alto Networks with stronger returns and momentum, delivering the highest market performance over the last year.
Target Prices
Analysts present a confident target price consensus for Palo Alto Networks and Corpay, reflecting solid upside potential.
| Company | Target Low | Target High | Consensus |
|---|---|---|---|
| Palo Alto Networks, Inc. | 157 | 265 | 231.07 |
| Corpay, Inc. | 300 | 390 | 359.33 |
The consensus target prices for both stocks significantly exceed their current market prices, suggesting bullish analyst sentiment and room for growth. Palo Alto Networks trades near its low target, while Corpay is close to the consensus, indicating varied valuation dynamics.

Don’t Let Luck Decide Your Entry Point
Optimize your entry points with our advanced ProRealTime indicators. You’ll get efficient buy signals with precise price targets for maximum performance. Start outperforming now!
How do institutions grade them?
Palo Alto Networks, Inc. Grades
Here are the latest institutional grades for Palo Alto Networks, Inc.:
| Grading Company | Action | New Grade | Date |
|---|---|---|---|
| Needham | Maintain | Buy | 2026-01-28 |
| UBS | Maintain | Neutral | 2026-01-13 |
| Piper Sandler | Maintain | Overweight | 2026-01-05 |
| Guggenheim | Upgrade | Neutral | 2026-01-05 |
| Morgan Stanley | Maintain | Overweight | 2025-12-18 |
| HSBC | Downgrade | Reduce | 2025-11-21 |
| Goldman Sachs | Maintain | Buy | 2025-11-21 |
| Rosenblatt | Maintain | Buy | 2025-11-20 |
| Oppenheimer | Maintain | Outperform | 2025-11-20 |
| BTIG | Maintain | Buy | 2025-11-20 |
Corpay, Inc. Grades
Here are the latest institutional grades for Corpay, Inc.:
| Grading Company | Action | New Grade | Date |
|---|---|---|---|
| Mizuho | Maintain | Neutral | 2026-02-06 |
| JP Morgan | Maintain | Overweight | 2026-02-05 |
| RBC Capital | Maintain | Sector Perform | 2026-02-05 |
| Morgan Stanley | Maintain | Overweight | 2026-02-05 |
| Morgan Stanley | Upgrade | Overweight | 2026-01-26 |
| Oppenheimer | Maintain | Outperform | 2026-01-12 |
| Oppenheimer | Upgrade | Outperform | 2025-12-05 |
| UBS | Maintain | Neutral | 2025-11-06 |
| RBC Capital | Maintain | Sector Perform | 2025-11-06 |
| JP Morgan | Maintain | Overweight | 2025-11-06 |
Which company has the best grades?
Palo Alto Networks shows stronger buy-side support, with multiple Buy and Outperform ratings. Corpay’s ratings lean more toward Overweight and Sector Perform. Investors may view Palo Alto Networks as having more bullish analyst sentiment.
Risks specific to each company
The following categories identify the critical pressure points and systemic threats facing both firms in the 2026 market environment:
1. Market & Competition
Palo Alto Networks, Inc. (PANW)
- Faces intense competition in cybersecurity with rapid innovation demands.
Corpay, Inc. (CPAY)
- Operates in a competitive payments space with evolving fintech entrants.
2. Capital Structure & Debt
Palo Alto Networks, Inc. (PANW)
- Maintains very low debt levels; strong interest coverage at 532.5x.
Corpay, Inc. (CPAY)
- Higher debt-to-equity ratio at 2.58 raises financial risk concerns.
3. Stock Volatility
Palo Alto Networks, Inc. (PANW)
- Lower beta at 0.75 indicates moderate volatility versus market.
Corpay, Inc. (CPAY)
- Slightly higher beta at 0.81 suggests marginally elevated volatility.
4. Regulatory & Legal
Palo Alto Networks, Inc. (PANW)
- Must navigate complex cybersecurity regulations globally.
Corpay, Inc. (CPAY)
- Faces regulatory scrutiny in multiple jurisdictions for payment processing.
5. Supply Chain & Operations
Palo Alto Networks, Inc. (PANW)
- Relies on software delivery and cloud infrastructure stability.
Corpay, Inc. (CPAY)
- Dependent on robust payment networks and cross-border operational efficiency.
6. ESG & Climate Transition
Palo Alto Networks, Inc. (PANW)
- Increasing pressure to ensure data privacy and sustainable tech practices.
Corpay, Inc. (CPAY)
- Must address environmental impact of fleet and travel-related payment services.
7. Geopolitical Exposure
Palo Alto Networks, Inc. (PANW)
- Global cybersecurity tensions could both create risks and opportunities.
Corpay, Inc. (CPAY)
- Exposure to international markets introduces currency and geopolitical risks.
Which company shows a better risk-adjusted profile?
Palo Alto Networks faces its greatest risk in market competition and innovation pressures but benefits from a fortress balance sheet and low leverage. Corpay’s most impactful risk lies in its high debt burden, which elevates financial vulnerability despite strong profitability. Given Palo Alto’s Altman Z-Score in the safe zone (5.4) versus Corpay’s distress zone (1.6), I see Palo Alto Networks as having a superior risk-adjusted profile. The stark contrast in debt-to-equity ratios (0.04 vs 2.58) justifies my caution on Corpay’s financial stability.
Final Verdict: Which stock to choose?
Palo Alto Networks excels as a cybersecurity powerhouse with a robust growth trajectory and strong cash flow generation. Its point of vigilance remains the suboptimal liquidity position, which could pressure short-term operations. It fits best within an aggressive growth portfolio willing to tolerate operational tightness for long-term innovation payoff.
Corpay’s strategic moat lies in its steady recurring revenue model and efficient capital deployment, creating consistent value despite a heavier debt load than Palo Alto Networks. It presents a safer profile, appealing to investors favoring stability blended with growth, making it suitable for GARP (Growth at a Reasonable Price) investors.
If you prioritize rapid innovation and expanding market share, Palo Alto Networks is the compelling choice due to its accelerating profitability and strong R&D investment. However, if you seek a more balanced risk-reward profile with solid cash flow and a durable revenue base, Corpay offers better stability and value creation despite a slightly declining ROIC trend.
Disclaimer: Investment carries a risk of loss of initial capital. The past performance is not a reliable indicator of future results. Be sure to understand risks before making an investment decision.
Go Further
I encourage you to read the complete analyses of Palo Alto Networks, Inc. and Corpay, Inc. to enhance your investment decisions: