Home > Comparison > Technology > PLTR vs CPAY
The strategic rivalry between Palantir Technologies Inc. and Corpay, Inc. shapes the evolving landscape of software infrastructure. Palantir operates as a data analytics powerhouse specializing in intelligence and operational software, while Corpay leads in payment solutions for corporate and consumer expenses. This analysis explores their contrasting models—data-centric innovation versus financial transaction efficiency—to identify which company offers a superior risk-adjusted return for diversified technology portfolios.

Table of contents
Companies Overview
Palantir Technologies Inc. and Corpay, Inc. anchor key niches within the software infrastructure sector in 2026.
Palantir Technologies Inc.: Data-Driven Intelligence Software Leader
Palantir dominates with its software platforms that empower intelligence agencies to analyze complex datasets for counterterrorism and operational decision-making. Its revenue stems primarily from government and commercial licenses of Palantir Gotham, Foundry, and Apollo. In 2026, the company sharpens its focus on integrating AI through its Palantir Artificial Intelligence Platform to enhance data-driven actions.
Corpay, Inc.: Corporate Payment Solutions Specialist
Corpay drives growth by offering comprehensive payment solutions for vehicle expenses, corporate payments, and lodging across multiple countries. Its core revenue comes from vehicle payment products and accounts payable automation services. In 2026, Corpay emphasizes expanding cross-border payment capabilities and enhancing virtual card offerings to streamline business expense management globally.
Strategic Collision: Similarities & Divergences
Both companies operate in software infrastructure but diverge sharply in business philosophy. Palantir embraces a closed, intelligence-focused ecosystem leveraging AI for data insights. Corpay pursues an open, transactional infrastructure aimed at optimizing payments and expense workflows. Their market battle centers on enterprise adoption of software solutions, yet their distinct focuses produce contrasting investment profiles—one rooted in data analytics innovation, the other in fintech payment facilitation.
Income Statement Comparison
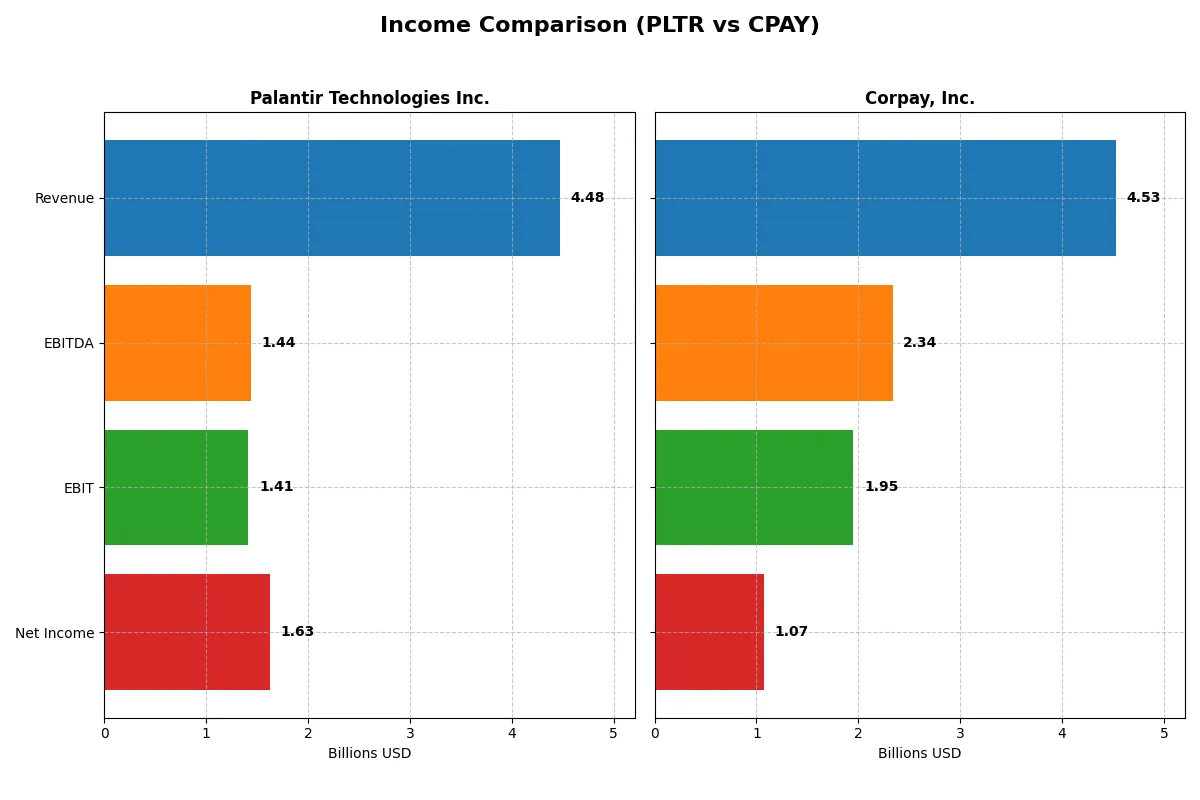
The following data dissects the core profitability and scalability of both corporate engines to reveal who dominates the bottom line:
| Metric | Palantir Technologies Inc. (PLTR) | Corpay, Inc. (CPAY) |
|---|---|---|
| Revenue | 4.48B | 4.53B |
| Cost of Revenue | 789M | 1.36B |
| Operating Expenses | 2.27B | 1.21B |
| Gross Profit | 3.69B | 3.17B |
| EBITDA | 1.44B | 2.34B |
| EBIT | 1.41B | 1.95B |
| Interest Expense | 0 | 404M |
| Net Income | 1.63B | 1.07B |
| EPS | 0.69 | 15.25 |
| Fiscal Year | 2025 | 2025 |
Income Statement Analysis: The Bottom-Line Duel
This income statement comparison reveals which company operates with superior efficiency and profit momentum in their financial engines.
Palantir Technologies Inc. Analysis
Palantir’s revenue surged from 1.54B in 2021 to 4.48B in 2025, with net income climbing sharply from a -520M loss to 1.63B profit. Gross margin stands impressively high at 82.4%, while net margin reaches 36.3%, reflecting exceptional cost control. The 2025 performance showcases powerful earnings growth and expanding profitability.
Corpay, Inc. Analysis
Corpay’s revenue grew steadily from 2.83B in 2021 to 4.53B in 2025. Net income increased from 839M to 1.07B, though net margin declined to 23.6%. Gross margin is solid at 69.9%, and EBIT margin outperforms Palantir at 43.1%. However, net margin deterioration signals pressure on bottom-line efficiency despite consistent revenue gains.
Margin Dominance vs. Growth Momentum
Palantir excels with superior margin expansion and explosive net income growth, demonstrating operational leverage and efficient capital allocation. Corpay shows steadier revenue growth and stronger EBIT margin but suffers from margin compression at net income level. For investors, Palantir’s profile appeals more due to its dynamic profitability and margin improvement trajectory.
Financial Ratios Comparison
These vital ratios act as a diagnostic tool to expose the underlying fiscal health, valuation premiums, and capital efficiency of the companies compared here:
| Ratios | Palantir Technologies Inc. (PLTR) | Corpay, Inc. (CPAY) |
|---|---|---|
| ROE | 22.0% | 27.5% |
| ROIC | 17.9% | 8.8% |
| P/E | 259.2x | 19.7x |
| P/B | 57.0x | 5.4x |
| Current Ratio | 7.1 | 1.0 |
| Quick Ratio | 7.1 | 1.0 |
| D/E | 0.03 | 2.58 |
| Debt-to-Assets | 2.6% | 37.9% |
| Interest Coverage | 0 (not applicable) | 4.8x |
| Asset Turnover | 0.50 | 0.17 |
| Fixed Asset Turnover | 17.8 | 9.6 |
| Payout Ratio | 0% | 0% |
| Dividend Yield | 0% | 0% |
| Fiscal Year | 2025 | 2025 |
Efficiency & Valuation Duel: The Vital Signs
Financial ratios form the DNA of a company, exposing hidden risks and operational strengths critical for investment decisions.
Palantir Technologies Inc.
Palantir delivers robust profitability with a 22% ROE and a strong 36.31% net margin, signaling operational efficiency. However, its valuation is stretched, with a sky-high P/E of 259 and a P/B of 57, reflecting elevated market expectations. It returns no dividends, reinvesting heavily in R&D to fuel growth.
Corpay, Inc.
Corpay posts a solid 27.55% ROE and a 23.62% net margin, indicating strong profitability. Its valuation is reasonable with a P/E near 20 but a weak P/B at 5.43. The current ratio below 1 flags liquidity concerns. Like Palantir, Corpay pays no dividend, focusing on growth investments instead.
Premium Valuation vs. Operational Safety
Palantir boasts superior profitability but trades at a demanding premium, increasing risk. Corpay offers a more balanced valuation but shows liquidity and leverage weaknesses. Investors seeking growth with caution may prefer Corpay’s profile, while risk-tolerant growth seekers might lean toward Palantir’s aggressive expansion.
Which one offers the Superior Shareholder Reward?
Palantir Technologies Inc. (PLTR) and Corpay, Inc. (CPAY) both forego dividends, focusing on share repurchases and reinvestment. PLTR’s zero dividend yield contrasts with CPAY’s similar stance. PLTR boasts a pristine balance sheet, with negligible debt and a sky-high current ratio of 7.1, signaling liquidity strength. CPAY carries heavy leverage (debt-to-equity above 2.5) and a current ratio below 1, raising caution. PLTR’s buybacks appear limited but sustainable, supported by a near 1x free cash flow to operating cash flow ratio. CPAY’s free cash flow yield is more attractive at a price-to-free cash flow of ~16x, yet its high leverage and modest cash ratio risk long-term sustainability. I judge PLTR’s conservative capital allocation and liquidity superiority as the foundation for more reliable shareholder rewards in 2026.
Comparative Score Analysis: The Strategic Profile
The radar chart reveals the fundamental DNA and trade-offs of Palantir Technologies Inc. and Corpay, Inc., highlighting their financial strengths and weaknesses:
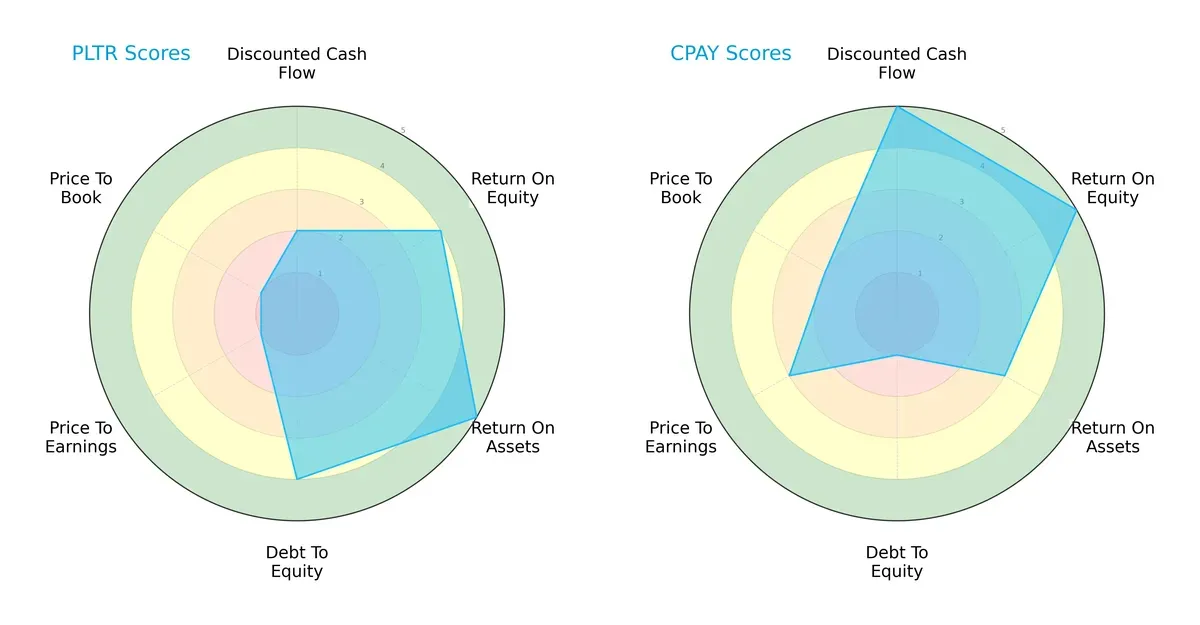
Palantir excels in asset efficiency (ROA 5) and maintains a strong balance sheet (Debt/Equity 4), but struggles with valuation metrics (P/E and P/B scores of 1). Corpay leads in discounted cash flow (DCF 5) and return on equity (ROE 5), yet carries higher financial risk with a weak debt profile (Debt/Equity 1). Palantir presents a more balanced profile, while Corpay relies heavily on cash flow strength but bears debt concerns.
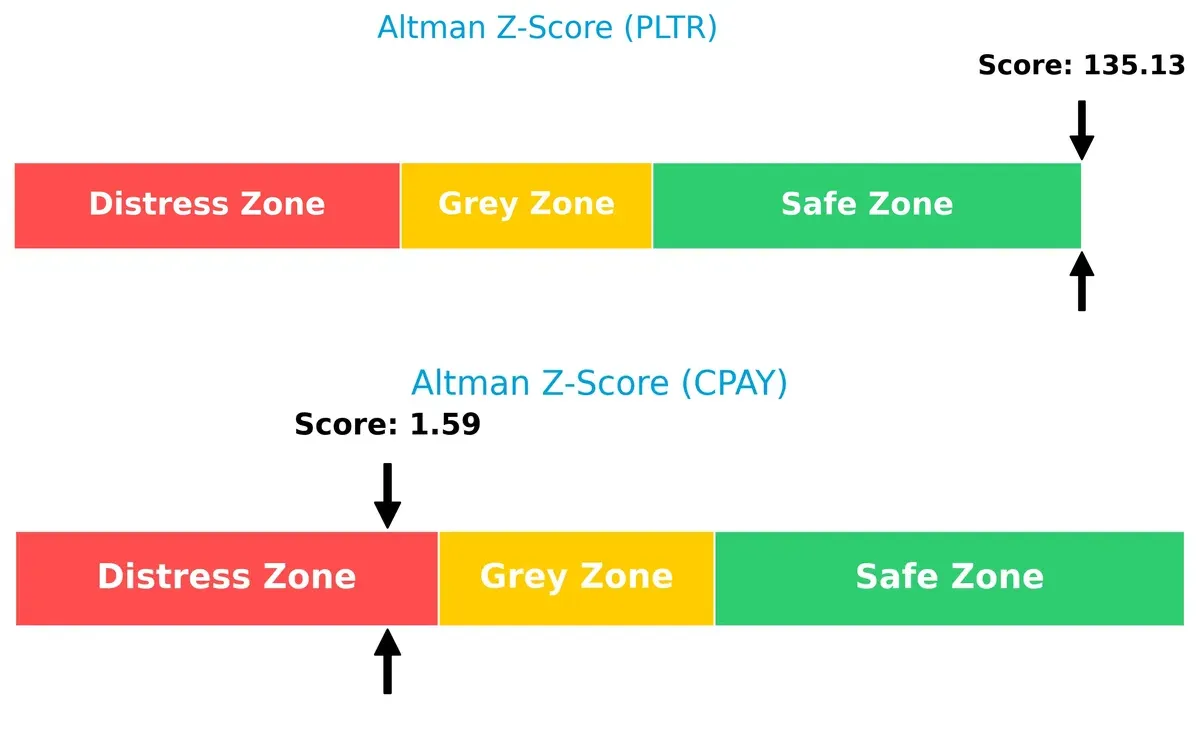
Bankruptcy Risk: Solvency Showdown
Palantir’s Altman Z-Score of 135 places it deep in the safe zone, contrasting sharply with Corpay’s distress zone score of 1.6, signaling potential solvency risks for Corpay in this cycle:
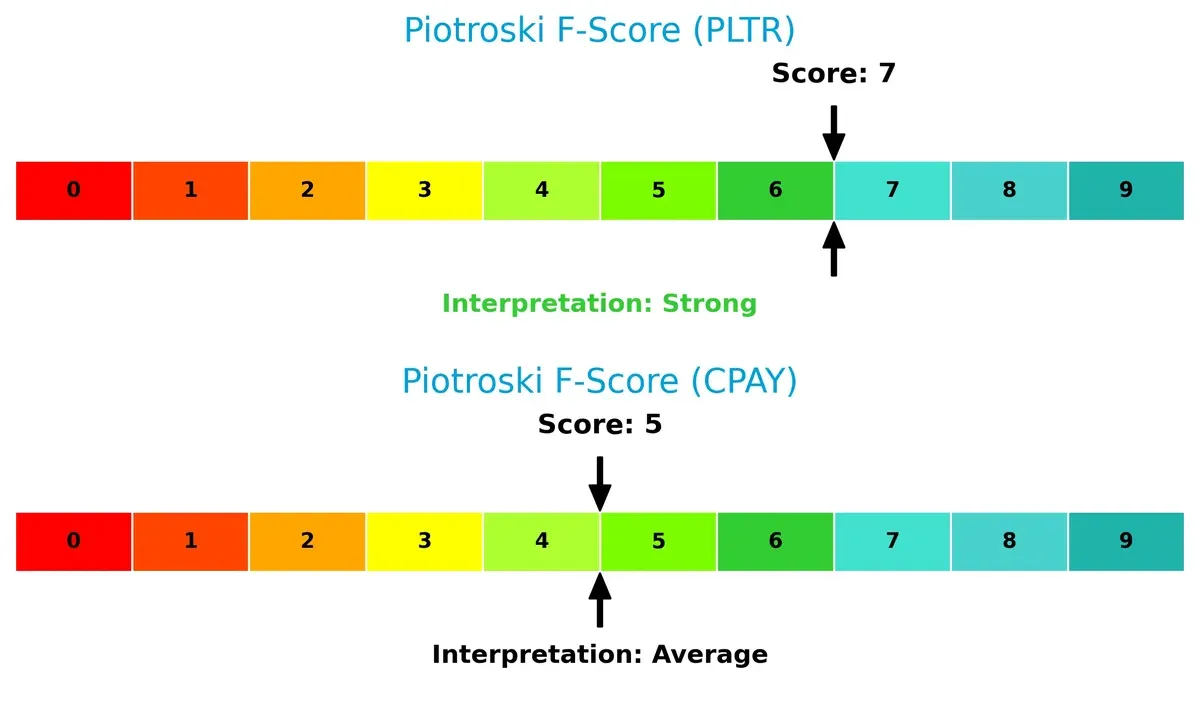
Financial Health: Quality of Operations
Palantir’s Piotroski F-Score of 7 indicates strong financial health, outperforming Corpay’s average score of 5. Corpay’s lower score flags possible internal weaknesses and operational risks:
How are the two companies positioned?
This section dissects the operational DNA of Palantir and Corpay by comparing their revenue distribution and internal dynamics. The goal is to confront their economic moats to reveal which model offers a more resilient, sustainable advantage today.
Revenue Segmentation: The Strategic Mix
This visual comparison dissects how Palantir Technologies Inc. and Corpay, Inc. diversify their income streams and where their primary sector bets lie:
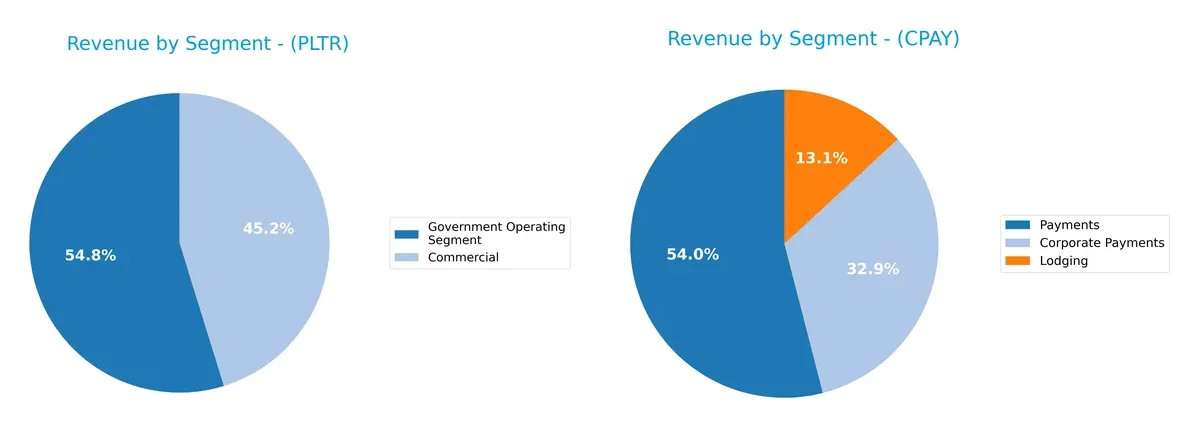
Palantir anchors its revenue in two key segments: Government ($1.57B) and Commercial ($1.30B) in 2024, showing a balanced but government-skewed mix. Corpay’s revenue pivots heavily on Payments ($2.01B), with Corporate Payments ($1.22B) and Lodging ($489M) trailing, indicating concentration risk but strong sector focus. Palantir’s diversification mitigates volatility, while Corpay leverages scale in payments infrastructure.
Strengths and Weaknesses Comparison
This table compares the Strengths and Weaknesses of Palantir Technologies Inc. and Corpay, Inc.:
Palantir Strengths
- Strong net margin at 36.31%
- High ROE of 22%
- Favorable ROIC of 17.95%
- Low debt-to-assets at 2.58%
- Diverse revenue from government and commercial sectors
- Growing global presence with significant US and UK sales
Corpay Strengths
- Solid ROE of 27.55%
- Favorable WACC at 6.26%
- Large revenue base with diversified payments and lodging segments
- Strong US revenue of 2.08B
- Favorable fixed asset turnover of 9.59
- Moderate PE ratio of 19.73
Palantir Weaknesses
- High PE of 259.19 signals overvaluation risk
- Unfavorable price-to-book at 57.02
- Very high current ratio of 7.11 indicates inefficient asset use
- WACC at 11.72% higher than ROE
- Zero dividend yield
- Moderate asset turnover at 0.5
Corpay Weaknesses
- Low current ratio of 0.98 indicates liquidity risk
- High debt-to-equity of 2.58 raises leverage concerns
- Unfavorable asset turnover at 0.17
- Neutral interest coverage at 4.83
- Unfavorable price-to-book at 5.43
- Zero dividend yield
Palantir demonstrates strong profitability and a conservative balance sheet but faces valuation and capital efficiency concerns. Corpay shows robust returns and diversified revenue but carries liquidity and leverage risks. Both firms reflect distinct strategic focuses demanding cautious financial scrutiny.
The Moat Duel: Analyzing Competitive Defensibility
A structural moat is the only shield protecting long-term profits from relentless competition erosion. Let’s dissect how each firm defends its turf:
Palantir Technologies Inc.: Data Network Effects Powerhouse
Palantir’s moat hinges on network effects and intangible assets, reflected in its soaring 36% net margin and expanding ROIC. Its integrated AI platform deepens this advantage in 2026.
Corpay, Inc.: Payment Network and Scale Advantage
Corpay leverages scale and payment network effects but faces declining ROIC, unlike Palantir. Its broad geographic footprint offers growth potential, yet profitability pressures persist into 2026.
Network Effects vs. Scale: Who Holds the Deeper Moat?
Palantir commands a wider, more durable moat with accelerating ROIC and margin expansion. Corpay creates value but struggles with profitability erosion. Palantir is better positioned to defend market share long term.
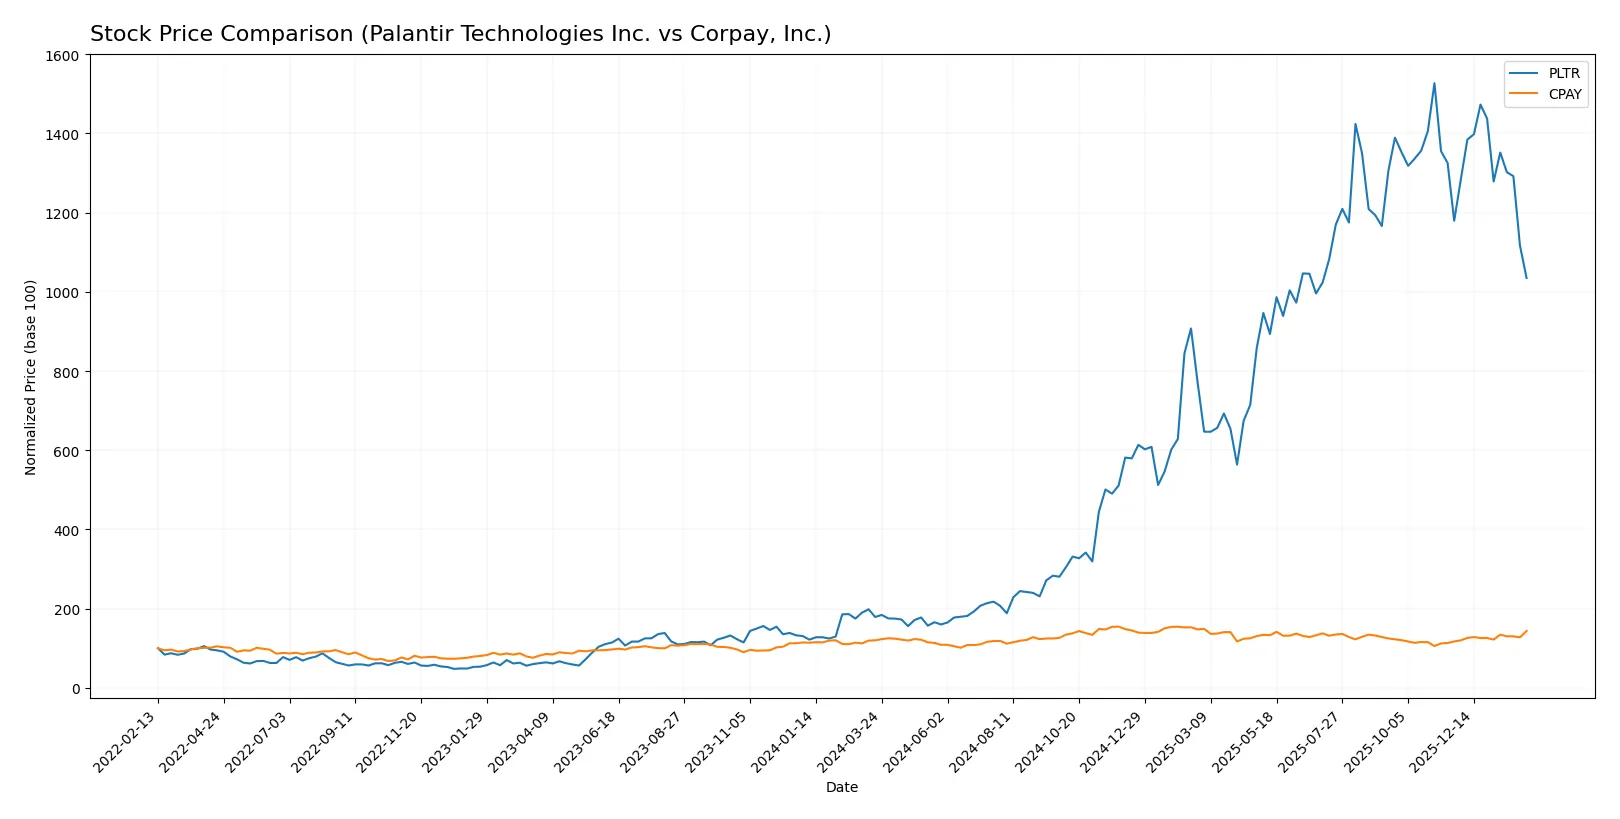
Which stock offers better returns?
Over the past 12 months, Palantir Technologies Inc. showed a strong price surge with notable highs and a slowing upward momentum, while Corpay, Inc. displayed steady gains with accelerating growth and improving recent dynamics.
Trend Comparison
Palantir’s stock rose 478.54% over the last year, marking a clear bullish trend despite decelerating gains and a recent 12.24% decline. Its volatility remains high with a 59.53 standard deviation.
Corpay’s stock gained 19.8% in the same period, reflecting a bullish trend with accelerating momentum. Recent growth accelerated 22.63%, supported by moderate volatility at a 31.25 standard deviation.
Palantir delivered the highest market performance with a substantially larger total gain despite recent weakness, outperforming Corpay’s steadier but smaller price increase.
Target Prices
Analysts present a bullish consensus for both Palantir Technologies Inc. and Corpay, Inc., signaling upside potential from current levels.
| Company | Target Low | Target High | Consensus |
|---|---|---|---|
| Palantir Technologies Inc. | 180 | 230 | 200.15 |
| Corpay, Inc. | 300 | 390 | 359.33 |
The target consensus for Palantir stands 47% above its current price of 135.9, reflecting strong growth expectations. Corpay’s consensus price of 359.33 slightly exceeds its last price of 354.19, indicating moderate upside potential.

Don’t Let Luck Decide Your Entry Point
Optimize your entry points with our advanced ProRealTime indicators. You’ll get efficient buy signals with precise price targets for maximum performance. Start outperforming now!
How do institutions grade them?
Here are the institutional grades for Palantir Technologies Inc. and Corpay, Inc.:
Palantir Technologies Inc. Grades
This table summarizes recent analyst grades from major financial institutions for Palantir:
| Grading Company | Action | New Grade | Date |
|---|---|---|---|
| UBS | Maintain | Neutral | 2026-02-03 |
| Citigroup | Maintain | Buy | 2026-02-03 |
| DA Davidson | Maintain | Neutral | 2026-02-03 |
| Citigroup | Upgrade | Buy | 2026-01-12 |
| DA Davidson | Maintain | Neutral | 2025-11-04 |
| RBC Capital | Maintain | Underperform | 2025-11-04 |
| Baird | Maintain | Neutral | 2025-11-04 |
| Goldman Sachs | Maintain | Neutral | 2025-11-04 |
| Mizuho | Maintain | Neutral | 2025-11-04 |
| Morgan Stanley | Maintain | Equal Weight | 2025-11-04 |
Corpay, Inc. Grades
This table summarizes recent analyst grades from major financial institutions for Corpay:
| Grading Company | Action | New Grade | Date |
|---|---|---|---|
| Mizuho | Maintain | Neutral | 2026-02-06 |
| JP Morgan | Maintain | Overweight | 2026-02-05 |
| RBC Capital | Maintain | Sector Perform | 2026-02-05 |
| Morgan Stanley | Maintain | Overweight | 2026-02-05 |
| Morgan Stanley | Upgrade | Overweight | 2026-01-26 |
| Oppenheimer | Maintain | Outperform | 2026-01-12 |
| Oppenheimer | Upgrade | Outperform | 2025-12-05 |
| UBS | Maintain | Neutral | 2025-11-06 |
| RBC Capital | Maintain | Sector Perform | 2025-11-06 |
| JP Morgan | Maintain | Overweight | 2025-11-06 |
Which company has the best grades?
Corpay has received stronger and more consistent buy-side ratings, including multiple Overweight and Outperform grades. Palantir’s grades cluster mostly around Neutral, with a notable Underperform from RBC. Investors may see Corpay as the more favored stock by analysts currently.
Risks specific to each company
The following categories identify the critical pressure points and systemic threats facing both firms in the 2026 market environment:
1. Market & Competition
Palantir Technologies Inc.
- Operates in a competitive software infrastructure market with high innovation demands and rapid tech evolution.
Corpay, Inc.
- Faces intense competition in payments and corporate expense management, with pressure from fintech disruptors and traditional banks.
2. Capital Structure & Debt
Palantir Technologies Inc.
- Very low debt-to-equity (0.03), signaling strong balance sheet and low financial risk.
Corpay, Inc.
- High debt-to-equity (2.58) raises concerns about leverage and financial stability.
3. Stock Volatility
Palantir Technologies Inc.
- High beta (1.687) indicates greater share price volatility and sensitivity to market swings.
Corpay, Inc.
- Low beta (0.808) suggests more stable stock price behavior relative to the market.
4. Regulatory & Legal
Palantir Technologies Inc.
- Subject to strict data privacy and government contract regulations, posing compliance risks.
Corpay, Inc.
- Faces regulatory scrutiny in payments, cross-border transactions, and consumer protection frameworks.
5. Supply Chain & Operations
Palantir Technologies Inc.
- Relies on software development and deployment efficiency; operational risks tied to platform scalability.
Corpay, Inc.
- Dependent on vendor networks and payment infrastructure; operational disruptions can affect service delivery.
6. ESG & Climate Transition
Palantir Technologies Inc.
- Increasing pressure to integrate ESG in data analytics and AI ethics; reputational risks.
Corpay, Inc.
- Exposure to climate transition risks through fuel and transportation payment services.
7. Geopolitical Exposure
Palantir Technologies Inc.
- Significant exposure to U.S., U.K., and international intelligence operations, sensitive to geopolitical shifts.
Corpay, Inc.
- Operates globally with exposure to currency fluctuations and geopolitical trade tensions.
Which company shows a better risk-adjusted profile?
Palantir’s greatest risk lies in market volatility and regulatory complexity tied to government contracts. Corpay’s highest risk emerges from its elevated leverage and operational dependencies in a competitive payments industry. Palantir’s ultra-low debt and strong profitability provide a more resilient risk-adjusted profile despite volatility. Corpay’s distress-zone Altman Z-score and high debt-to-equity ratio flag material financial risk. Palantir’s 7.11 current ratio contrasts sharply with Corpay’s sub-1.0 ratio, reinforcing Palantir’s superior liquidity buffer.
Final Verdict: Which stock to choose?
Palantir Technologies Inc. wields unmatched efficiency in converting invested capital into growing profits, showcasing a very favorable moat with expanding returns. Its high valuation demands vigilance, as price multiples could compress. This stock fits best within aggressive growth portfolios seeking market leadership with scaling power.
Corpay, Inc. benefits from a strategic moat grounded in steady cash flow and recurring revenue streams, offering better stability than Palantir. Despite a slightly unfavorable leverage profile, its reasonable valuation and solid equity returns suit growth-at-a-reasonable-price (GARP) investors who favor lower volatility and consistent income.
If you prioritize rapid value creation and are comfortable with premium multiples, Palantir outshines as a compelling choice due to its sustainable competitive advantage and robust growth trajectory. However, if you seek better stability and a more balanced valuation, Corpay offers superior risk management and steady returns aligned with moderate growth strategies.
Disclaimer: Investment carries a risk of loss of initial capital. The past performance is not a reliable indicator of future results. Be sure to understand risks before making an investment decision.
Go Further
I encourage you to read the complete analyses of Palantir Technologies Inc. and Corpay, Inc. to enhance your investment decisions: