Home > Comparison > Technology > ORCL vs CPAY
The strategic rivalry between Oracle Corporation and Corpay, Inc. shapes the infrastructure software landscape. Oracle dominates as a capital-intensive technology giant with a comprehensive cloud and enterprise software ecosystem. In contrast, Corpay operates a specialized, high-margin payments platform catering to corporate expense management. This head-to-head pits broad enterprise scale against niche financial innovation. This analysis will identify which trajectory offers superior risk-adjusted returns for diversified portfolios in 2026.

Table of contents
Companies Overview
Oracle Corporation and Corpay, Inc. stand as pivotal players in the software infrastructure landscape, shaping enterprise and payment solutions globally.
Oracle Corporation: Enterprise Cloud and Infrastructure Leader
Oracle dominates as a technology giant specializing in enterprise software and cloud infrastructure. It generates revenue primarily through its Oracle Fusion cloud applications and infrastructure technologies, including databases and middleware. In 2026, Oracle’s strategic focus centers on expanding its cloud software suite and autonomous database offerings to deepen enterprise adoption and bolster cloud migration.
Corpay, Inc.: Specialized Payment Solutions Provider
Corpay operates as a payments software company delivering vehicle-related and corporate payment solutions worldwide. Its revenue stems from fuel cards, toll payments, and accounts payable automation services. In 2026, Corpay focuses on scaling its cross-border payment platforms and enhancing virtual card products to capture corporate and consumer transaction flows across multiple regions.
Strategic Collision: Similarities & Divergences
Oracle and Corpay both operate in the software infrastructure sector but pursue contrasting philosophies. Oracle emphasizes a comprehensive cloud ecosystem for enterprise IT, while Corpay targets niche payment verticals with tailored financial technology. Their primary battleground lies in corporate spending solutions, where Oracle’s broad suite competes against Corpay’s specialized payment platforms. These differences create distinct investment profiles: Oracle offers scale and diversification; Corpay delivers focused innovation in payments.
Income Statement Comparison
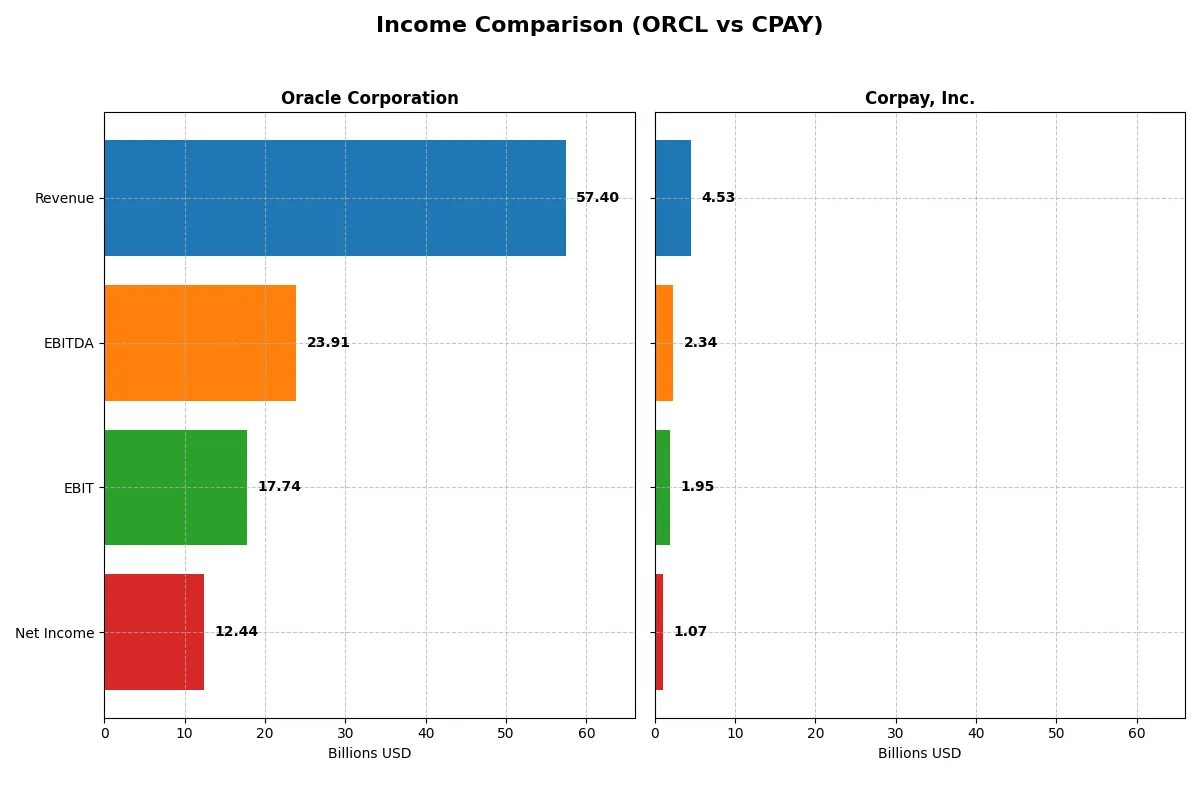
The following data dissects the core profitability and scalability of both corporate engines to reveal who dominates the bottom line:
| Metric | Oracle Corporation (ORCL) | Corpay, Inc. (CPAY) |
|---|---|---|
| Revenue | 57.4B | 4.53B |
| Cost of Revenue | 16.9B | 1.36B |
| Operating Expenses | 22.8B | 1.21B |
| Gross Profit | 40.5B | 3.17B |
| EBITDA | 23.9B | 2.34B |
| EBIT | 17.7B | 1.95B |
| Interest Expense | 3.58B | 404M |
| Net Income | 12.4B | 1.07B |
| EPS | 4.46 | 15.25 |
| Fiscal Year | 2025 | 2025 |
Income Statement Analysis: The Bottom-Line Duel
This income statement comparison uncovers which company converts revenue into profit with superior efficiency and momentum.
Oracle Corporation Analysis
Oracle’s revenue rose steadily from $40.5B in 2021 to $57.4B in 2025, signaling robust top-line growth. Net income surged from $8.5B to $12.4B over five years, though overall net margin declined. In 2025, Oracle maintained a strong 70.5% gross margin and a favorable 21.7% net margin, reflecting solid profitability and efficient cost control.
Corpay, Inc. Analysis
Corpay expanded revenue from $2.8B in 2021 to $4.5B in 2025, outpacing Oracle’s growth rate. Net income climbed from $840M to $1.07B, supported by a high 23.6% net margin in 2025. Corpay’s remarkable 43.1% EBIT margin highlights operational efficiency, although net margin showed some recent pressure, signaling margin management challenges.
Margin Strength vs. Growth Velocity
Oracle delivers consistent profitability with high margins and solid earnings momentum, while Corpay excels in revenue growth and operating efficiency. Oracle’s larger scale and stable margins make it a fundamental winner in absolute earnings. Corpay’s profile appeals to investors favoring high growth and premium margins despite some margin volatility.
Financial Ratios Comparison
These vital ratios act as a diagnostic tool to expose the underlying fiscal health, valuation premiums, and capital efficiency of the companies compared:
| Ratios | Oracle Corporation (ORCL) | Corpay, Inc. (CPAY) |
|---|---|---|
| ROE | 60.8% | 27.5% |
| ROIC | 10.9% | 8.8% |
| P/E | 37.1 | 19.7 |
| P/B | 22.6 | 5.4 |
| Current Ratio | 0.75 | 0.98 |
| Quick Ratio | 0.75 | 0.98 |
| D/E (Debt to Equity) | 5.09 | 2.58 |
| Debt-to-Assets | 61.8% | 37.9% |
| Interest Coverage | 4.94 | 4.83 |
| Asset Turnover | 0.34 | 0.17 |
| Fixed Asset Turnover | 1.32 | 9.59 |
| Payout ratio | 38.1% | 0% |
| Dividend yield | 1.03% | 0% |
| Fiscal Year | 2025 | 2025 |
Efficiency & Valuation Duel: The Vital Signs
Financial ratios act as the company’s DNA, uncovering hidden risks and revealing operational excellence beneath headline numbers.
Oracle Corporation
Oracle delivers an exceptional 60.8% ROE and a strong 21.7% net margin, signaling robust profitability. However, its P/E of 37.1 and P/B of 22.6 indicate an expensive valuation, stretching investor expectations. Despite a modest 1.03% dividend yield, Oracle reinvests heavily in R&D, supporting long-term growth over immediate shareholder payouts.
Corpay, Inc.
Corpay posts a solid 27.5% ROE with a 23.6% net margin, reflecting efficient profit generation. Its P/E near 19.7 suggests a fair valuation, though a high debt-to-equity ratio of 2.58 raises caution. Corpay pays no dividend, prioritizing cash flow reinvestment to fund operational expansion and asset turnover, which impressively hits 9.6x.
Premium Valuation vs. Operational Safety
Oracle’s superior profitability contrasts with its stretched valuation and higher financial leverage. Corpay offers a more balanced risk profile with reasonable valuation and operational efficiency. Investors seeking growth with moderate risk may lean toward Corpay’s profile, while those tolerating valuation premiums might consider Oracle’s dominant returns.
Which one offers the Superior Shareholder Reward?
I compare Oracle Corporation (ORCL) and Corpay, Inc. (CPAY) based on their shareholder return strategies in 2026. Oracle pays a modest dividend yield of 1.03% with a payout ratio near 38%, supported by stable free cash flow, though slightly negative recently. Its share buybacks are modest but consistent, complementing dividends to return cash. Corpay, by contrast, pays no dividends but aggressively repurchases shares, deploying over 90% of free cash flow to buybacks. This reflects a growth-oriented reinvestment approach, focusing on operational margin expansion and cash flow generation. Oracle’s balance sheet shows high leverage, raising sustainability concerns for dividends under stress. Corpay maintains lower leverage and stronger free cash flow coverage, making its buyback-heavy model more sustainable. I conclude Corpay offers the superior total shareholder reward in 2026, driven by disciplined capital allocation and growth reinvestment, while Oracle’s dividend appeal is tempered by financial risk.
Comparative Score Analysis: The Strategic Profile
The radar chart reveals the fundamental DNA and trade-offs of Oracle Corporation and Corpay, Inc., highlighting their financial strengths and valuation nuances:
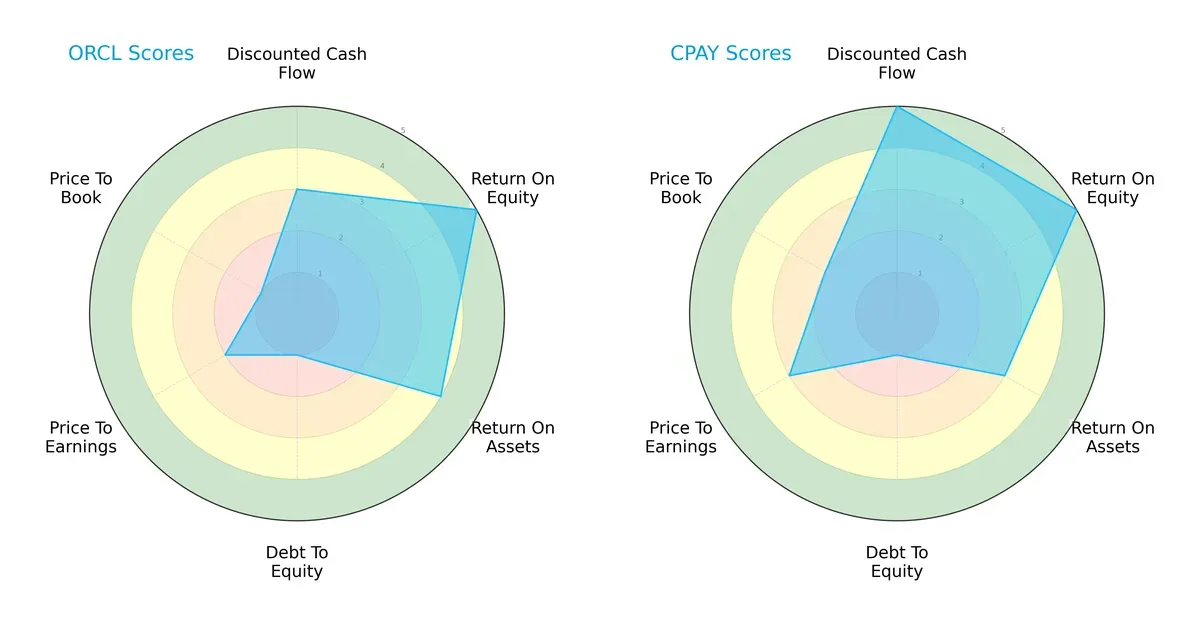
Oracle and Corpay share a balanced overall score of 3, but their strengths diverge. Corpay excels with a top-tier DCF score of 5, signaling confident future cash flows, while Oracle’s DCF is moderate at 3. Both firms deliver strong ROE scores of 5, but Oracle leads slightly on ROA with 4 versus Corpay’s 3. Both carry high debt risk (score 1), a red flag for balance sheet strength. Valuation metrics favor Corpay modestly, with better P/E (3 vs. 2) and P/B (2 vs. 1) scores. Oracle’s profile relies heavily on operational efficiency, while Corpay leverages valuation and cash flow advantages.
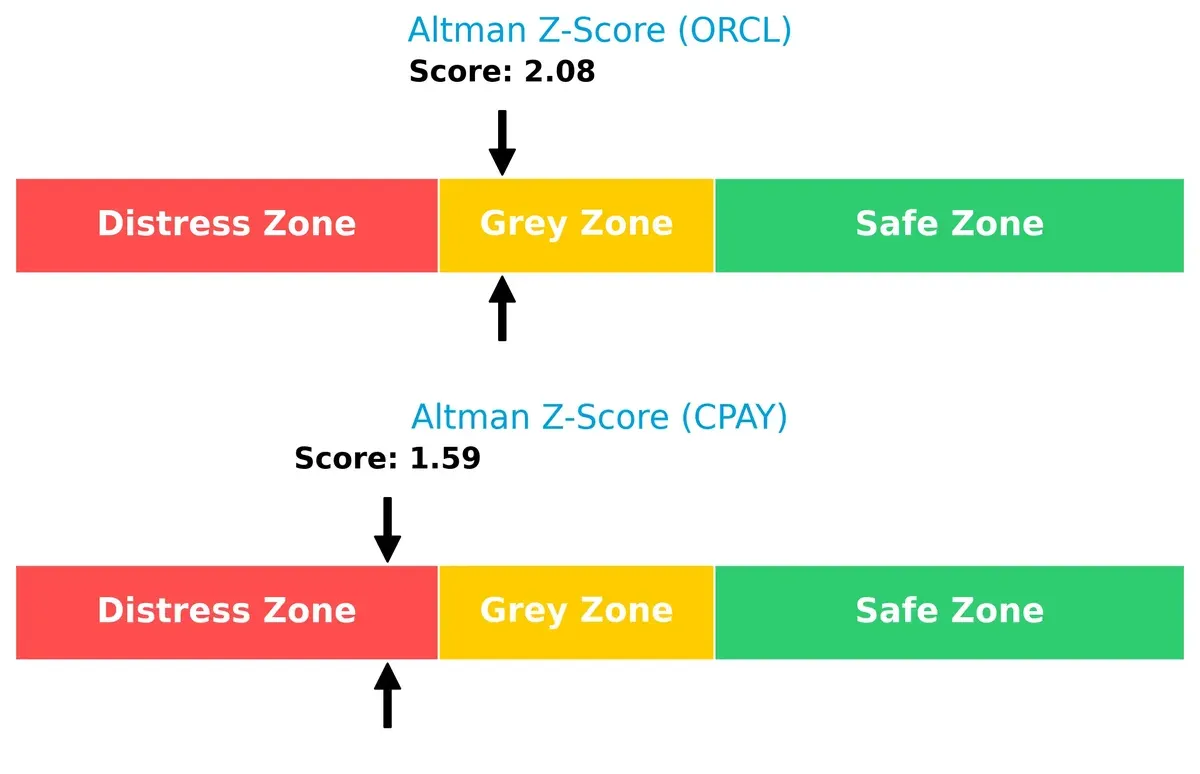
Bankruptcy Risk: Solvency Showdown
Oracle’s Altman Z-Score of 2.08 places it in the grey zone, indicating moderate bankruptcy risk. Corpay’s 1.59 score lands in the distress zone, signaling elevated financial vulnerability in this cycle:
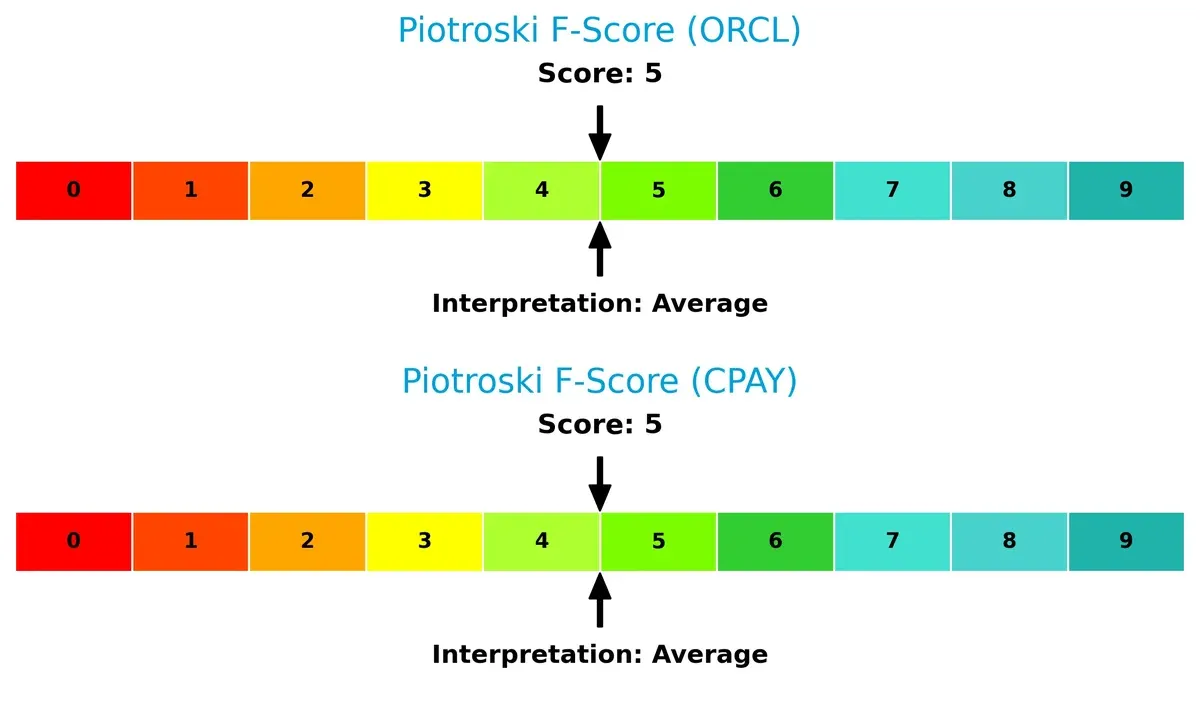
Financial Health: Quality of Operations
Both companies report identical Piotroski F-Scores of 5, reflecting average financial health. Neither stands out as particularly robust, and both warrant caution on operational quality metrics:
How are the two companies positioned?
This section dissects Oracle and Corpay’s operational DNA by comparing revenue distribution and internal strengths and weaknesses. The goal is to confront their economic moats and gauge which model offers the most resilient competitive advantage today.
Revenue Segmentation: The Strategic Mix
The following visual comparison dissects how Oracle Corporation and Corpay, Inc. diversify their income streams and where their primary sector bets lie:
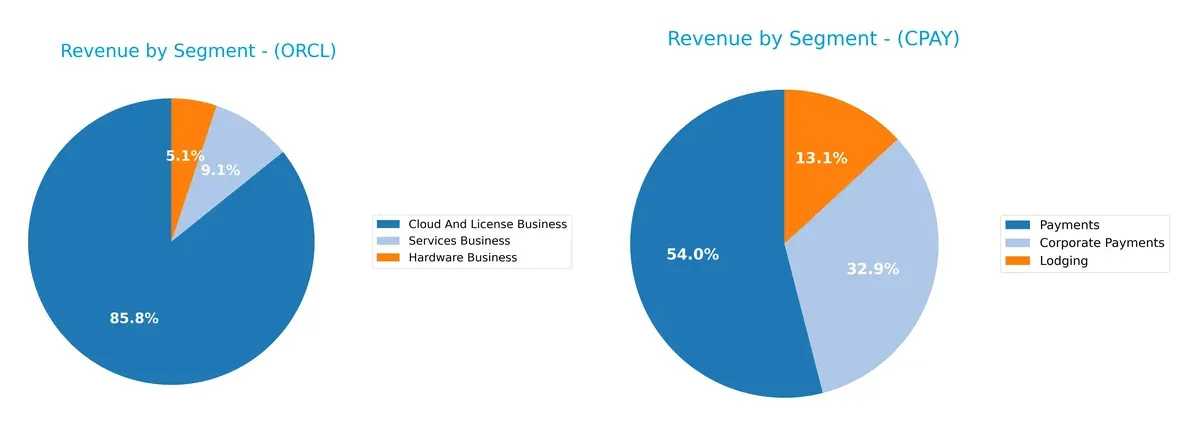
Oracle’s revenue anchors in its Cloud And License Business with $49.2B, dwarfing Hardware ($2.9B) and Services ($5.2B). This concentration signals a strong ecosystem lock-in around cloud software. Corpay’s revenues split more evenly between Payments ($2B), Corporate Payments ($1.2B), and Lodging ($489M), reflecting a diversified model that mitigates concentration risk but lacks a single dominant segment. Oracle leverages infrastructure dominance; Corpay pivots on breadth.
Strengths and Weaknesses Comparison
This table compares the strengths and weaknesses of Oracle Corporation and Corpay, Inc.:
Oracle Strengths
- Strong global presence with $36.3B Americas revenue
- Diversified product lines: cloud, hardware, services
- High profitability with 21.7% net margin and 60.8% ROE
Corpay Strengths
- Favorable net margin at 23.6%
- Lower WACC at 6.3% reflects cheaper capital
- Strong fixed asset turnover at 9.6 indicating efficient asset use
Oracle Weaknesses
- High debt-to-assets at 61.8% and low current ratio of 0.75 signal leverage and liquidity risks
- Unfavorable P/E of 37.1 and P/B of 22.6 suggest overvaluation
- Low asset turnover at 0.34 limits operational efficiency
Corpay Weaknesses
- Current ratio below 1 at 0.98 indicates liquidity constraints
- Unfavorable dividend yield of 0% may deter income-focused investors
- Lower ROIC of 8.8% compared to WACC reduces capital efficiency
Oracle’s broad geographic reach and product diversification underpin its profitability but come with notable leverage and valuation concerns. Corpay benefits from efficient asset use and capital costs but faces liquidity and capital efficiency challenges that could affect growth strategy.
The Moat Duel: Analyzing Competitive Defensibility
A structural moat alone protects long-term profits from relentless competition and market disruption. Let’s dissect the moats of Oracle and Corpay:
Oracle Corporation: Intangible Assets Powerhouse
Oracle’s moat hinges on its vast portfolio of enterprise software, databases, and cloud infrastructure. This intangible asset base drives a solid 30.9% EBIT margin and 21.7% net margin. However, a declining ROIC trend signals margin pressure ahead in 2026, as cloud rivals intensify competition.
Corpay, Inc.: Cost Advantage Through Specialized Payments
Corpay’s moat derives from its cost-efficient, niche payment solutions for vehicle and corporate expenses. Its 43.1% EBIT margin outperforms Oracle, showcasing operational strength. Despite a declining ROIC, Corpay’s expanding international footprint offers growth avenues that could deepen its moat.
Verdict: Intangible Assets vs. Cost Efficiency
Oracle’s intangible asset moat is broad but currently weaker in value creation. Corpay’s cost advantage yields higher profitability and a wider margin buffer. I see Corpay as better positioned to defend and grow its market share in 2026.
Which stock offers better returns?
The past year shows divergent trajectories for Oracle Corporation and Corpay, Inc., with significant price shifts and changing trading dynamics influencing investor sentiment.
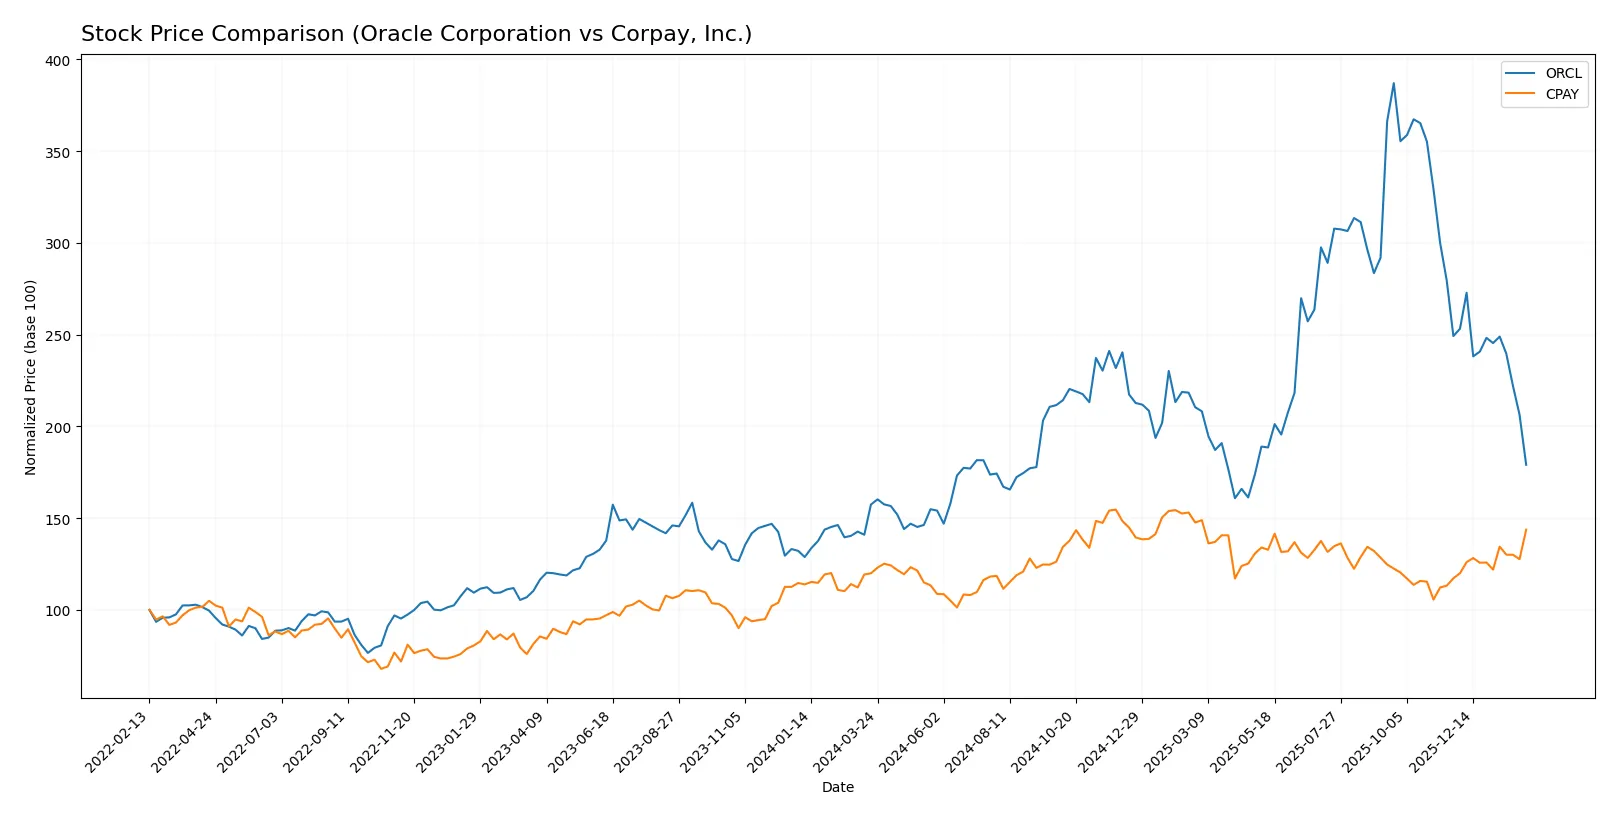
Trend Comparison
Oracle Corporation’s stock gained 13.76% over the past 12 months, indicating a bullish trend with decelerating momentum and a high volatility level (std dev 47.83). Recent months showed a sharp 28.14% decline.
Corpay, Inc. posted a stronger 19.8% gain over the same period, confirming a bullish trend with accelerating momentum and moderate volatility (std dev 31.25). The recent period saw a further 22.63% price increase.
Comparing both, Corpay delivered higher overall returns and accelerating momentum versus Oracle’s decelerating gains, marking it as the superior performer in this timeframe.
Target Prices
Analysts present a bullish consensus for Oracle Corporation and Corpay, Inc., reflecting strong growth expectations.
| Company | Target Low | Target High | Consensus |
|---|---|---|---|
| Oracle Corporation | 175 | 400 | 304.59 |
| Corpay, Inc. | 300 | 390 | 359.33 |
The consensus target for Oracle is more than double its current price of 143, signaling significant upside potential. Corpay’s target consensus aligns closely with its current price near 354, suggesting a more mature valuation outlook.

Don’t Let Luck Decide Your Entry Point
Optimize your entry points with our advanced ProRealTime indicators. You’ll get efficient buy signals with precise price targets for maximum performance. Start outperforming now!
How do institutions grade them?
Oracle Corporation Grades
The latest institutional grades for Oracle Corporation reflect a range of analyst opinions.
| Grading Company | Action | New Grade | Date |
|---|---|---|---|
| Citizens | maintain | Market Outperform | 2026-02-05 |
| Scotiabank | maintain | Sector Outperform | 2026-02-03 |
| Piper Sandler | maintain | Overweight | 2026-02-03 |
| Morgan Stanley | maintain | Equal Weight | 2026-01-23 |
| UBS | maintain | Buy | 2026-01-05 |
| Jefferies | maintain | Buy | 2026-01-05 |
| RBC Capital | maintain | Sector Perform | 2026-01-05 |
| Goldman Sachs | maintain | Neutral | 2025-12-12 |
| RBC Capital | maintain | Sector Perform | 2025-12-11 |
| Stifel | maintain | Buy | 2025-12-11 |
Corpay, Inc. Grades
Corpay, Inc. also holds a variety of recent grades from reputable financial institutions.
| Grading Company | Action | New Grade | Date |
|---|---|---|---|
| Mizuho | maintain | Neutral | 2026-02-06 |
| JP Morgan | maintain | Overweight | 2026-02-05 |
| RBC Capital | maintain | Sector Perform | 2026-02-05 |
| Morgan Stanley | maintain | Overweight | 2026-02-05 |
| Morgan Stanley | upgrade | Overweight | 2026-01-26 |
| Oppenheimer | maintain | Outperform | 2026-01-12 |
| Oppenheimer | upgrade | Outperform | 2025-12-05 |
| UBS | maintain | Neutral | 2025-11-06 |
| RBC Capital | maintain | Sector Perform | 2025-11-06 |
| JP Morgan | maintain | Overweight | 2025-11-06 |
Which company has the best grades?
Oracle Corporation generally receives consistent buy and outperform grades, indicating broad institutional confidence. Corpay, Inc. shows a mix of overweight and outperform ratings but with more neutral stances. Oracle’s stronger consensus could suggest greater market endorsement, influencing investor sentiment accordingly.
Risks specific to each company
The following categories identify critical pressure points and systemic threats facing Oracle Corporation and Corpay, Inc. in the 2026 market environment:
1. Market & Competition
Oracle Corporation
- Faces intense competition in cloud infrastructure from tech giants with strong moats.
Corpay, Inc.
- Operates in a niche payments sector but faces competition from fintech disruptors and traditional banks.
2. Capital Structure & Debt
Oracle Corporation
- High debt-to-assets ratio at 61.8% signals leverage risk; debt/equity at 5.09 is very unfavorable.
Corpay, Inc.
- Lower leverage with 37.9% debt-to-assets; debt/equity at 2.58 still unfavorable but less risky than Oracle.
3. Stock Volatility
Oracle Corporation
- High beta at 1.63 indicates significant price volatility relative to the market.
Corpay, Inc.
- Lower beta at 0.81 shows more stable stock price behavior amid market swings.
4. Regulatory & Legal
Oracle Corporation
- Subject to data privacy and antitrust scrutiny in multiple jurisdictions.
Corpay, Inc.
- Faces regulatory risks in cross-border payments and compliance with financial regulations globally.
5. Supply Chain & Operations
Oracle Corporation
- Complex global supply chains for hardware products could face disruption risks.
Corpay, Inc.
- Operations depend on digital infrastructure but less exposed to physical supply chain issues.
6. ESG & Climate Transition
Oracle Corporation
- Increasing pressure to improve ESG metrics due to size and industry visibility.
Corpay, Inc.
- ESG risks moderate but growing, especially in environmental impact of payment operations.
7. Geopolitical Exposure
Oracle Corporation
- Global presence exposes it to trade tensions, especially US-China tech conflicts.
Corpay, Inc.
- International operations expose it to geopolitical risks but less so than large tech firms.
Which company shows a better risk-adjusted profile?
Oracle’s highest risk lies in its elevated leverage, increasing financial vulnerability despite strong profitability. Corpay’s critical risk comes from its Altman Z-score in the distress zone, signaling potential bankruptcy risk. Between the two, Corpay shows a slightly better risk-adjusted profile due to lower leverage and stock volatility, yet its bankruptcy risk demands caution. Oracle’s high beta and debt ratios warrant vigilance amid market uncertainty.
Final Verdict: Which stock to choose?
Oracle’s superpower lies in its commanding efficiency and robust profitability, evidenced by a high return on equity that outpaces many peers. Its point of vigilance remains a stretched balance sheet, indicating elevated financial leverage. Oracle suits investors aiming for aggressive growth with a tolerance for capital structure risks.
Corpay stands out with a strategic moat rooted in solid recurring revenue streams and efficient capital deployment, reflected by a favorable spread between ROIC and WACC. It offers a comparatively safer profile than Oracle, appealing to investors who prioritize stability alongside growth. Corpay fits well within a GARP portfolio seeking balanced risk and return.
If you prioritize scaling with proven profitability and can navigate higher leverage, Oracle is the compelling choice due to its unmatched operational efficiency. However, if you seek better capital structure stability and consistent value creation, Corpay offers superior risk-adjusted potential. Both present slightly unfavorable ratio profiles, so careful risk management is crucial.
Disclaimer: Investment carries a risk of loss of initial capital. The past performance is not a reliable indicator of future results. Be sure to understand risks before making an investment decision.
Go Further
I encourage you to read the complete analyses of Oracle Corporation and Corpay, Inc. to enhance your investment decisions: