Home > Comparison > Technology > CPAY vs OKTA
The strategic rivalry between Corpay, Inc. and Okta, Inc. shapes the Technology sector’s Software – Infrastructure landscape. Corpay operates as a broad payments solutions provider with a capital-intensive model, while Okta focuses on high-margin identity management software. This analysis pits Corpay’s diversified payments platform against Okta’s specialized security services. I will determine which company’s trajectory offers superior risk-adjusted returns for a well-diversified portfolio in 2026.

Table of contents
Companies Overview
Corpay and Okta stand as pivotal players in the software infrastructure landscape, shaping enterprise operations globally.
Corpay, Inc.: Payments Infrastructure Powerhouse
Corpay dominates the payments infrastructure sector by enabling businesses and consumers to manage vehicle, lodging, and corporate payments worldwide. Its revenue stems from diverse solutions, including fuel, tolls, virtual cards, and accounts payable automation. In 2026, Corpay’s strategic focus sharpens on expanding cross-border payment capabilities and automating corporate payment workflows to enhance client efficiency.
Okta, Inc.: Identity Security Innovator
Okta leads in identity solutions for enterprises and public institutions, monetizing through its comprehensive Okta Identity Cloud platform. It offers services such as Single Sign-On, Adaptive Multi-Factor Authentication, and API Access Management. For 2026, Okta prioritizes advancing passwordless authentication and expanding its Auth0 product suite to strengthen security and user experience across cloud and on-premise environments.
Strategic Collision: Similarities & Divergences
Corpay and Okta both serve as critical infrastructure enablers but diverge sharply in philosophy: Corpay drives payments automation with a focus on transaction efficiency, while Okta champions digital identity security emphasizing access control. They compete indirectly by securing enterprise operational layers—Corpay in monetary flows, Okta in user authentication. Each presents a distinct investment profile anchored in different facets of enterprise technology infrastructure.
Income Statement Comparison
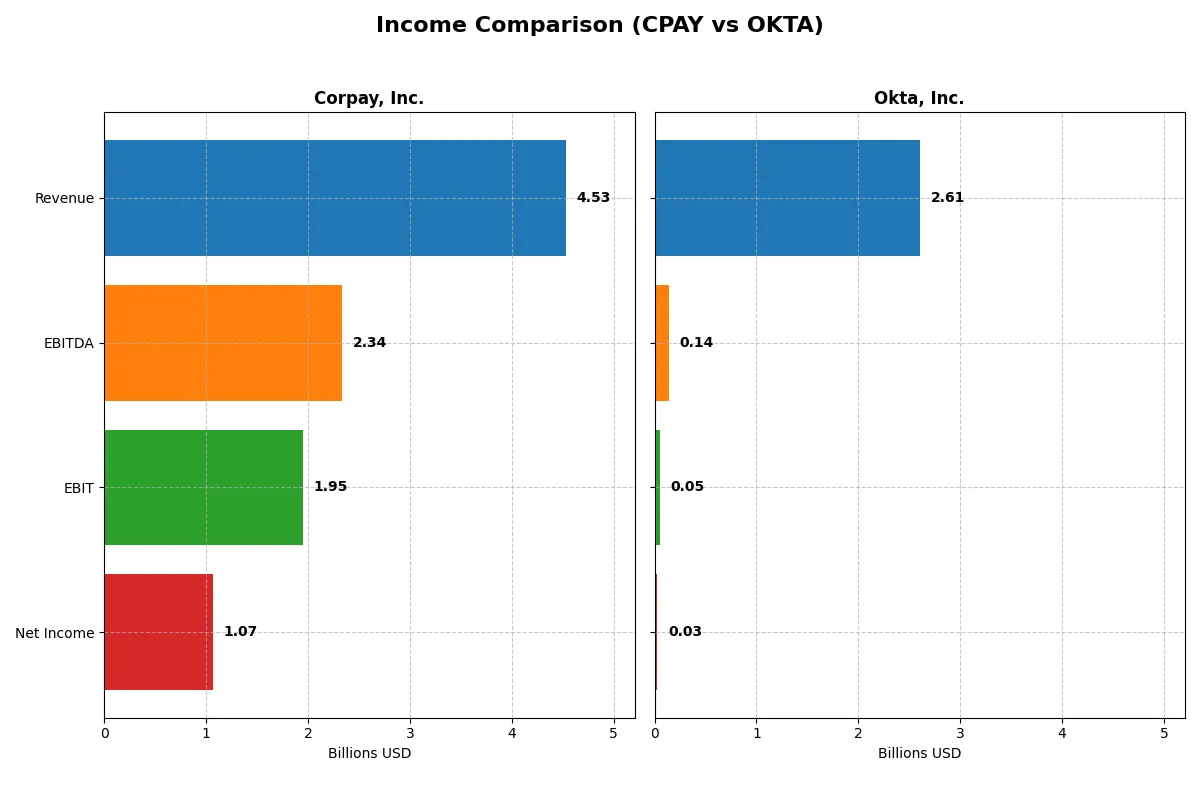
The following data dissects the core profitability and scalability of both corporate engines to reveal who dominates the bottom line:
| Metric | Corpay, Inc. (CPAY) | Okta, Inc. (OKTA) |
|---|---|---|
| Revenue | 4.53B | 2.61B |
| Cost of Revenue | 1.36B | 618M |
| Operating Expenses | 1.21B | 2.07B |
| Gross Profit | 3.17B | 1.99B |
| EBITDA | 2.34B | 139M |
| EBIT | 1.95B | 51M |
| Interest Expense | 404M | 5M |
| Net Income | 1.07B | 28M |
| EPS | 15.25 | 0.17 |
| Fiscal Year | 2025 | 2025 |
Income Statement Analysis: The Bottom-Line Duel
The following income statement comparison reveals the true efficiency and profitability of two distinct corporate engines in their latest fiscal years.
Corpay, Inc. Analysis
Corpay displays a steady revenue climb from 2.8B in 2021 to 4.5B in 2025, with net income rising from 839M to 1.07B. Its gross margin hovers near 70%, and net margin remains strong at 23.6%, signaling efficient cost control. The 2025 figures show momentum in revenue and EBIT, despite a slight net margin dip.
Okta, Inc. Analysis
Okta’s revenue more than tripled, soaring from 835M in 2021 to 2.61B in 2025, with net income recovering sharply to 28M from losses. Gross margin improved to 76.3%, but net margin stays slim at 1.1%. The latest year reflects rapid growth and margin expansion, though overall profitability remains low amid aggressive investment.
Steady Margins vs. Rapid Growth
Corpay outpaces Okta in profitability and margin stability, delivering consistent bottom-line gains with a healthy 23.6% net margin. Okta leads on revenue growth and gross margin but struggles to convert scale into meaningful net profits. For investors, Corpay’s profile offers disciplined earnings, while Okta represents a high-growth, high-risk opportunity.
Financial Ratios Comparison
These vital ratios serve as a diagnostic tool to expose the underlying fiscal health, valuation premiums, and capital efficiency of the companies:
| Ratios | Corpay, Inc. (CPAY) | Okta, Inc. (OKTA) |
|---|---|---|
| ROE | 27.5% | 0.44% |
| ROIC | 8.8% | -0.6% |
| P/E | 19.7 | 570.6 |
| P/B | 5.43 | 2.49 |
| Current Ratio | 0.98 | 1.35 |
| Quick Ratio | 0.98 | 1.35 |
| D/E | 2.58 | 0.15 |
| Debt-to-Assets | 37.9% | 10.1% |
| Interest Coverage | 4.83 | -14.8 |
| Asset Turnover | 0.17 | 0.28 |
| Fixed Asset Turnover | 9.59 | 22.31 |
| Payout ratio | 0 | 0 |
| Dividend yield | 0 | 0 |
| Fiscal Year | 2025 | 2025 |
Efficiency & Valuation Duel: The Vital Signs
Financial ratios act as a company’s DNA, revealing hidden risks and operational excellence crucial for investment decisions.
Corpay, Inc.
Corpay delivers strong profitability with a 27.55% ROE and a robust 23.62% net margin, signaling operational efficiency. Its P/E at 19.73 appears fairly valued but a high P/B of 5.43 and low current ratio of 0.98 raise caution. Corpay does not pay dividends, focusing on reinvestment instead.
Okta, Inc.
Okta struggles with profitability, showing a weak 0.44% ROE and a slim 1.07% net margin. Its P/E ratio is stretched at 570.6, reflecting high valuation risk. However, Okta maintains a solid balance sheet with low debt and decent liquidity. It also reinvests heavily in R&D rather than paying dividends.
Premium Valuation vs. Operational Safety
Corpay balances attractive profitability against some financial weaknesses, offering moderate valuation risk. Okta’s sky-high P/E and weak earnings challenge its operational safety despite strong liquidity. Investors seeking solid returns may lean toward Corpay, while those favoring growth with higher risk might consider Okta’s profile.
Which one offers the Superior Shareholder Reward?
I observe that both Corpay, Inc. (CPAY) and Okta, Inc. (OKTA) pay no dividends, focusing their shareholder rewards on reinvestment and buybacks. CPAY shows robust free cash flow (18.5–26.6 per share recently) with no dividend payout, signaling capital reinvestment and potential buybacks. OKTA, despite positive free cash flow in 2025 (4.3 per share), operates with razor-thin net margins (~1%) and negative earnings in prior years, limiting its buyback capacity. CPAY’s stronger margins and substantial free cash flow suggest a sustainable capital allocation toward growth and buybacks. OKTA’s high valuation multiples (P/E ~570) and weak profitability raise risk. I conclude CPAY offers a superior total return profile in 2026, balancing cash generation and reinvestment sustainability.
Comparative Score Analysis: The Strategic Profile
The radar chart reveals the fundamental DNA and trade-offs of Corpay, Inc. and Okta, Inc., highlighting their financial strengths and vulnerabilities:
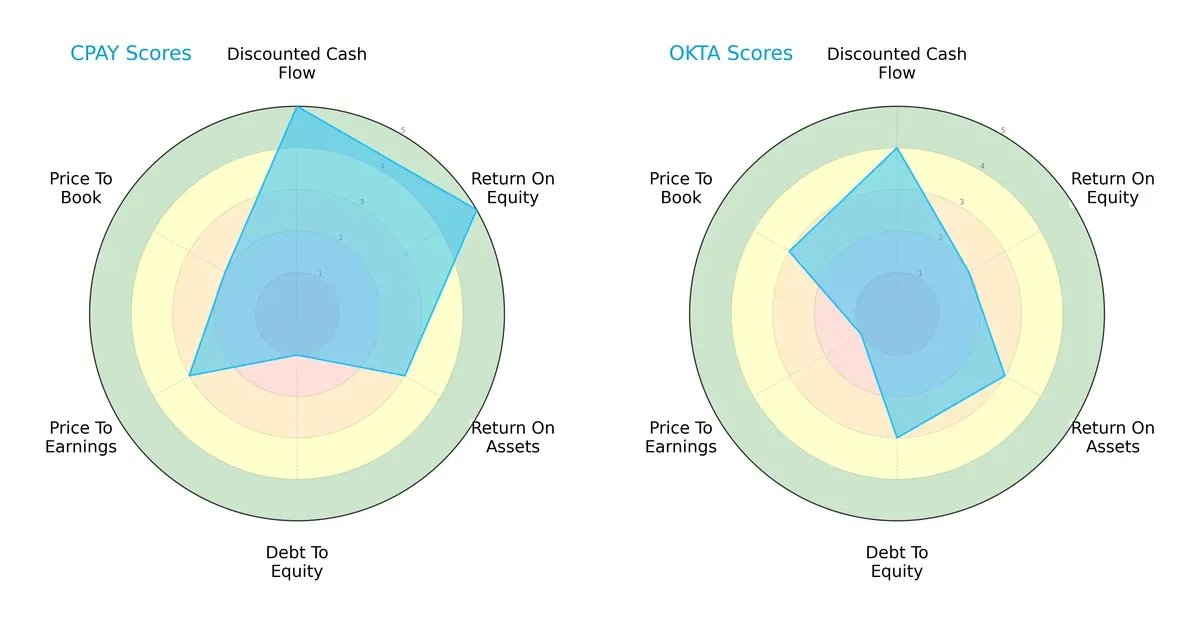
Corpay leads with strong DCF and ROE scores, showing excellent cash flow projections and efficient equity use. However, its debt-to-equity score is very unfavorable, signaling high leverage risk. Okta presents a more balanced debt profile and moderate asset utilization but suffers weak valuation metrics, especially P/E. Corpay relies on its profitability edge, while Okta offers steadier financial stability.
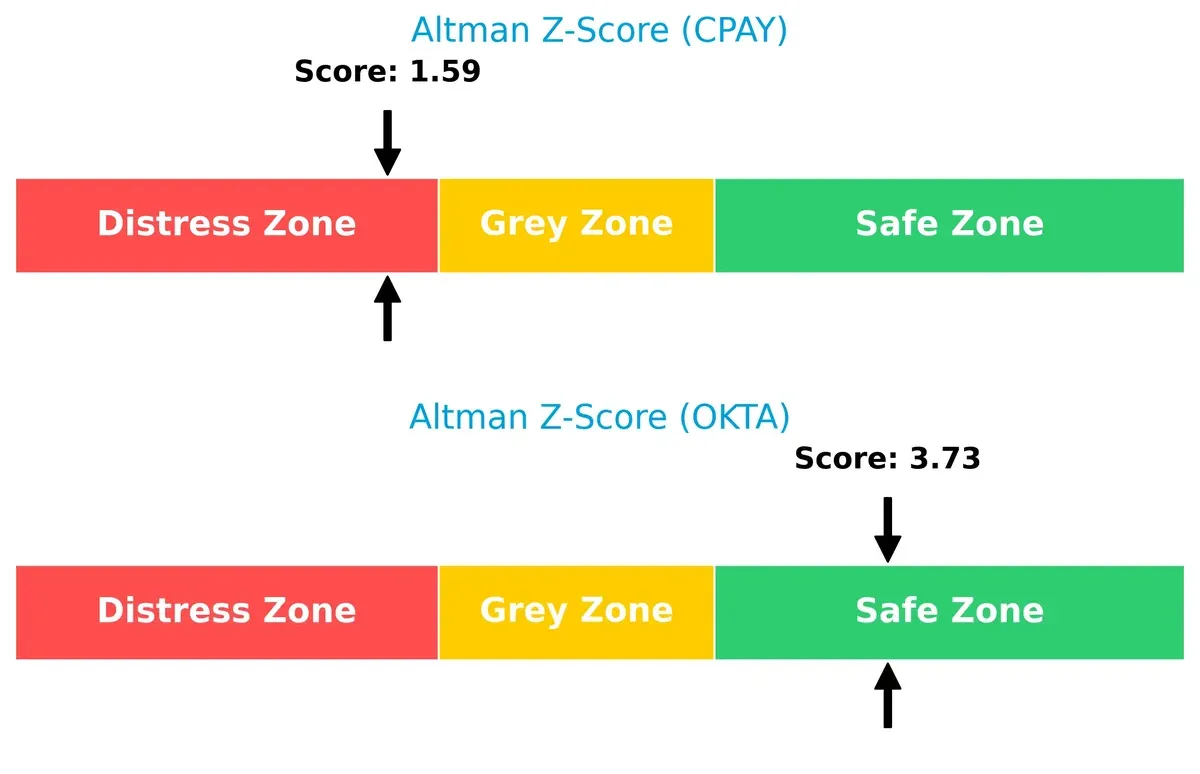
Bankruptcy Risk: Solvency Showdown
Corpay’s Altman Z-Score of 1.59 places it in the distress zone, indicating high bankruptcy risk. Okta’s 3.73 score keeps it safely above financial distress thresholds, demonstrating stronger long-term survival prospects:
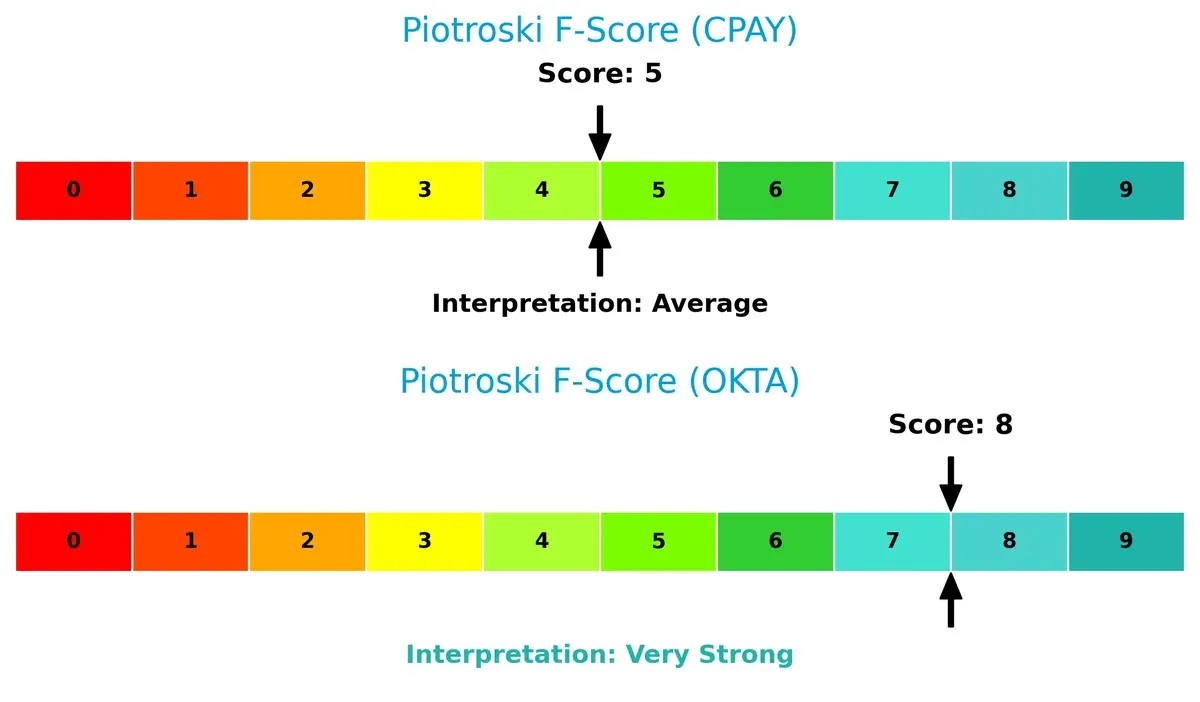
Financial Health: Quality of Operations
Okta’s Piotroski F-Score of 8 signals very strong financial health and operational quality. Corpay’s score of 5 is average, suggesting some red flags in internal metrics compared to Okta’s robust fundamentals:
How are the two companies positioned?
This section dissects the operational DNA of Corpay and Okta by comparing their revenue distribution and internal dynamics. The goal is to confront their economic moats and identify which model offers the most resilient competitive advantage today.
Revenue Segmentation: The Strategic Mix
This visual comparison dissects how Corpay, Inc. and Okta, Inc. diversify their income streams and where their primary sector bets lie:
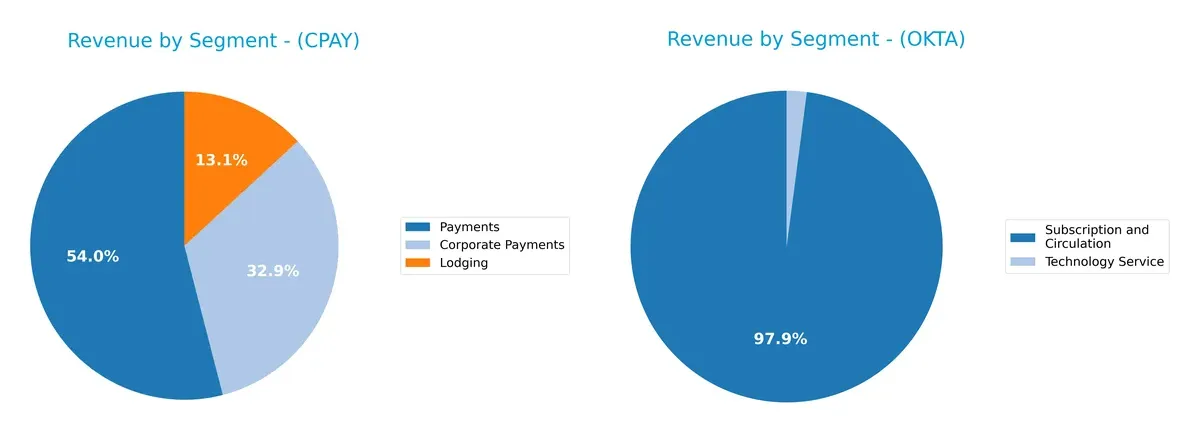
Corpay anchors its revenue in Payments at $2B, with Corporate Payments ($1.22B) and Lodging ($489M) adding moderate diversity. Okta, however, pivots almost entirely on Subscription and Circulation ($2.56B), with a minimal Technology Service segment ($54M). Corpay’s mix reduces concentration risk, leveraging ecosystem lock-in in payments infrastructure. Okta’s dominance in subscriptions signals strong platform dependency but raises red flags on segment concentration.
Strengths and Weaknesses Comparison
This table compares the Strengths and Weaknesses of Corpay, Inc. and Okta, Inc.:
Corpay Strengths
- Strong net margin at 23.62%
- High ROE of 27.55%
- Favorable WACC at 6.26%
- Diverse revenue streams across payments and lodging
- Significant global presence including US, UK, Brazil
Okta Strengths
- Favorable WACC at 7.15%
- Strong quick ratio at 1.35
- Low debt-to-equity at 0.15
- High fixed asset turnover at 22.31
- Growing subscription revenue with increasing geographic diversification
Corpay Weaknesses
- Low current ratio at 0.98 signals liquidity risk
- High debt-to-equity ratio of 2.58
- Unfavorable price-to-book at 5.43
- Low asset turnover at 0.17
- No dividend yield
Okta Weaknesses
- Very low net margin at 1.07%
- Negative ROIC at -0.61%
- Extremely high P/E at 570.6
- Moderate asset turnover at 0.28
- No dividend yield
Corpay shows solid profitability and diversified revenue but carries liquidity and leverage concerns. Okta offers strong asset efficiency and low leverage but struggles with profitability and valuation metrics. These contrasts highlight differing strategic challenges for each company.
The Moat Duel: Analyzing Competitive Defensibility
A durable structural moat is the only defense that protects long-term profits from relentless competitive erosion:
Corpay, Inc.: Diversified Payment Solutions with Scale Moat
Corpay leverages scale and cross-border payment expertise, reflected in a strong 23.6% net margin and 2.5% ROIC premium over WACC. Its expanding global footprint in vehicle and corporate payments deepens this moat, though declining ROIC signals caution.
Okta, Inc.: Rapidly Scaling Identity Security Platform
Okta’s moat hinges on network effects and platform integration, fueling 15%+ revenue growth and accelerating ROIC despite a current negative spread versus WACC. Its expanding identity cloud suite and multi-factor authentication position it for market disruption and long-term margin expansion.
Verdict: Scale and Diversification vs. Network Effects and Growth
Corpay’s wider economic moat currently outpaces Okta’s, with positive ROIC spread signaling value creation. However, Okta’s accelerating ROIC trend and innovation-driven growth could reshape competitive dynamics. Corpay is better equipped today to defend market share, but Okta’s evolving platform demands close monitoring.
Which stock offers better returns?
Stock price movements over the past year reveal clear divergences in performance and trading dynamics between Corpay, Inc. and Okta, Inc.
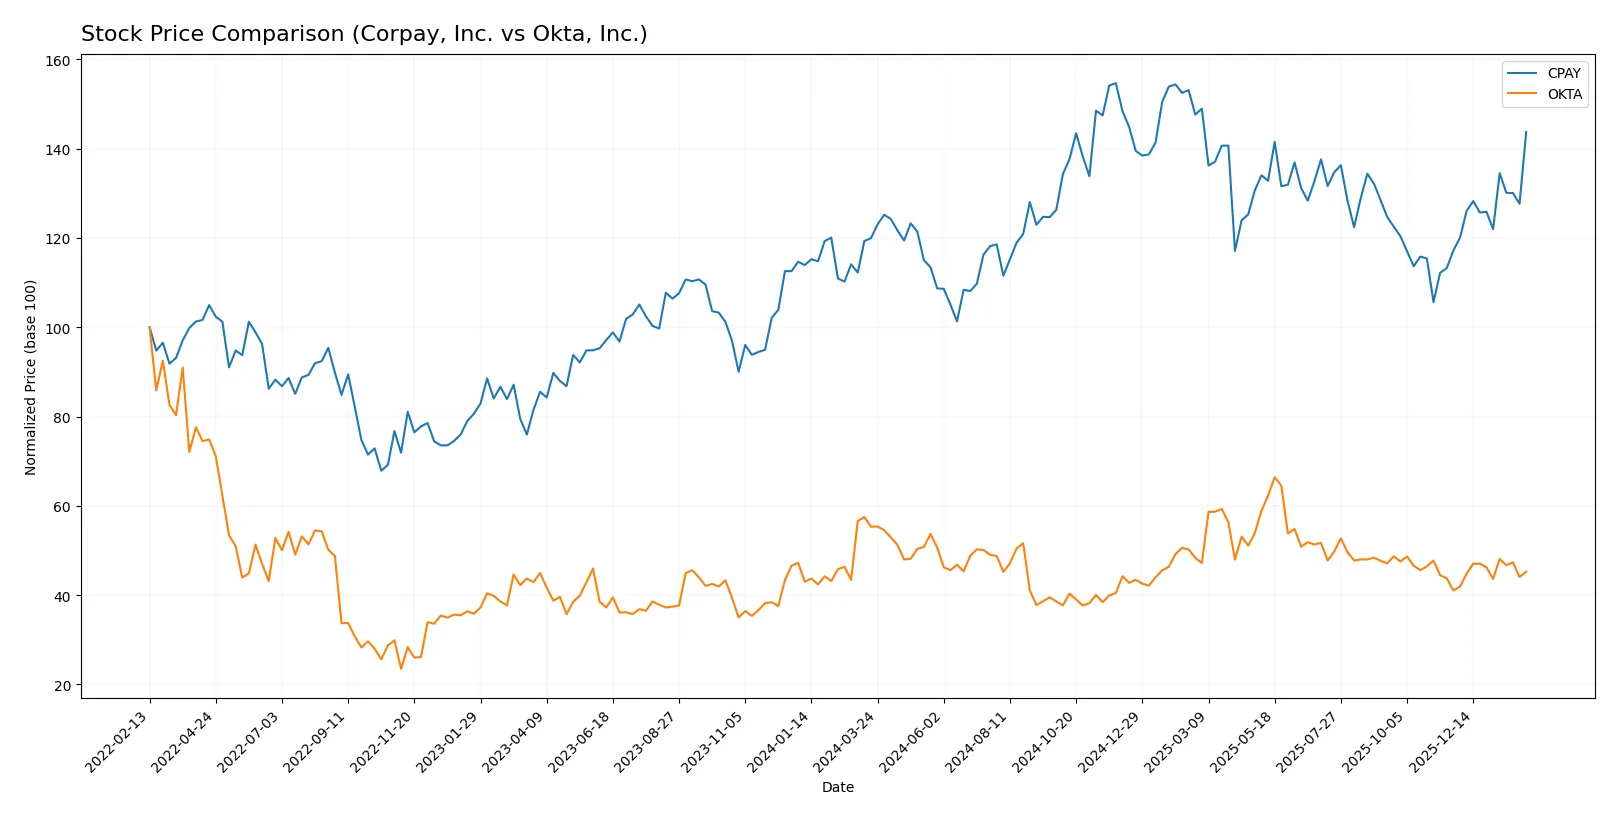
Trend Comparison
Corpay, Inc. shows a bullish trend with a 19.8% price increase over the past 12 months, marked by acceleration and high volatility, reaching a peak of 381.18. Okta, Inc. exhibits a bearish trend with an 18.25% decline over the same period, despite acceleration, and lower volatility with a top price of 127.3. Corpay’s stock outperformed Okta’s significantly, delivering the highest market returns in the 12-month timeframe analyzed.
Target Prices
Analysts present a clear consensus on target prices for Corpay, Inc. and Okta, Inc.
| Company | Target Low | Target High | Consensus |
|---|---|---|---|
| Corpay, Inc. | 300 | 390 | 359.33 |
| Okta, Inc. | 60 | 140 | 110.67 |
Corpay’s consensus target of 359.33 closely tracks its current price near 354, signaling limited upside. Okta’s 110.67 consensus suggests roughly 27% upside from its current 86.74, reflecting stronger analyst optimism.

Don’t Let Luck Decide Your Entry Point
Optimize your entry points with our advanced ProRealTime indicators. You’ll get efficient buy signals with precise price targets for maximum performance. Start outperforming now!
How do institutions grade them?
Corpay, Inc. Grades
Here are recent grades assigned to Corpay, Inc. by major financial institutions:
| Grading Company | Action | New Grade | Date |
|---|---|---|---|
| Mizuho | Maintain | Neutral | 2026-02-06 |
| JP Morgan | Maintain | Overweight | 2026-02-05 |
| RBC Capital | Maintain | Sector Perform | 2026-02-05 |
| Morgan Stanley | Maintain | Overweight | 2026-02-05 |
| Morgan Stanley | Upgrade | Overweight | 2026-01-26 |
| Oppenheimer | Maintain | Outperform | 2026-01-12 |
| Oppenheimer | Upgrade | Outperform | 2025-12-05 |
| UBS | Maintain | Neutral | 2025-11-06 |
| RBC Capital | Maintain | Sector Perform | 2025-11-06 |
| JP Morgan | Maintain | Overweight | 2025-11-06 |
Okta, Inc. Grades
Below are the latest institutional grades for Okta, Inc.:
| Grading Company | Action | New Grade | Date |
|---|---|---|---|
| Stephens & Co. | Upgrade | Overweight | 2026-01-14 |
| Piper Sandler | Maintain | Neutral | 2026-01-05 |
| RBC Capital | Maintain | Outperform | 2026-01-05 |
| Jefferies | Upgrade | Buy | 2025-12-16 |
| Needham | Maintain | Buy | 2025-12-12 |
| BTIG | Maintain | Buy | 2025-12-04 |
| Piper Sandler | Maintain | Neutral | 2025-12-03 |
| BTIG | Maintain | Buy | 2025-12-03 |
| BMO Capital | Maintain | Market Perform | 2025-12-03 |
| DA Davidson | Maintain | Buy | 2025-12-03 |
Which company has the best grades?
Okta, Inc. generally receives more positive grades, including multiple “Buy” and “Overweight” actions, indicating stronger analyst confidence. Corpay, Inc.’s grades cluster around “Neutral” and “Overweight” with fewer “Outperform” ratings, suggesting a more cautious outlook. This contrast may influence investors seeking higher conviction from institutional analysts.
Risks specific to each company
The following categories identify the critical pressure points and systemic threats facing both firms in the 2026 market environment:
1. Market & Competition
Corpay, Inc.
- Operates in payments and corporate solutions with global reach but faces intense competition from fintech and traditional banks.
Okta, Inc.
- Dominates identity solutions with diverse products but competes fiercely against cloud giants and new cybersecurity entrants.
2. Capital Structure & Debt
Corpay, Inc.
- High debt-to-equity ratio (2.58) signals leverage risk and financial vulnerability.
Okta, Inc.
- Low debt-to-equity (0.15) indicates strong balance sheet and lower financial risk.
3. Stock Volatility
Corpay, Inc.
- Beta at 0.808 suggests moderate stock volatility, slightly less sensitive to market swings.
Okta, Inc.
- Beta at 0.767 reflects lower volatility, indicating more stable price movements.
4. Regulatory & Legal
Corpay, Inc.
- Faces regulatory scrutiny across multiple countries, especially in payments compliance and data privacy.
Okta, Inc.
- Operates under stringent cybersecurity and data protection regulations, with potential legal risks from breaches.
5. Supply Chain & Operations
Corpay, Inc.
- Dependent on global payment networks and partners, vulnerable to operational disruptions and tech integration challenges.
Okta, Inc.
- Relies on cloud infrastructure and software development teams; risks include service outages and talent retention.
6. ESG & Climate Transition
Corpay, Inc.
- ESG risks linked to corporate governance and environmental impact from legacy payment processes.
Okta, Inc.
- Faces pressure to enhance environmental sustainability in cloud operations and improve social governance metrics.
7. Geopolitical Exposure
Corpay, Inc.
- Exposure to markets like Brazil and UK subjects it to currency volatility and geopolitical risks.
Okta, Inc.
- Primarily US-based with international clients, exposed to US-China tensions and privacy law divergences.
Which company shows a better risk-adjusted profile?
Okta’s strongest advantage lies in its robust balance sheet and superior financial stability, reflected by a low debt load and strong Piotroski score. Corpay’s leverage and liquidity constraints heighten its financial risk despite solid profitability. The most impactful risk for Corpay is its high leverage, which contrasts with Okta’s undervalued but less profitable earnings profile. Okta’s Altman Z-score in the safe zone versus Corpay’s distress zone confirms a better risk-adjusted position. Recent data shows Corpay’s debt-to-equity at 2.58, raising red flags about its financial resilience under tightening credit conditions.
Final Verdict: Which stock to choose?
Corpay, Inc. excels as a cash-generating engine with robust profitability and a consistent ability to create value above its cost of capital. Its main point of vigilance is a stretched liquidity position and elevated leverage, which could pressure resilience during economic downturns. It fits well within aggressive growth portfolios that can tolerate financial risk for strong returns.
Okta, Inc. boasts a strategic moat rooted in its cloud security dominance and recurring revenue model, offering a safer financial profile than Corpay. Despite current profitability challenges, its improving margins and strong balance sheet present a compelling case for investors seeking growth with more stability. It aligns with GARP portfolios that balance growth potential and risk control.
If you prioritize cash flow generation and proven value creation, Corpay outshines as the compelling choice due to its superior returns on capital. However, if you seek growth with enhanced financial stability and a durable competitive moat, Okta offers better stability and growth trajectory despite its higher valuation premium. Both present distinct analytical scenarios suited to different investor profiles.
Disclaimer: Investment carries a risk of loss of initial capital. The past performance is not a reliable indicator of future results. Be sure to understand risks before making an investment decision.
Go Further
I encourage you to read the complete analyses of Corpay, Inc. and Okta, Inc. to enhance your investment decisions: