Home > Comparison > Technology > CPAY vs NTNX
The strategic rivalry between Corpay, Inc. and Nutanix, Inc. shapes the evolving landscape of the technology sector. Corpay operates as a payments-focused infrastructure provider with a broad global footprint. Nutanix delivers an enterprise cloud platform emphasizing virtualization and hybrid cloud solutions. This head-to-head contrasts Corpay’s transactional scale with Nutanix’s innovation-driven growth. This analysis aims to identify which company presents a superior risk-adjusted opportunity for a diversified portfolio.
Table of contents
Companies Overview
Corpay and Nutanix hold pivotal roles in the software infrastructure sector, shaping enterprise and payment solutions globally.
Corpay, Inc.: Leader in Corporate Payment Solutions
Corpay dominates the payments industry by managing vehicle, lodging, and corporate payments across multiple continents. Its core revenue streams include vehicle payment solutions and corporate payment automation, serving business and consumer clients. In 2026, the company’s strategic focus centers on expanding cross-border payment capabilities and enhancing virtual card offerings, reinforcing its competitive positioning in global transaction efficiency.
Nutanix, Inc.: Pioneer in Enterprise Cloud Platforms
Nutanix stands out as a key provider of enterprise cloud infrastructure, delivering converged virtualization, storage, and security solutions worldwide. Its revenue derives from innovative products like the Acropolis Hypervisor and Nutanix Karbon, which simplify cloud-native operations. The 2026 strategy emphasizes hybrid cloud orchestration and automation through platforms like Prism Pro and Nutanix Calm, aiming to streamline lifecycle management in complex IT environments.
Strategic Collision: Similarities & Divergences
Both companies operate in software infrastructure but pursue distinct philosophies: Corpay focuses on payment ecosystems with a global footprint, while Nutanix builds open hybrid cloud platforms. They primarily compete for enterprise clients seeking digital transformation but address different pain points—financial transactions versus IT infrastructure. Their investment profiles diverge sharply, reflecting Corpay’s scale in transactional services versus Nutanix’s innovation-driven growth in cloud computing.
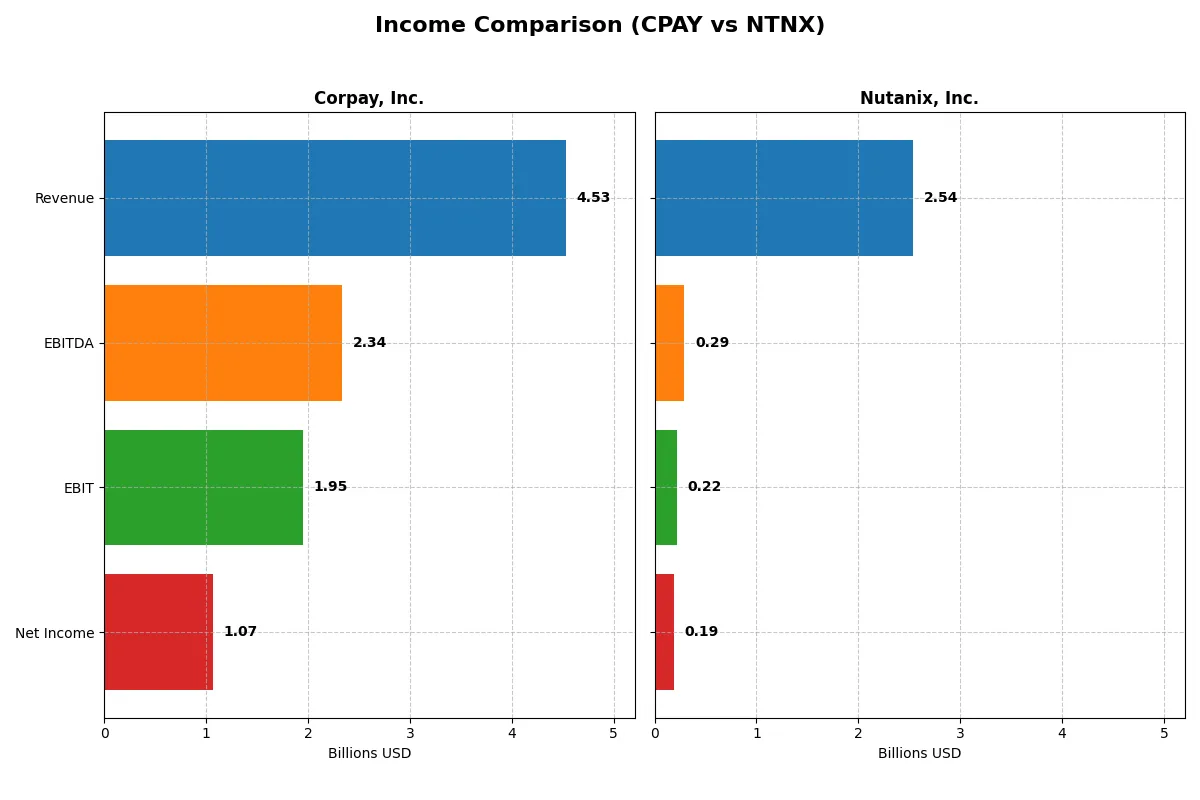
Income Statement Comparison
This data dissects the core profitability and scalability of both corporate engines to reveal who dominates the bottom line:
| Metric | Corpay, Inc. (CPAY) | Nutanix, Inc. (NTNX) |
|---|---|---|
| Revenue | 4.53B | 2.54B |
| Cost of Revenue | 1.36B | 335M |
| Operating Expenses | 1.21B | 2.03B |
| Gross Profit | 3.17B | 2.20B |
| EBITDA | 2.34B | 293M |
| EBIT | 1.95B | 220M |
| Interest Expense | 404M | 20M |
| Net Income | 1.07B | 188M |
| EPS | 15.25 | 0.70 |
| Fiscal Year | 2025 | 2025 |
Income Statement Analysis: The Bottom-Line Duel
This income statement comparison reveals which company converts revenue into profits with superior efficiency and growth momentum.
Corpay, Inc. (CPAY) Analysis
Corpay’s revenue climbed steadily from 2.8B in 2021 to 4.5B in 2025, a solid 60% growth over five years. Net income rose 27% to nearly 1.07B, driven by robust gross margins near 70% and a strong EBIT margin of 43%. Despite a slight net margin dip, Corpay maintains excellent operational efficiency and consistent profit expansion.
Nutanix, Inc. (NTNX) Analysis
Nutanix also grew revenue impressively, surging 82% from 1.4B in 2021 to 2.5B in 2025. Its gross margin outpaces Corpay at nearly 87%, but EBIT margin remains modest at 8.7%. After prior losses, Nutanix turned profitable in 2025 with a net margin of 7.4%. The company shows accelerating momentum with sharply improving profitability metrics.
Margin Dominance vs. Growth Turnaround
Corpay leads in margin strength and steady profit growth, showcasing a highly efficient business model. Nutanix impresses with faster revenue and net income growth, recovering from losses to post positive margins. For investors, Corpay offers stable, high-margin returns, while Nutanix presents a higher-growth, improving profitability profile with more operational leverage risk.
Financial Ratios Comparison
These vital ratios act as a diagnostic tool to expose the underlying fiscal health, valuation premiums, and capital efficiency of the companies compared:
| Ratios | Corpay, Inc. (CPAY) | Nutanix, Inc. (NTNX) |
|---|---|---|
| ROE | 27.5% | -27.1% |
| ROIC | 8.8% | 8.1% |
| P/E | 19.7 | 106.7 |
| P/B | 5.4 | -29.0 |
| Current Ratio | 0.98 | 1.72 |
| Quick Ratio | 0.98 | 1.72 |
| D/E | 2.58 | -2.14 |
| Debt-to-Assets | 37.9% | 45.2% |
| Interest Coverage | 4.83 | 8.75 |
| Asset Turnover | 0.17 | 0.77 |
| Fixed Asset Turnover | 9.59 | 9.15 |
| Payout ratio | 0 | 0 |
| Dividend yield | 0 | 0 |
| Fiscal Year | 2025 | 2025 |
Efficiency & Valuation Duel: The Vital Signs
Financial ratios serve as a company’s DNA, exposing hidden risks and operational strengths essential for investment insight.
Corpay, Inc.
Corpay boasts a robust 27.55% ROE and a strong 23.62% net margin, reflecting solid profitability. Its P/E of 19.73 signals a fairly valued stock, though a 5.43 PB ratio appears stretched. The firm lacks dividends, focusing instead on reinvestment. However, a weak current ratio (0.98) and high debt level (D/E 2.58) pose caution.
Nutanix, Inc.
Nutanix displays a troubling -27.12% ROE and modest 7.42% net margin, indicating profitability challenges. Its P/E at 106.74 shows an expensive valuation. The company maintains strong liquidity (current ratio 1.72) and low debt burden (negative D/E). It also reinvests heavily in R&D, reflecting a growth-oriented approach despite uneven returns.
Valuation Discipline vs. Growth Ambition
Corpay offers better profitability and a reasonable valuation but carries higher leverage risks. Nutanix’s balance sheet is healthier with stronger liquidity, yet its expensive valuation and negative returns warrant caution. Risk-averse investors may prefer Corpay’s operational efficiency; growth seekers might tolerate Nutanix’s volatility for potential payoff.
Which one offers the Superior Shareholder Reward?
I observe that Corpay, Inc. (CPAY) and Nutanix, Inc. (NTNX) both avoid dividends, favoring reinvestment over payout. CPAY delivers strong free cash flow (18–26/share) with high operating margins (~43%), supporting sustainable growth and moderate buybacks. NTNX posts volatile profits with weaker margins (~7%) but maintains aggressive buybacks amid negative equity. CPAY’s disciplined capital allocation and robust cash generation suggest a more sustainable total return in 2026. I conclude CPAY offers the superior shareholder reward, balancing growth and capital return pragmatically.
Comparative Score Analysis: The Strategic Profile
The radar chart reveals the fundamental DNA and trade-offs of Corpay, Inc. and Nutanix, Inc., highlighting their distinct financial strengths and weaknesses:
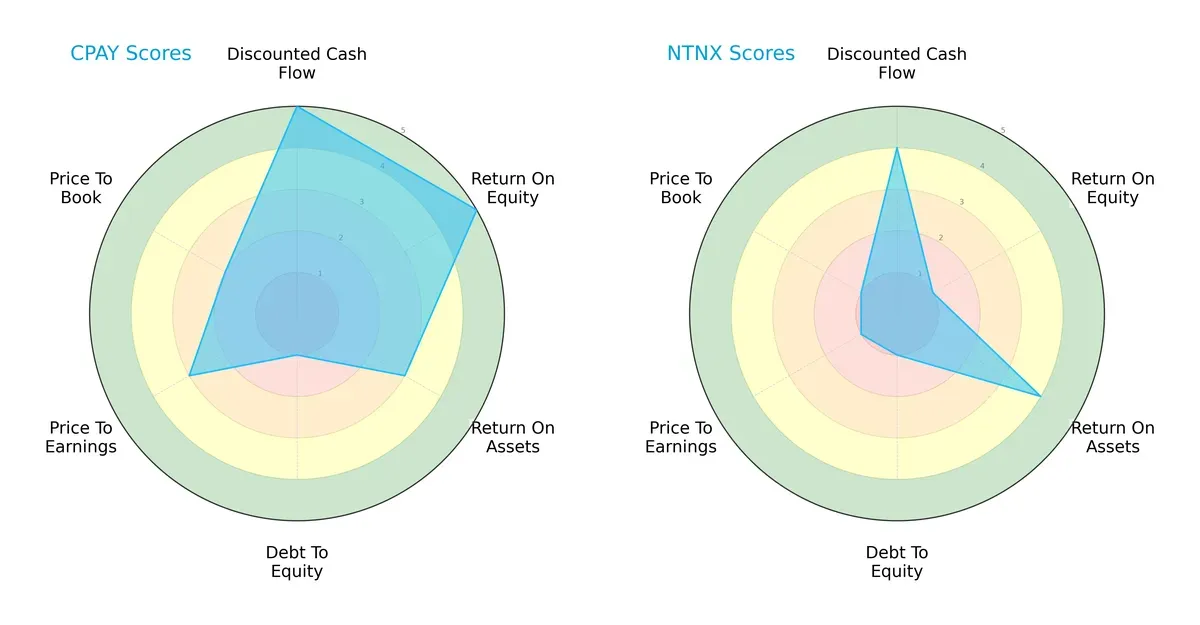
Corpay excels with very favorable discounted cash flow and return on equity scores, showing efficient capital allocation and profitability. Nutanix lags with weak ROE but performs moderately on ROA and DCF. Both firms share a very unfavorable debt-to-equity score, signaling heavy leverage risk. Corpay’s valuation metrics (PE/PB) are moderate to unfavorable, while Nutanix’s remain very unfavorable. Overall, Corpay presents a more balanced financial profile, whereas Nutanix relies on asset utilization amid valuation and leverage challenges.
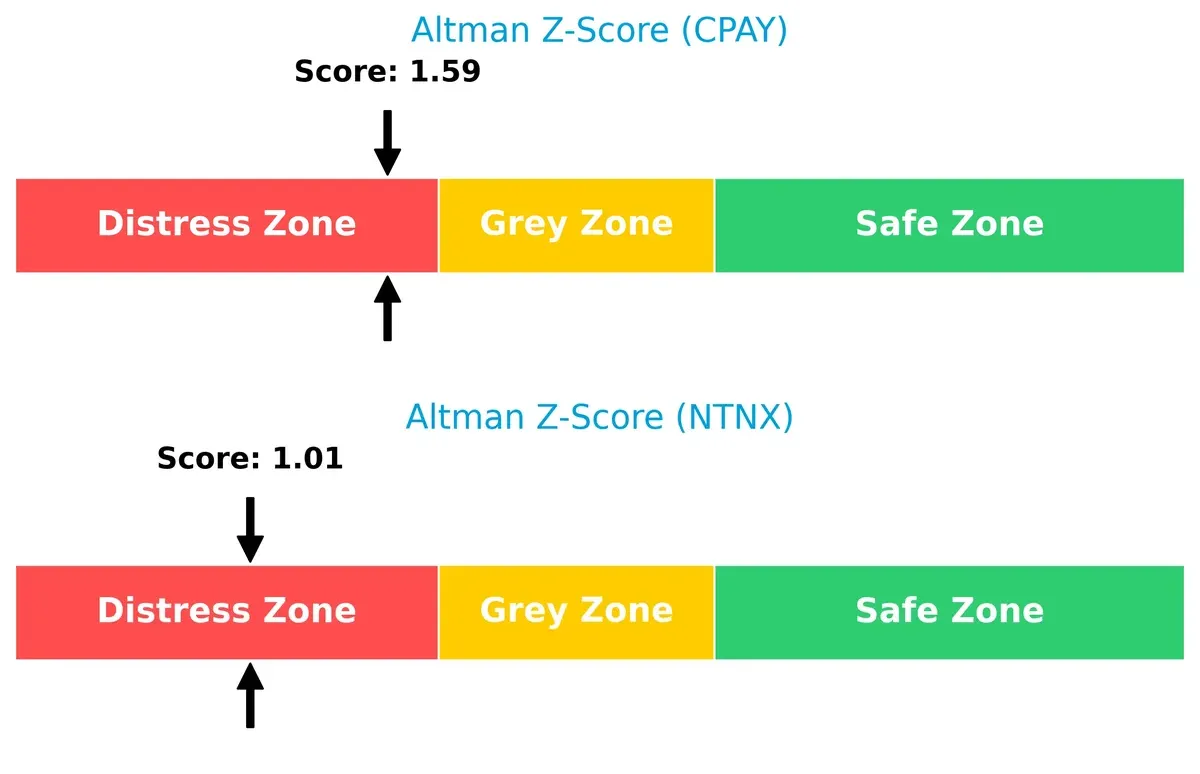
Bankruptcy Risk: Solvency Showdown
Corpay’s Altman Z-Score (1.59) slightly outperforms Nutanix’s (1.01), but both dwell in the distress zone, indicating elevated bankruptcy risk in this economic cycle:
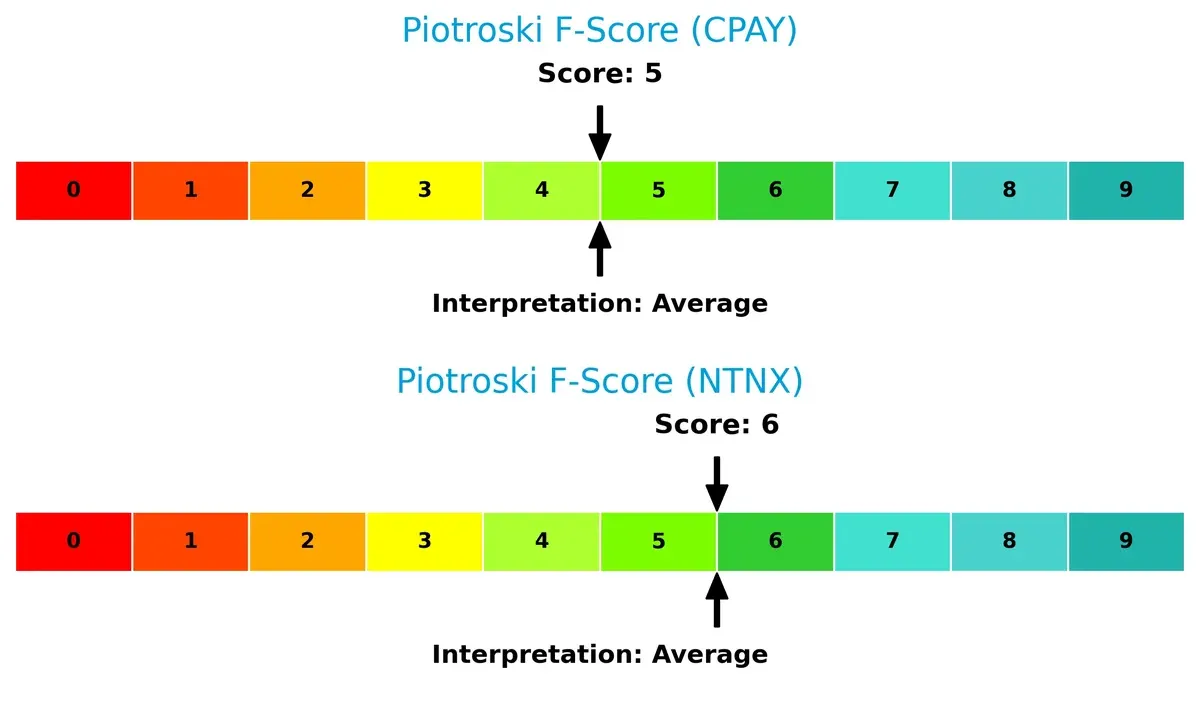
Financial Health: Quality of Operations
Corpay’s Piotroski F-Score of 5 and Nutanix’s 6 both indicate average financial health, with Nutanix showing marginally stronger internal metrics and fewer red flags:
How are the two companies positioned?
This section dissects the operational DNA of Corpay and Nutanix by comparing their revenue distribution and internal strengths and weaknesses. The goal is to confront their economic moats, identifying which model offers the most resilient, sustainable competitive advantage today.
Revenue Segmentation: The Strategic Mix
This visual comparison dissects how Corpay, Inc. and Nutanix, Inc. diversify their income streams and highlights their primary sector bets:
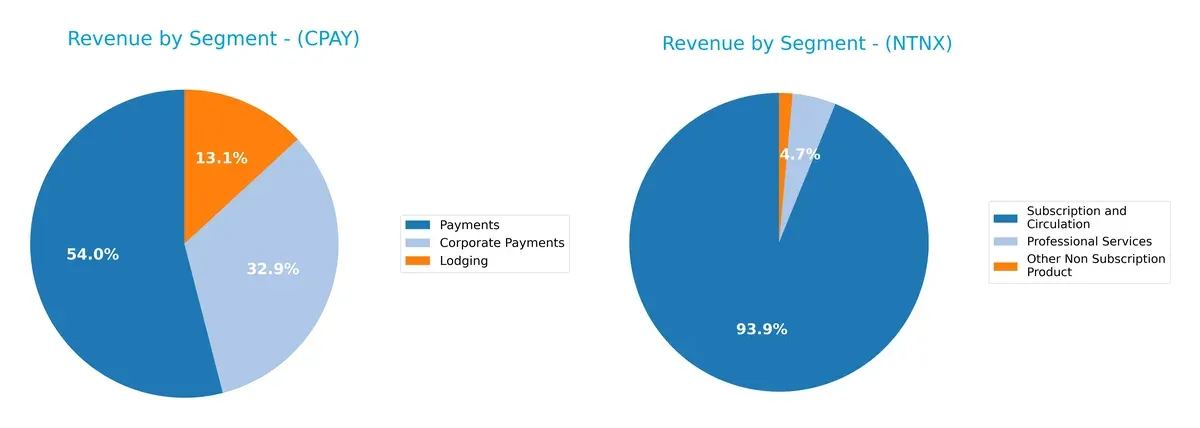
Corpay anchors its revenue on Payments at $2B, supplemented by Corporate Payments ($1.2B) and Lodging ($489M), showing moderate diversification. Nutanix pivots heavily on Subscription and Circulation with $2B, while Professional Services and Other Non Subscription Product together contribute under $110M, revealing a concentrated model. Corpay’s mix suggests balanced ecosystem exposure, while Nutanix faces concentration risk but leverages recurring revenue strength.
Strengths and Weaknesses Comparison
This table compares the Strengths and Weaknesses of Corpay, Inc. and Nutanix, Inc.:
Corpay Strengths
- Strong net margin of 23.62%
- High ROE at 27.55%
- Favorable fixed asset turnover of 9.59
- Diverse revenue across corporate payments, lodging, and payments
- Significant global presence in US, UK, and Brazil
Nutanix Strengths
- Favorable current and quick ratios at 1.72
- Strong interest coverage ratio of 11.15
- Favorable debt-to-equity and PB ratios
- Subscription-based revenue exceeding $2B highlights recurring income
- Global reach with strong US and EMEA sales
Corpay Weaknesses
- Unfavorable current ratio below 1.0
- High debt-to-equity at 2.58
- Low asset turnover at 0.17
- Unfavorable PB ratio of 5.43
- No dividend yield
Nutanix Weaknesses
- Negative ROE at -27.12% signals losses
- Extremely high PE ratio of 106.74
- Zero dividend yield
- Moderate debt-to-assets at 45%
- Net margin only neutral at 7.42%
Corpay excels in profitability and diversified revenue streams but faces liquidity and leverage challenges that could constrain flexibility. Nutanix shows solid liquidity and recurring revenue strength but struggles with profitability and high valuation multiples, indicating risk in capital efficiency and earnings quality.
The Moat Duel: Analyzing Competitive Defensibility
A structural moat is the only true shield protecting long-term profits from relentless competition and market pressures:
Corpay, Inc.: Switching Costs and Diversified Payment Solutions
Corpay’s moat stems from high switching costs embedded in its integrated vehicle and corporate payment platforms. Its 43% EBIT margin signals strong pricing power. Yet, declining ROIC warns of margin pressures. Expansion into new geographies in 2026 could deepen this moat but demands cautious monitoring.
Nutanix, Inc.: Network Effects and Hybrid Cloud Ecosystem
Nutanix’s moat is driven by powerful network effects in enterprise cloud management, evidenced by soaring revenue growth and a rapidly rising ROIC. Unlike Corpay, Nutanix leverages innovation in hybrid cloud orchestration, positioning itself for further market disruption and global expansion in 2026.
Switching Costs vs. Network Effects: The Moat Showdown
While both companies create value above WACC, Nutanix’s growing ROIC and explosive margin expansion reveal a deeper, more sustainable moat. Nutanix appears better equipped to defend and expand its market share amid evolving technology demands.
Which stock offers better returns?
The past year shows Corpay, Inc. with a strong upward trajectory and increasing buyer dominance, while Nutanix, Inc. experiences a sharp decline and seller pressure, highlighting contrasting trading dynamics.
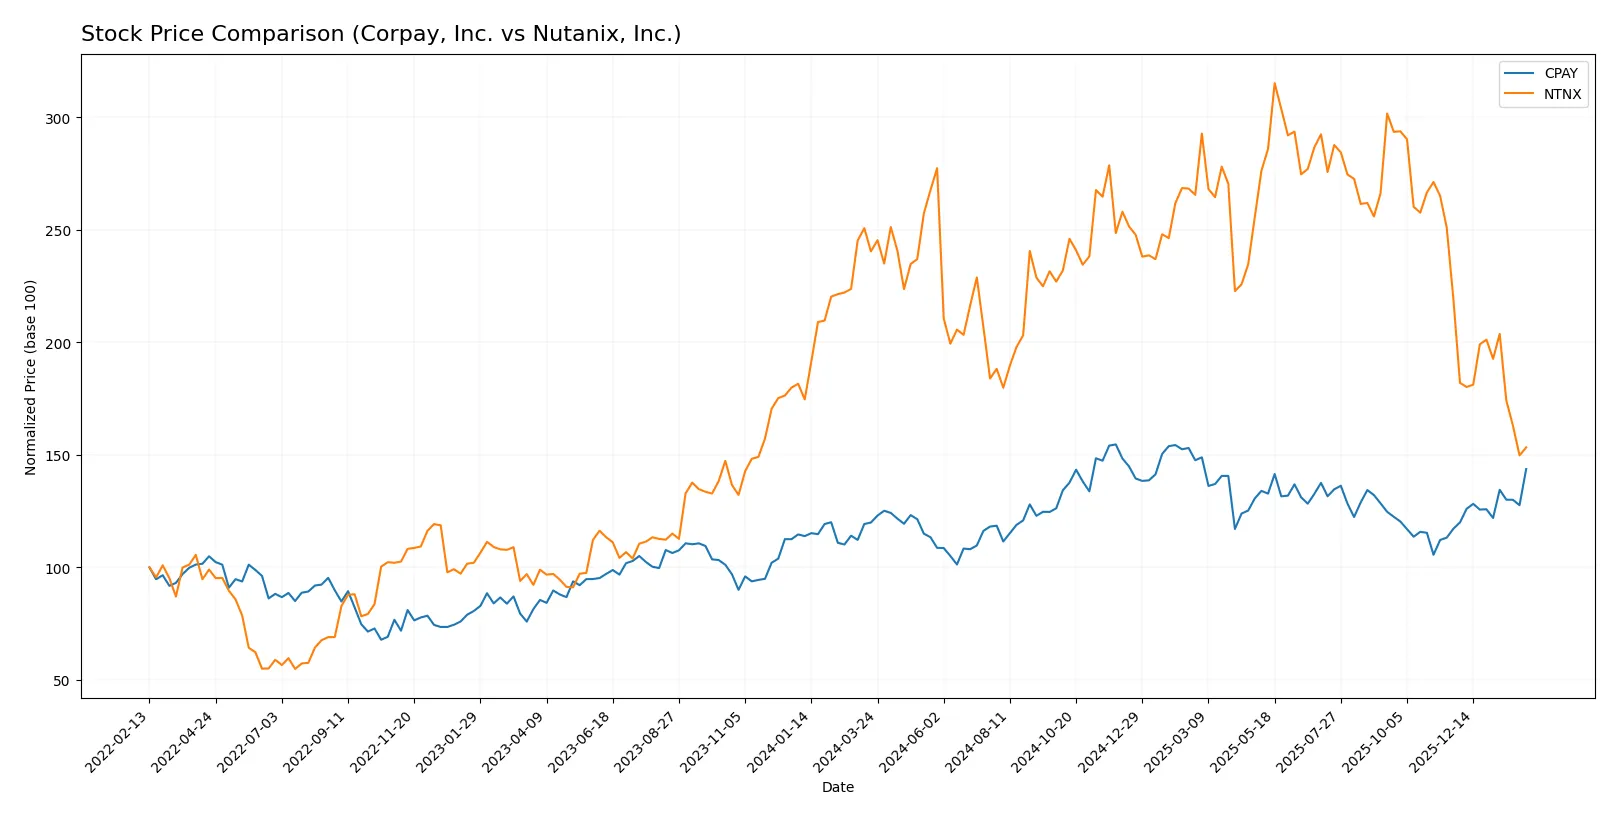
Trend Comparison
Corpay, Inc. posted a 19.8% price increase over the past 12 months, reflecting a bullish trend with accelerating momentum and high volatility, peaking at 381.18. Nutanix, Inc. suffered a 36.24% decline, trending bearish with deceleration and lower volatility, bottoming at 39.33. Corpay’s positive trend contrasts sharply with Nutanix’s downturn. Corpay delivered the highest market performance over the analyzed period.
Target Prices
Analysts present a clear consensus on target prices for Corpay, Inc. and Nutanix, Inc.
| Company | Target Low | Target High | Consensus |
|---|---|---|---|
| Corpay, Inc. | 300 | 390 | 359.33 |
| Nutanix, Inc. | 53 | 90 | 64.67 |
The target consensus for Corpay slightly exceeds its current price of 354.19, indicating modest upside potential. Nutanix’s consensus target price nearly doubles its current 40.26, reflecting stronger expected growth.

Don’t Let Luck Decide Your Entry Point
Optimize your entry points with our advanced ProRealTime indicators. You’ll get efficient buy signals with precise price targets for maximum performance. Start outperforming now!
How do institutions grade them?
Corpay, Inc. Grades
Here are the recent institutional grades for Corpay, Inc.:
| Grading Company | Action | New Grade | Date |
|---|---|---|---|
| Mizuho | Maintain | Neutral | 2026-02-06 |
| JP Morgan | Maintain | Overweight | 2026-02-05 |
| RBC Capital | Maintain | Sector Perform | 2026-02-05 |
| Morgan Stanley | Maintain | Overweight | 2026-02-05 |
| Morgan Stanley | Upgrade | Overweight | 2026-01-26 |
| Oppenheimer | Maintain | Outperform | 2026-01-12 |
| Oppenheimer | Upgrade | Outperform | 2025-12-05 |
| UBS | Maintain | Neutral | 2025-11-06 |
| RBC Capital | Maintain | Sector Perform | 2025-11-06 |
| JP Morgan | Maintain | Overweight | 2025-11-06 |
Nutanix, Inc. Grades
Here are the recent institutional grades for Nutanix, Inc.:
| Grading Company | Action | New Grade | Date |
|---|---|---|---|
| Barclays | Downgrade | Equal Weight | 2026-01-15 |
| Morgan Stanley | Downgrade | Equal Weight | 2026-01-12 |
| RBC Capital | Maintain | Outperform | 2026-01-05 |
| Goldman Sachs | Maintain | Buy | 2025-11-28 |
| Morgan Stanley | Maintain | Overweight | 2025-11-26 |
| B of A Securities | Maintain | Buy | 2025-11-26 |
| Keybanc | Maintain | Overweight | 2025-11-26 |
| Needham | Maintain | Buy | 2025-11-26 |
| Wells Fargo | Maintain | Equal Weight | 2025-11-26 |
| Northland Capital Markets | Maintain | Market Perform | 2025-11-26 |
Which company has the best grades?
Corpay, Inc. holds stronger and more consistent positive grades, including multiple “Overweight” and “Outperform” ratings. Nutanix, Inc. shows recent downgrades and mixed ratings, indicating more caution. Investors may view Corpay’s grades as a sign of more confident institutional support.
Risks specific to each company
The following categories identify critical pressure points and systemic threats facing Corpay, Inc. and Nutanix, Inc. in the 2026 market environment:
1. Market & Competition
Corpay, Inc.
- Faces intense competition in global payments with pressure on margins.
Nutanix, Inc.
- Competes in enterprise cloud with rapid innovation and pricing pressure.
2. Capital Structure & Debt
Corpay, Inc.
- High debt-to-equity ratio (2.58) signals elevated financial risk.
Nutanix, Inc.
- Negative debt-to-equity (-2.14) suggests complex balance sheet but lower financial leverage risk.
3. Stock Volatility
Corpay, Inc.
- Beta of 0.81 indicates moderate sensitivity to market swings.
Nutanix, Inc.
- Lower beta of 0.48 shows more defensive stock behavior amid volatility.
4. Regulatory & Legal
Corpay, Inc.
- Payment processing is exposed to evolving financial regulations globally.
Nutanix, Inc.
- Cloud services face data privacy and security regulations across jurisdictions.
5. Supply Chain & Operations
Corpay, Inc.
- Operations rely on complex international payments infrastructure.
Nutanix, Inc.
- Dependent on global data centers and cloud infrastructure reliability.
6. ESG & Climate Transition
Corpay, Inc.
- ESG efforts unreported but sector faces scrutiny on data and transaction sustainability.
Nutanix, Inc.
- Cloud providers pressured to reduce carbon footprint and improve governance standards.
7. Geopolitical Exposure
Corpay, Inc.
- Operates in multiple jurisdictions including Brazil and UK, sensitive to trade tensions.
Nutanix, Inc.
- Global footprint includes volatile regions, exposing it to geopolitical instability.
Which company shows a better risk-adjusted profile?
Corpay’s highest risk lies in its leveraged capital structure, which strains financial flexibility. Nutanix struggles with profitability and market valuation but maintains stronger liquidity and lower financial leverage. Nutanix’s more favorable debt metrics and lower stock volatility suggest a better risk-adjusted profile despite operational challenges. The recent high debt-to-equity ratio for Corpay and Nutanix’s negative debt-to-equity highlight contrasting capital risks that justify caution for both investors.
Final Verdict: Which stock to choose?
Corpay, Inc. excels as a cash machine with strong profitability and efficient capital use, generating consistent value despite a slight dip in ROIC. Its leverage and liquidity warrant vigilance. It suits investors chasing aggressive growth with a tolerance for financial risk.
Nutanix, Inc. commands a strategic moat through its cloud dominance and accelerating profitability, supported by robust liquidity and improving capital returns. It offers a safer profile compared to Corpay but trades at a premium with stretched valuation. Fits well in a GARP portfolio seeking growth balanced with stability.
If you prioritize aggressive profit generation and capital efficiency, Corpay outshines thanks to its solid income and value creation, albeit with higher financial risk. However, if you seek sustainable growth with a durable competitive advantage and better liquidity, Nutanix offers superior stability despite its recent bearish trend and valuation concerns.
Disclaimer: Investment carries a risk of loss of initial capital. The past performance is not a reliable indicator of future results. Be sure to understand risks before making an investment decision.
Go Further
I encourage you to read the complete analyses of Corpay, Inc. and Nutanix, Inc. to enhance your investment decisions: