Home > Comparison > Technology > CPAY vs INFA
The strategic rivalry between Corpay, Inc. and Informatica Inc. shapes the evolving landscape of the technology sector. Corpay operates as a capital-intensive payments company serving global vehicle and corporate expense management. In contrast, Informatica delivers a high-margin, AI-driven data integration platform for enterprise-scale cloud environments. This analysis pits Corpay’s operational scale against Informatica’s innovation edge to identify which path offers a superior risk-adjusted return for diversified investors.

Table of contents
Companies Overview
Corpay and Informatica hold pivotal roles in the software infrastructure market, shaping payment and data management landscapes respectively.
Corpay, Inc.: Payments Infrastructure Leader
Corpay operates primarily as a payments company serving businesses and consumers globally. Its core revenue stems from vehicle-related expense management, corporate payments, and prepaid card solutions. In 2026, Corpay focuses strategically on expanding cross-border payment capabilities and automating accounts payable to enhance client efficiency.
Informatica Inc.: Data Management Powerhouse
Informatica specializes in an AI-driven data platform that integrates, cleanses, and governs enterprise data across multi-cloud and hybrid environments. Its revenue relies on subscription sales of interoperable data products. The firm’s 2026 strategy emphasizes scaling governance and privacy offerings to meet increasing regulatory demands.
Strategic Collision: Similarities & Divergences
Both Corpay and Informatica operate in software infrastructure but pursue contrasting philosophies. Corpay adopts a broad payments ecosystem approach, while Informatica champions an integrated AI-powered data fabric. Their primary battleground lies in enterprise digital transformation, where seamless payment or data workflows matter. The companies present distinct profiles: Corpay leverages scale and payment expertise; Informatica offers deep data governance specialization.
Income Statement Comparison
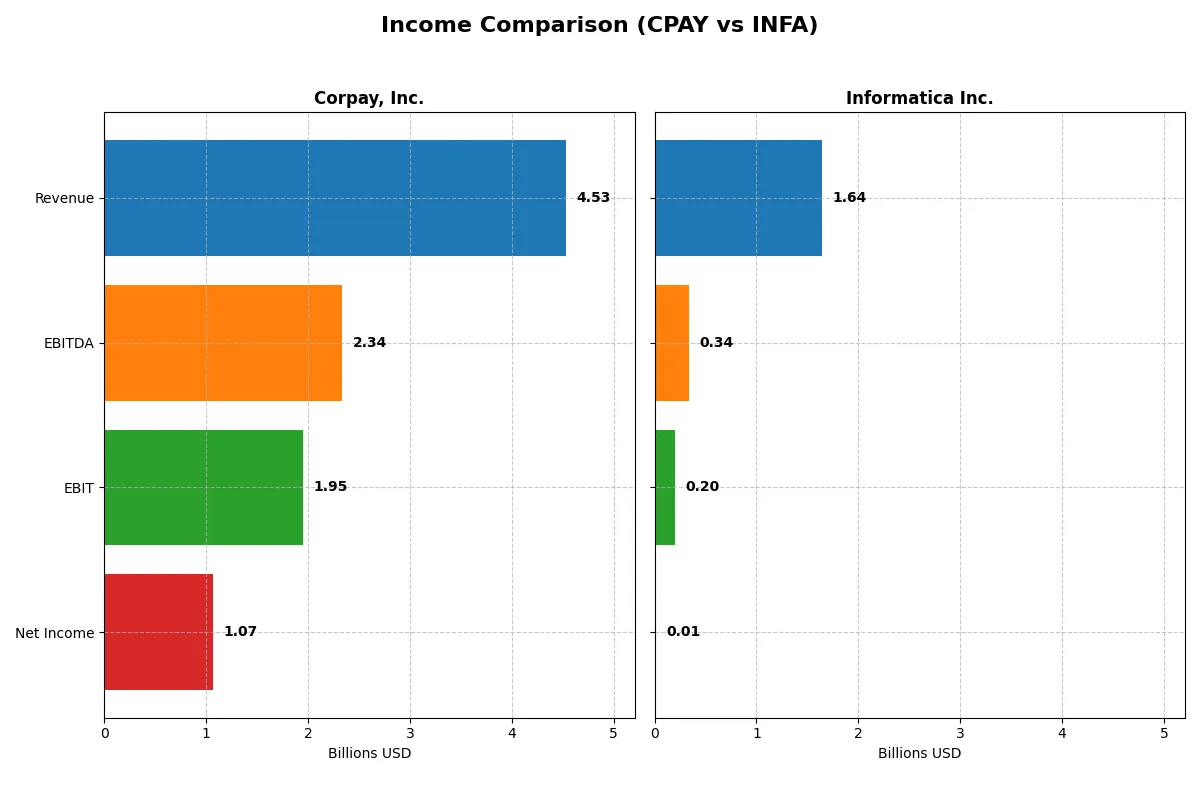
The following data dissects the core profitability and scalability of both corporate engines to reveal who dominates the bottom line:
| Metric | Corpay, Inc. (CPAY) | Informatica Inc. (INFA) |
|---|---|---|
| Revenue | 4.53B | 1.64B |
| Cost of Revenue | 1.36B | 326M |
| Operating Expenses | 1.21B | 1.19B |
| Gross Profit | 3.17B | 1.31B |
| EBITDA | 2.34B | 339M |
| EBIT | 1.95B | 199M |
| Interest Expense | 404M | 146M |
| Net Income | 1.07B | 9.93M |
| EPS | 15.25 | 0.033 |
| Fiscal Year | 2025 | 2024 |
Income Statement Analysis: The Bottom-Line Duel
The upcoming income statement comparison reveals which company runs a more efficient and profitable corporate engine through recent financial performance.
Corpay, Inc. Analysis
Corpay’s revenue climbed robustly from 2.8B in 2021 to 4.5B in 2025, showing strong top-line momentum. Net income also grew steadily to 1.07B in 2025. Margins remain healthy, with a gross margin near 70% and net margin above 23%, reflecting disciplined cost control and operational leverage. The 2025 year marks continued efficiency gains despite a slight dip in net margin growth.
Informatica Inc. Analysis
Informatica’s revenues rose modestly from 1.3B in 2020 to 1.64B in 2024, with net income turning positive in 2024 at just under 10M after prior losses. The firm maintains a high gross margin around 80%, but net margin lags at 0.6%, indicating heavier operating expenses. Recent years show strong EBIT and net margin improvements, signaling a potential turnaround in profitability momentum.
Margin Strength vs. Profit Scale
Corpay delivers higher revenue and net income with consistent margin strength, while Informatica exhibits margin expansion from a low baseline but remains far behind in absolute profit. Corpay’s scale and margin health make it the fundamental winner in efficiency and earnings power. For investors, Corpay’s profile offers steadier profitability and growth, whereas Informatica’s turnaround carries more risk but potential upside.
Financial Ratios Comparison
These vital ratios act as a diagnostic tool to expose the underlying fiscal health, valuation premiums, and capital efficiency of each company:
| Ratios | Corpay, Inc. (CPAY) | Informatica Inc. (INFA) |
|---|---|---|
| ROE | 27.5% | 0.43% |
| ROIC | 8.8% | 0.56% |
| P/E | 19.7 | 788.0 |
| P/B | 5.43 | 3.39 |
| Current Ratio | 0.98 | 1.82 |
| Quick Ratio | 0.98 | 1.82 |
| D/E | 2.58 | 0.81 |
| Debt-to-Assets | 37.9% | 35.2% |
| Interest Coverage | 4.83 | 0.87 |
| Asset Turnover | 0.17 | 0.31 |
| Fixed Asset Turnover | 9.59 | 8.75 |
| Payout ratio | 0 | 0.12% |
| Dividend yield | 0 | 0.00015% |
| Fiscal Year | 2025 | 2024 |
Efficiency & Valuation Duel: The Vital Signs
Financial ratios act as a company’s DNA, revealing hidden risks and operational strength behind headline numbers.
Corpay, Inc.
Corpay boasts a strong 27.55% ROE and a healthy 23.62% net margin, signaling solid profitability. Its P/E of 19.73 appears fairly valued, though a high PB ratio of 5.43 suggests some price premium. The firm pays no dividend, instead reinvesting capital to sustain growth and operational efficiency. However, its current ratio below 1 highlights liquidity concerns.
Informatica Inc.
Informatica lacks available key ratios for a detailed analysis, limiting insight into its profitability and valuation. The missing data on critical metrics, including returns and valuation multiples, restricts any comprehensive operational or risk assessment. Without dividend or reinvestment information, the shareholder return profile remains unclear, raising transparency issues.
Profitability Visibility vs. Data Darkness
Corpay offers a clearer picture of operational efficiency and valuation balance, despite some liquidity and leverage concerns. Informatica’s missing ratio data increases uncertainty, making risk assessment difficult. Investors seeking transparency and measurable profitability may gravitate toward Corpay’s more visible financial profile.
Which one offers the Superior Shareholder Reward?
Corpay, Inc. (CPAY) offers a superior shareholder reward compared to Informatica Inc. (INFA) in 2026. CPAY pays no dividends but maintains a strong free cash flow per share (~$18.5) and executes aggressive buybacks, supporting sustainable capital return. INFA pays a negligible dividend yield near zero and shows weak profitability with a 0.6% net margin. CPAY’s payout-free model and high cash flow coverage contrast with INFA’s low profitability and minimal shareholder distributions. Thus, CPAY’s total return profile, driven by healthy FCF and buybacks, appears much more attractive for long-term investors.
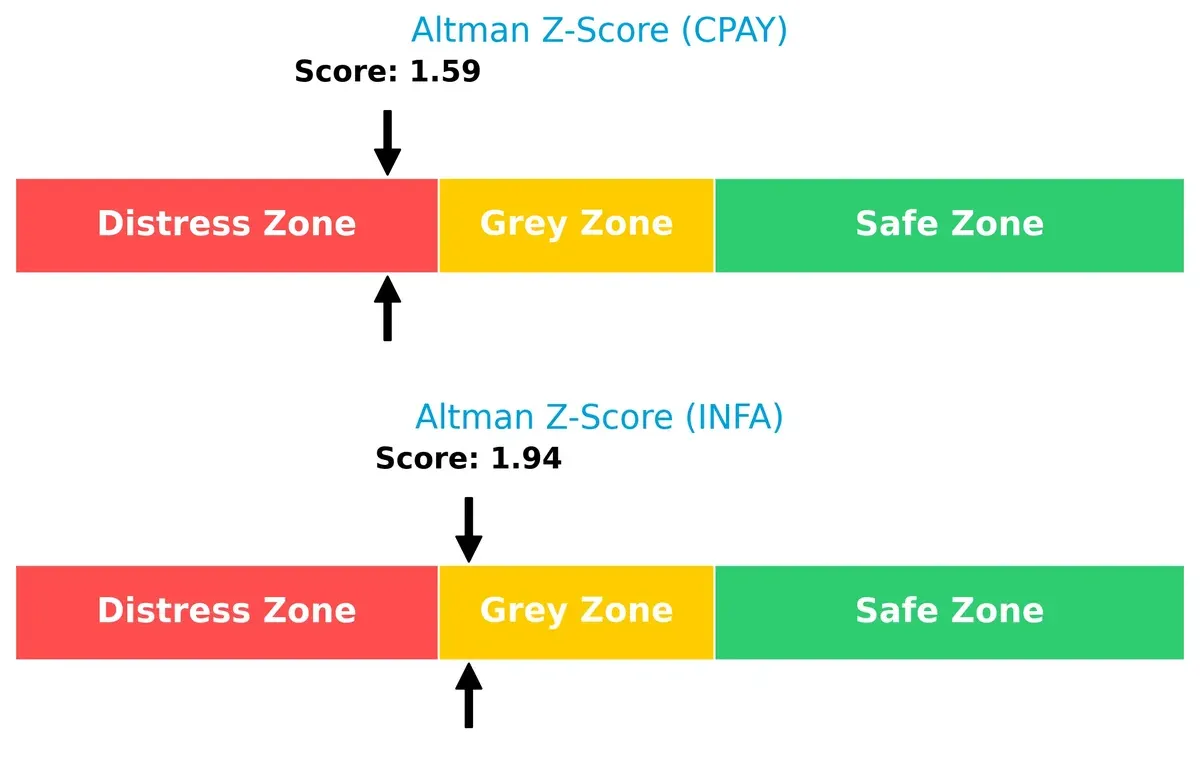
Bankruptcy Risk: Solvency Showdown
The Altman Z-Score comparison reveals Corpay, Inc. (1.59) is deep in the distress zone, signaling high bankruptcy risk. Informatica Inc. (1.94) sits in the grey zone, indicating moderate survival chances in this cycle:
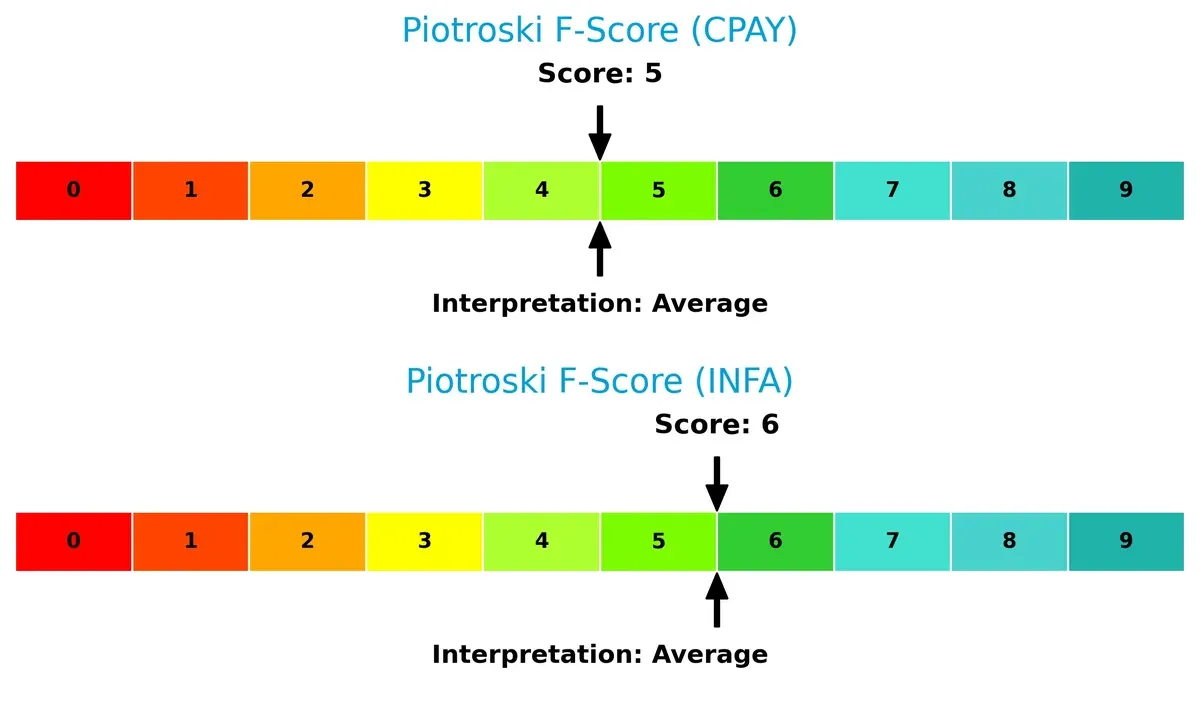
Financial Health: Quality of Operations
Corpay scores 5 and Informatica 6 on the Piotroski scale, both reflecting average financial health. Informatica edges Corpay slightly, with no glaring red flags in either firm’s internal metrics:
How are the two companies positioned?
This section dissects the operational DNA of Corpay and Informatica by comparing their revenue distribution and internal dynamics. The goal is to confront their economic moats and identify which model offers the most resilient and sustainable competitive advantage today.
Revenue Segmentation: The Strategic Mix
This visual comparison dissects how Corpay, Inc. and Informatica Inc. diversify their income streams and where their primary sector bets lie:
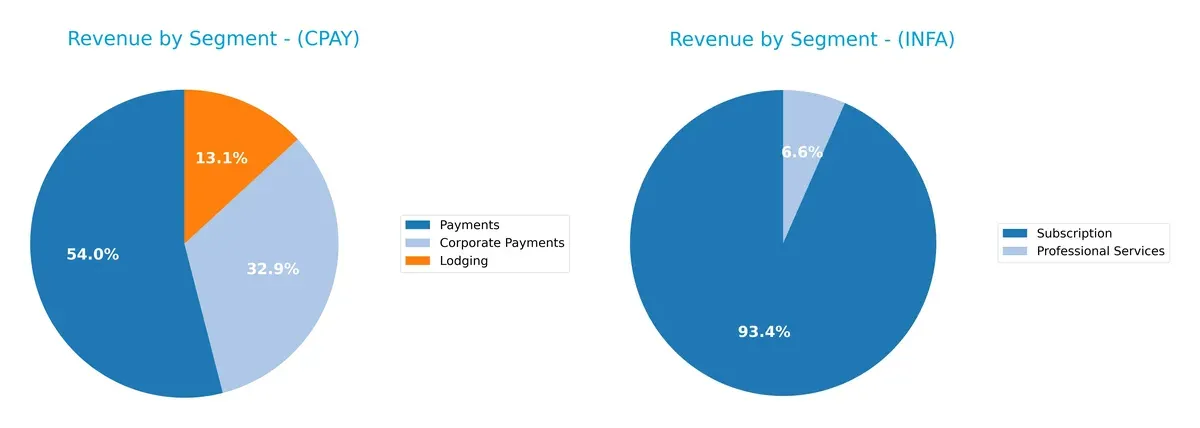
Corpay anchors 2B in Payments, which dwarfs its 1.22B Corporate Payments and 489M Lodging segments, showing moderate diversification. Informatica pivots on Subscription revenue, totaling 1.1B, while Professional Services contribute just 78M, revealing a concentrated, SaaS-focused model. Corpay’s mix suggests ecosystem lock-in in payments infrastructure, while Informatica’s reliance on subscription highlights exposure to recurring revenue trends but risks from limited segment breadth.
Strengths and Weaknesses Comparison
This table compares the Strengths and Weaknesses of Corpay and Informatica:
Corpay Strengths
- Diverse revenue streams across Corporate Payments, Lodging, and Payments
- Strong profitability with 23.62% net margin
- Favorable return on equity at 27.55%
- Solid global presence in US, UK, and Brazil
Informatica Strengths
- Growing subscription revenue exceeding 1B USD
- Consistent geographic diversification across North America, EMEA, Asia Pacific, and Latin America
- Recurring revenue model with cloud and subscription focus
Corpay Weaknesses
- Low current ratio at 0.98 signals liquidity risk
- High debt-to-equity ratio of 2.58 is a financial leverage concern
- Unfavorable price-to-book ratio at 5.43
- Modest asset turnover of 0.17 limits efficiency
Informatica Weaknesses
- Lack of available financial ratio data limits transparent profitability and leverage assessment
- Heavy reliance on subscription and professional services segments may affect diversification
Corpay’s strengths lie in its profitability and geographic reach, but liquidity and leverage ratios raise caution. Informatica excels in subscription revenue and global diversification, yet missing financial metrics obscure a full risk picture. Both companies must balance growth with financial discipline in their strategies.
The Moat Duel: Analyzing Competitive Defensibility
A structural moat is the only true shield protecting long-term profits from relentless competitive erosion. Let’s dive into the moat dynamics of two software infrastructure firms:
Corpay, Inc.: Cost Advantage and Operational Efficiency
Corpay leverages a robust cost advantage through its integrated payment solutions across global markets. This moat shows in its high EBIT margin of 43.1% and consistent revenue growth of 13.9% in 2025. However, its declining ROIC trend signals pressure on profitability that new product launches or geographic expansion must address to deepen the moat.
Informatica Inc.: Intangible Asset Moat via AI-Driven Data Integration
Informatica’s moat stems from its AI-powered data platform and intellectual property, creating switching costs for enterprise clients. Though its net margin remains slim at 0.6%, the firm shows strong net income and EPS growth over five years. Informatica’s focus on multi-cloud integration could disrupt markets further but must overcome slower revenue growth to widen its moat.
Cost Efficiency vs. Intangible Innovation: Who Holds the Advantage?
Corpay’s cost-driven moat currently offers wider margin protection and value creation, despite a declining ROIC trend. Informatica’s intangible asset moat promises depth through technology but needs faster top-line growth to solidify defenses. Corpay appears better positioned to defend its market share in the near term, but Informatica’s innovation potential could shift the balance if execution accelerates.
Which stock offers better returns?
Over the past year, Corpay, Inc. demonstrated strong upward momentum with accelerating gains, while Informatica Inc. showed a declining trend with recent stabilization near flat performance.
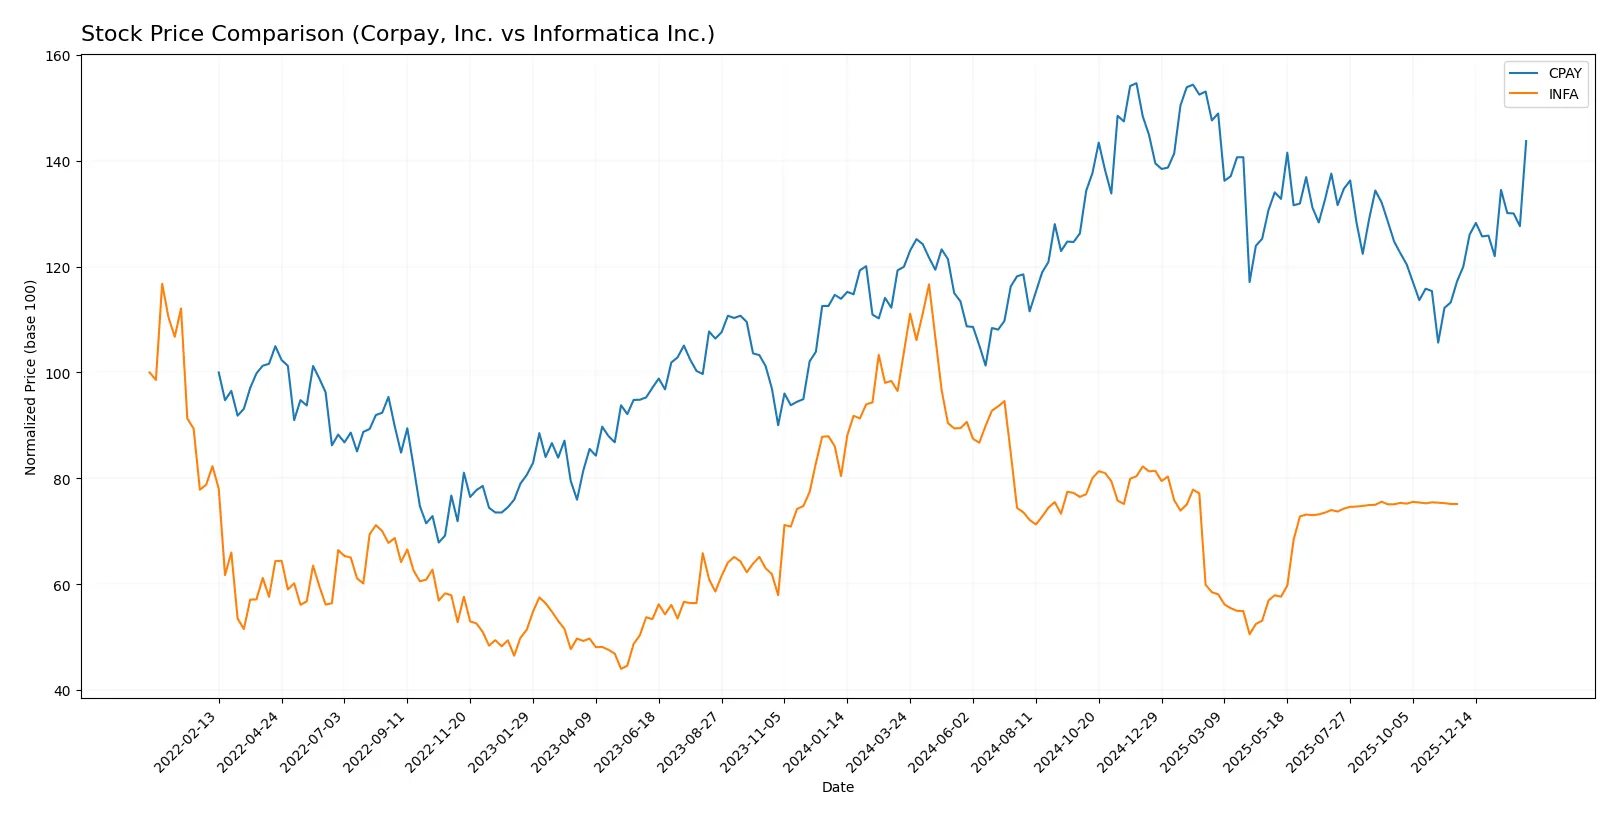
Trend Comparison
Corpay, Inc. posted a 19.8% price increase over the past 12 months, marking a bullish trend with accelerating momentum and significant volatility (31.25 std dev). Its price ranged between 249.66 and 381.18.
Informatica Inc. experienced a 12.68% decline in the same period, reflecting a bearish trend despite accelerating downtrend. Volatility remained low (4.46 std dev), with prices fluctuating between 16.67 and 38.48.
Corpay’s bullish trend and substantial price appreciation outperformed Informatica’s bearish, nearly flat recent trend, delivering the highest market return over the past year.
Target Prices
Analysts present a mixed yet constructive target consensus for Corpay, Inc. and Informatica Inc.
| Company | Target Low | Target High | Consensus |
|---|---|---|---|
| Corpay, Inc. | 300 | 390 | 359.33 |
| Informatica Inc. | 18 | 44 | 26.67 |
Corpay’s consensus target sits slightly above its current price of $354, signaling moderate upside potential. Informatica’s target consensus exceeds its current $24.79 price, suggesting growth expectations despite wider target range uncertainty.

Don’t Let Luck Decide Your Entry Point
Optimize your entry points with our advanced ProRealTime indicators. You’ll get efficient buy signals with precise price targets for maximum performance. Start outperforming now!
How do institutions grade them?
Corpay, Inc. Grades
The table below summarizes recent institutional grades for Corpay, Inc.:
| Grading Company | Action | New Grade | Date |
|---|---|---|---|
| Mizuho | maintain | Neutral | 2026-02-06 |
| JP Morgan | maintain | Overweight | 2026-02-05 |
| RBC Capital | maintain | Sector Perform | 2026-02-05 |
| Morgan Stanley | maintain | Overweight | 2026-02-05 |
| Morgan Stanley | upgrade | Overweight | 2026-01-26 |
| Oppenheimer | maintain | Outperform | 2026-01-12 |
| Oppenheimer | upgrade | Outperform | 2025-12-05 |
| UBS | maintain | Neutral | 2025-11-06 |
| RBC Capital | maintain | Sector Perform | 2025-11-06 |
| JP Morgan | maintain | Overweight | 2025-11-06 |
Informatica Inc. Grades
The table below summarizes recent institutional grades for Informatica Inc.:
| Grading Company | Action | New Grade | Date |
|---|---|---|---|
| Guggenheim | downgrade | Neutral | 2025-08-07 |
| UBS | maintain | Neutral | 2025-08-07 |
| Baird | maintain | Neutral | 2025-05-28 |
| JP Morgan | downgrade | Neutral | 2025-05-28 |
| RBC Capital | maintain | Sector Perform | 2025-05-28 |
| Wolfe Research | downgrade | Peer Perform | 2025-05-28 |
| Wells Fargo | maintain | Equal Weight | 2025-05-28 |
| Truist Securities | downgrade | Hold | 2025-05-28 |
| RBC Capital | maintain | Sector Perform | 2025-05-27 |
| UBS | maintain | Neutral | 2025-05-16 |
Which company has the best grades?
Corpay, Inc. consistently receives higher grades, including multiple Overweight and Outperform ratings. Informatica Inc. shows a pattern of downgrades and Neutral holds. Investors might interpret Corpay’s grades as stronger institutional confidence.
Risks specific to each company
The following categories identify the critical pressure points and systemic threats facing both firms in the 2026 market environment:
1. Market & Competition
Corpay, Inc.
- Faces intense competition in payment solutions with pressure on pricing and innovation.
Informatica Inc.
- Competes in AI-powered data management with rapid tech shifts and strong cloud rivals.
2. Capital Structure & Debt
Corpay, Inc.
- High debt-to-equity ratio (2.58) signals elevated financial risk and potential leverage strain.
Informatica Inc.
- Debt profile data unavailable, implying uncertainty in assessing financial leverage risks.
3. Stock Volatility
Corpay, Inc.
- Beta at 0.81 indicates lower volatility than market, offering relative stock price stability.
Informatica Inc.
- Beta at 1.14 suggests higher volatility and sensitivity to market swings.
4. Regulatory & Legal
Corpay, Inc.
- Exposure to financial regulations across multiple jurisdictions could impact compliance costs.
Informatica Inc.
- Faces data privacy laws and compliance risks in multi-cloud and hybrid environments.
5. Supply Chain & Operations
Corpay, Inc.
- Operations depend on payment networks and global logistics, vulnerable to disruptions.
Informatica Inc.
- Relies on cloud infrastructure providers; disruptions could impair service delivery.
6. ESG & Climate Transition
Corpay, Inc.
- Limited ESG disclosure; transition risks in fuel-related payments amid climate policies.
Informatica Inc.
- Potential opportunity in enabling clients’ ESG data management, but limited direct exposure.
7. Geopolitical Exposure
Corpay, Inc.
- International operations in US, UK, Brazil expose it to geopolitical and currency risks.
Informatica Inc.
- Primarily US-based with global clients; geopolitical risks tied to data sovereignty and trade policies.
Which company shows a better risk-adjusted profile?
Corpay’s most pressing risk is its elevated leverage, reflected in a debt-to-equity ratio that may strain capital allocation during downturns. Informatica’s key risk is its higher stock volatility and regulatory complexity in evolving data privacy laws. Corpay shows a weaker risk-adjusted profile due to financial distress signals, while Informatica’s risk profile remains less defined but potentially more volatile. Corpay’s Altman Z-score in the distress zone contrasts with Informatica’s grey zone score, underscoring Corpay’s elevated bankruptcy risk.
Final Verdict: Which stock to choose?
Corpay, Inc. excels as a cash-generating engine with strong profitability and a clear value-creation edge over its cost of capital. Its key point of vigilance lies in its elevated leverage and tight liquidity, which could pressure stability in downturns. It suits portfolios aiming for aggressive growth with a tolerance for financial risk.
Informatica Inc. offers a strategic moat through its specialized data management solutions and robust recurring revenue streams. Compared to Corpay, it presents a steadier balance sheet and more conservative financial risk, appealing to investors favoring growth at a reasonable price with a focus on stability over rapid expansion.
If you prioritize aggressive growth and value creation, Corpay outshines with superior operating margins and cash flow generation despite leverage concerns. However, if you seek steadier income and lower financial risk, Informatica offers better stability through its recurring revenue model and stronger liquidity, albeit without Corpay’s current growth momentum.
Disclaimer: Investment carries a risk of loss of initial capital. The past performance is not a reliable indicator of future results. Be sure to understand risks before making an investment decision.
Go Further
I encourage you to read the complete analyses of Corpay, Inc. and Informatica Inc. to enhance your investment decisions: