Home > Comparison > Technology > FTNT vs CPAY
The strategic rivalry between Fortinet, Inc. and Corpay, Inc. shapes the evolving landscape of the technology sector. Fortinet operates as a cybersecurity infrastructure leader, delivering integrated hardware and software solutions. In contrast, Corpay specializes in payment infrastructure, focusing on corporate and vehicle-related expense management. This analysis pits Fortinet’s security innovation against Corpay’s transaction efficiency to determine which offers superior risk-adjusted returns for a diversified portfolio.
Table of contents
Companies Overview
Fortinet and Corpay hold critical positions in the infrastructure software market, shaping cybersecurity and payment solutions respectively.
Fortinet, Inc.: Cybersecurity Infrastructure Leader
Fortinet dominates the cybersecurity infrastructure sector with its integrated and automated security solutions. It generates revenue primarily through hardware and software licenses like FortiGate firewalls and FortiSwitch secure networking products. In 2026, the company’s strategic focus is on expanding its broad portfolio of security services and reinforcing its global reach across multiple industries including government and finance.
Corpay, Inc.: Corporate Payments Innovator
Corpay excels in the payments infrastructure space by offering comprehensive vehicle and corporate payment solutions. Its revenue stems from managing fuel, tolls, lodging, and corporate payments with added services like accounts payable automation and virtual cards. In 2026, Corpay prioritizes growth in cross-border payment products and enhancing its corporate travel and expense management capabilities worldwide.
Strategic Collision: Similarities & Divergences
Both companies operate in the software infrastructure industry but pursue distinct business models. Fortinet emphasizes a closed ecosystem of cybersecurity products, while Corpay focuses on open, scalable payment solutions. They compete indirectly in enterprise IT budgets, with Fortinet battling for security spend and Corpay for payment processing. Their investment profiles diverge sharply: Fortinet appeals to growth investors seeking tech-driven security leadership; Corpay attracts those favoring steady cash flows from transaction-based services.
Income Statement Comparison
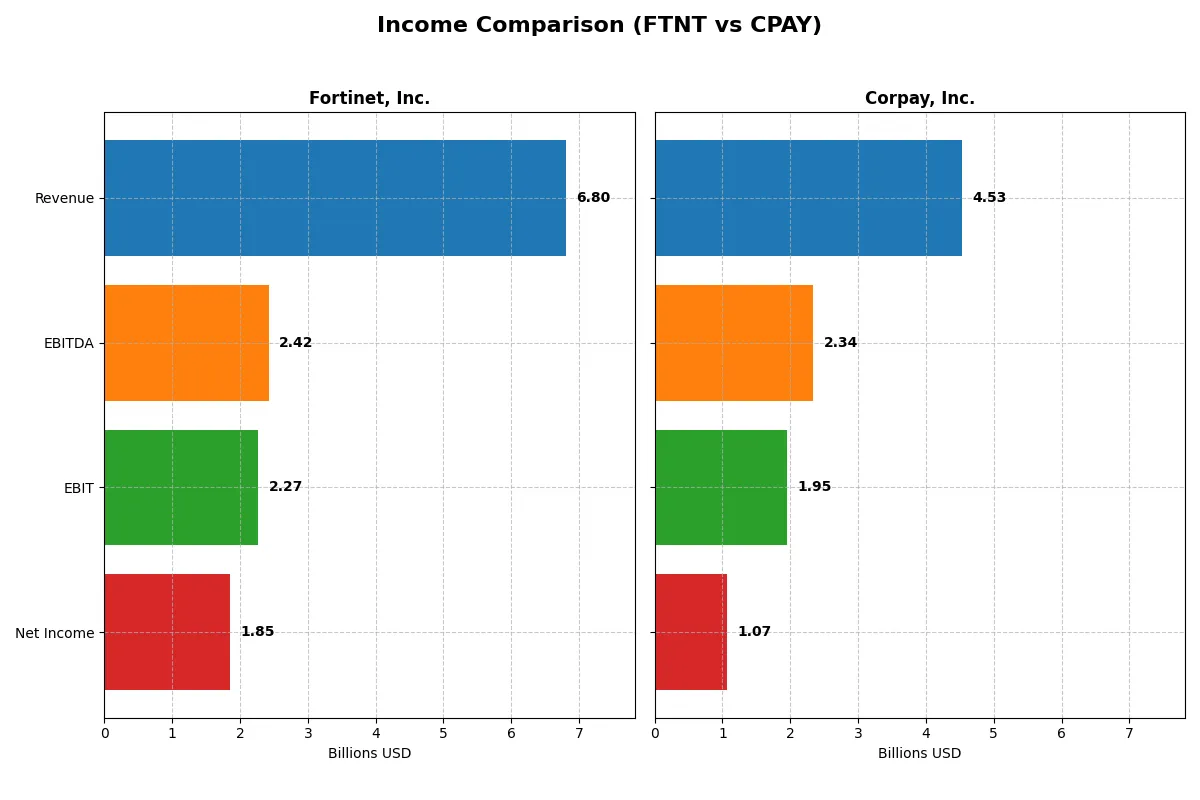
This data dissects the core profitability and scalability of both corporate engines, revealing who dominates the bottom line:
| Metric | Fortinet, Inc. (FTNT) | Corpay, Inc. (CPAY) |
|---|---|---|
| Revenue | 6.8B | 4.5B |
| Cost of Revenue | 1.3B | 1.4B |
| Operating Expenses | 3.4B | 1.2B |
| Gross Profit | 5.5B | 3.2B |
| EBITDA | 2.4B | 2.3B |
| EBIT | 2.3B | 2.0B |
| Interest Expense | 20M | 404M |
| Net Income | 1.9B | 1.1B |
| EPS | 2.44 | 15.25 |
| Fiscal Year | 2025 | 2025 |
Income Statement Analysis: The Bottom-Line Duel
This income statement comparison reveals which company operates its business more efficiently and delivers superior profitability.
Fortinet, Inc. Analysis
Fortinet’s revenue grew from $3.3B in 2021 to $6.8B in 2025, more than doubling over five years. Net income surged from $607M to $1.85B, reflecting strong margin expansion. Its gross margin remains robust near 81%, while net margin hovers around 27%, signaling excellent operational control and consistent profitability momentum in 2025.
Corpay, Inc. Analysis
Corpay’s revenue increased from $2.8B in 2021 to $4.5B in 2025, a solid 60% rise. Net income climbed from $839M to $1.07B, with a gross margin near 70% and net margin at 24%. Despite healthy revenue growth and steady EBIT margin exceeding 43%, net margin declined slightly, reflecting some cost pressure in 2025.
Margin Strength vs. Scale Expansion
Fortinet outpaces Corpay with stronger revenue and net income growth, underpinned by superior gross and net margins. Fortinet’s ability to nearly triple net income since 2021 demonstrates a more efficient business model. For investors prioritizing margin quality and scale, Fortinet’s profile offers a more compelling route to value creation.
Financial Ratios Comparison
These vital ratios act as a diagnostic tool to expose the underlying fiscal health, valuation premiums, and capital efficiency of the companies analyzed:
| Ratios | Fortinet, Inc. (FTNT) | Corpay, Inc. (CPAY) |
|---|---|---|
| ROE | 1.50 | 0.28 |
| ROIC | 0.29 | 0.09 |
| P/E | 32.48 | 19.73 |
| P/B | 48.64 | 5.43 |
| Current Ratio | 1.17 | 0.98 |
| Quick Ratio | 1.09 | 0.98 |
| D/E (Debt to Equity) | 0.81 | 2.58 |
| Debt-to-Assets | 0.10 | 0.38 |
| Interest Coverage | 103.72 | 4.83 |
| Asset Turnover | 0.65 | 0.17 |
| Fixed Asset Turnover | 4.20 | 9.59 |
| Payout Ratio | 0 | 0 |
| Dividend Yield | 0 | 0 |
| Fiscal Year | 2025 | 2025 |
Efficiency & Valuation Duel: The Vital Signs
Financial ratios act as a company’s DNA, revealing hidden risks and operational excellence crucial for investors’ decisions in 2026.
Fortinet, Inc.
Fortinet exhibits exceptional profitability with a ROE of 150% and a strong net margin of 27%. Its valuation appears stretched, marked by a high P/E of 32.5 and a PB of 48.6. The firm reinvests heavily in R&D, foregoing dividends to fuel growth and maintain operational efficiency.
Corpay, Inc.
Corpay shows solid profitability, with a ROE of 27.5% and a net margin of 23.6%. Its valuation is more moderate, featuring a P/E of 19.7 but an unfavorable PB of 5.4. The company pays no dividends and operates with higher leverage, focusing on managing debt rather than shareholder returns.
Premium Valuation vs. Operational Safety
Fortinet’s high profitability contrasts with its stretched valuation and no dividend payout. Corpay offers a more balanced valuation but carries higher debt and weaker operational metrics. Fortinet suits growth-focused investors, while Corpay fits those prioritizing moderate valuation and cautious risk.
Which one offers the Superior Shareholder Reward?
I observe Fortinet (FTNT) and Corpay (CPAY) both forgo dividends, reinvesting free cash flow into growth. FTNT’s payout ratio is zero, with no dividend yield, yet it maintains a strong free cash flow per share of $2.94 and robust operating margins near 30%. Its buyback program is modest, limiting shareholder returns from repurchases. Meanwhile, CPAY also pays no dividends but delivers a higher free cash flow per share of $18.5, supported by a solid free cash flow conversion ratio of about 87%. CPAY’s aggressive buyback activity and lower valuation multiples (P/E ~20 vs. FTNT’s 32) enhance its shareholder reward profile. However, CPAY’s weaker liquidity (current ratio ~1.0) and higher debt levels raise sustainability concerns. I conclude CPAY offers superior total shareholder return potential in 2026, balancing growth reinvestment and buybacks more effectively despite elevated financial leverage risks.
Comparative Score Analysis: The Strategic Profile
The radar chart reveals the fundamental DNA and trade-offs of Fortinet and Corpay, highlighting their distinct financial strengths and vulnerabilities:
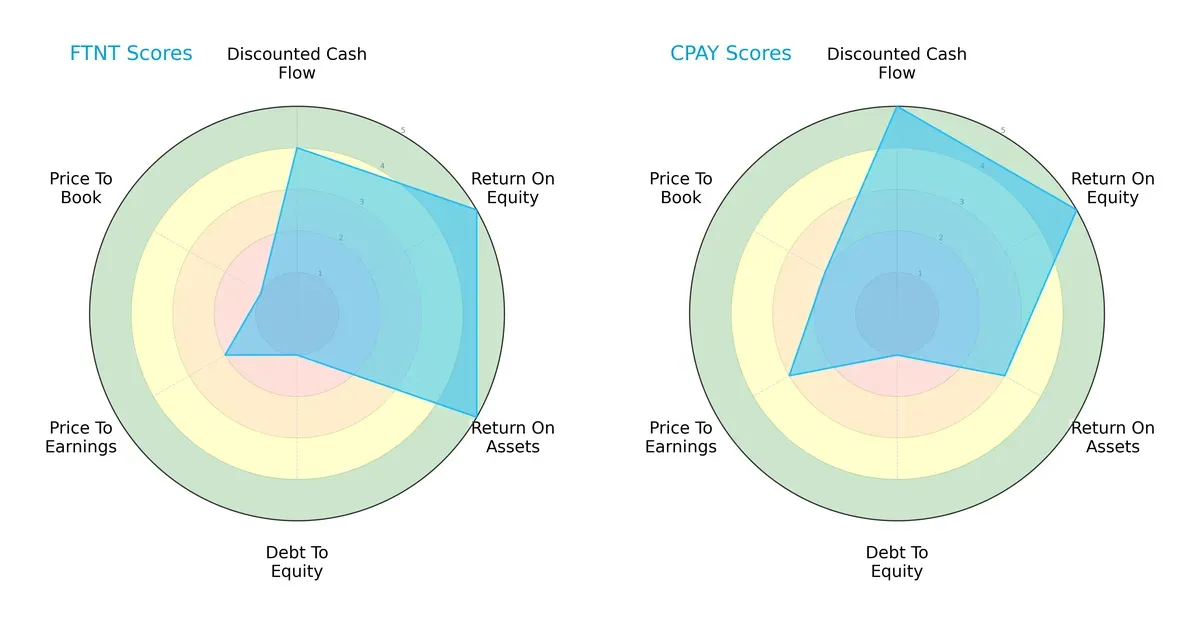
Fortinet excels in asset utilization and equity returns with top ROA and ROE scores of 5, compared to Corpay’s moderate ROA of 3. Corpay leads in discounted cash flow valuation with a perfect 5, suggesting better cash flow prospects. Both firms struggle with leverage, scoring a weak 1 in debt-to-equity, signaling high financial risk. Fortinet’s valuation metrics lag, with very unfavorable P/E and P/B scores, while Corpay fares slightly better. Overall, Fortinet shows a more balanced operational efficiency, while Corpay depends on superior cash flow valuation to offset weaker asset returns.
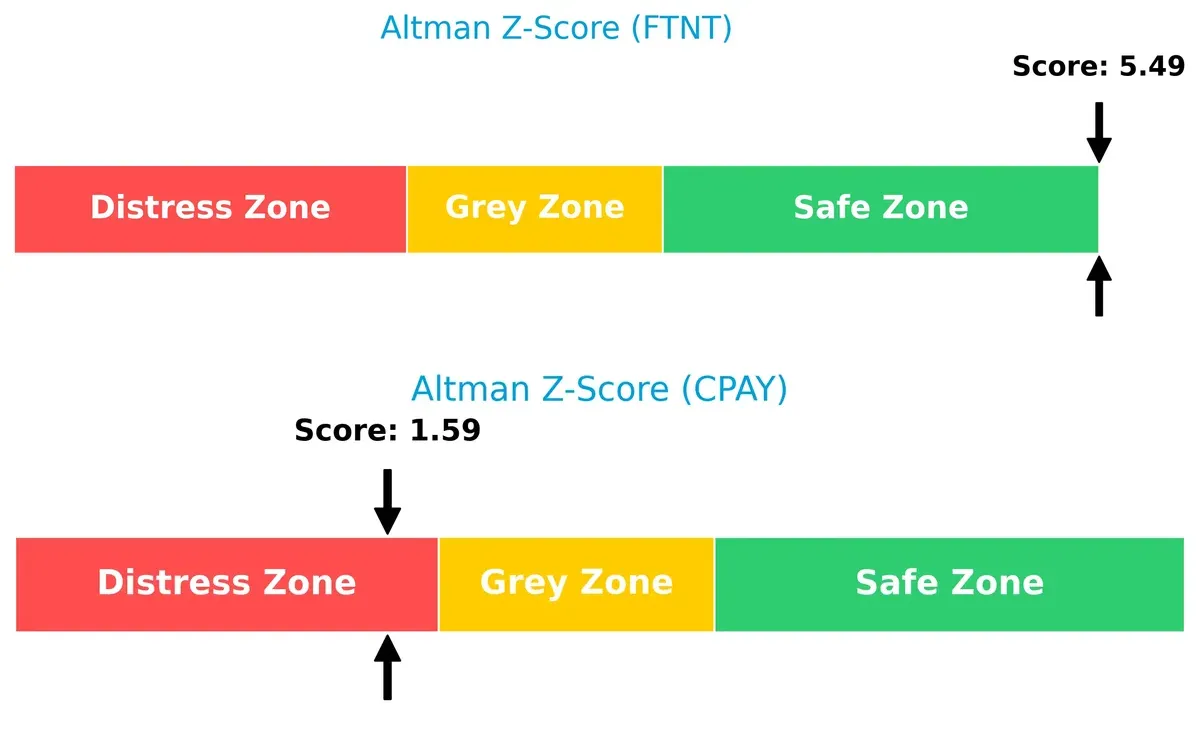
Bankruptcy Risk: Solvency Showdown
Fortinet’s Altman Z-Score of 5.49 places it securely in the safe zone, indicating robust long-term solvency. Corpay’s score of 1.59 signals distress, raising concerns about its survival risks in a challenging cycle:
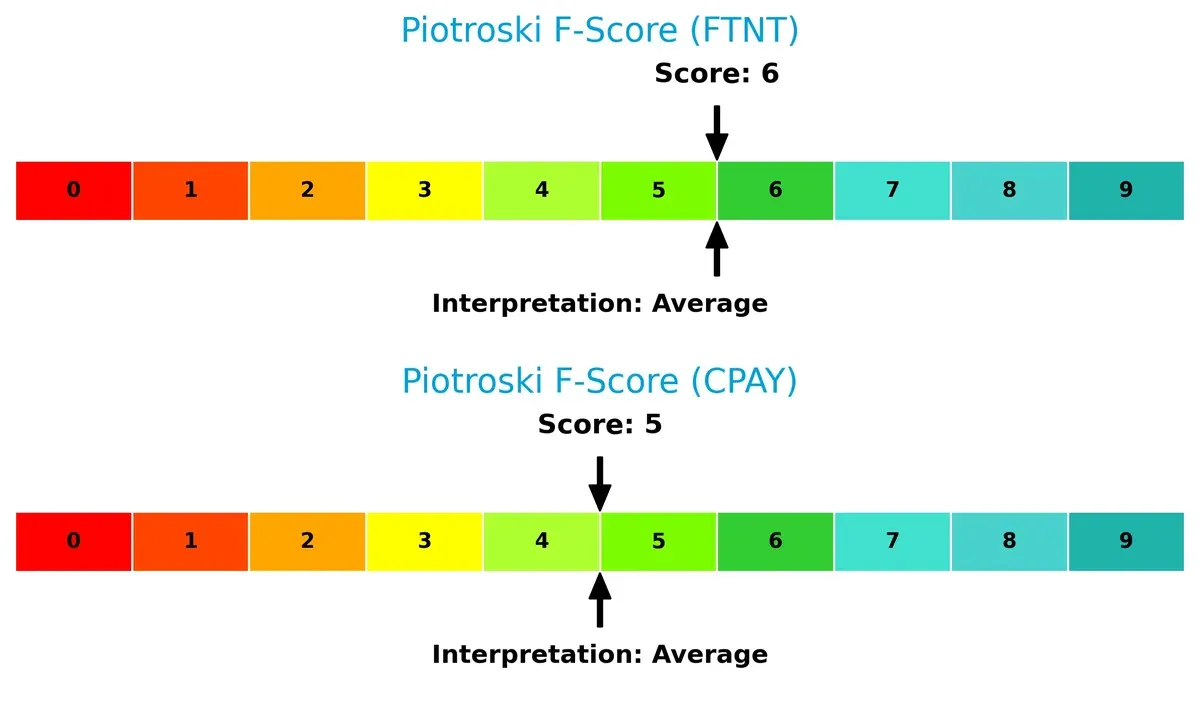
Financial Health: Quality of Operations
Both Fortinet and Corpay hold average Piotroski F-Scores of 6 and 5, respectively, reflecting moderate financial health. Neither shows critical red flags, but Fortinet edges ahead with slightly stronger internal metrics:
How are the two companies positioned?
This section dissects Fortinet and Corpay’s operational DNA by comparing revenue distribution and internal strengths and weaknesses. The goal is to confront their economic moats and identify which model delivers the most resilient competitive advantage today.
Revenue Segmentation: The Strategic Mix
This visual comparison dissects how Fortinet, Inc. and Corpay, Inc. diversify their income streams and where their primary sector bets lie:
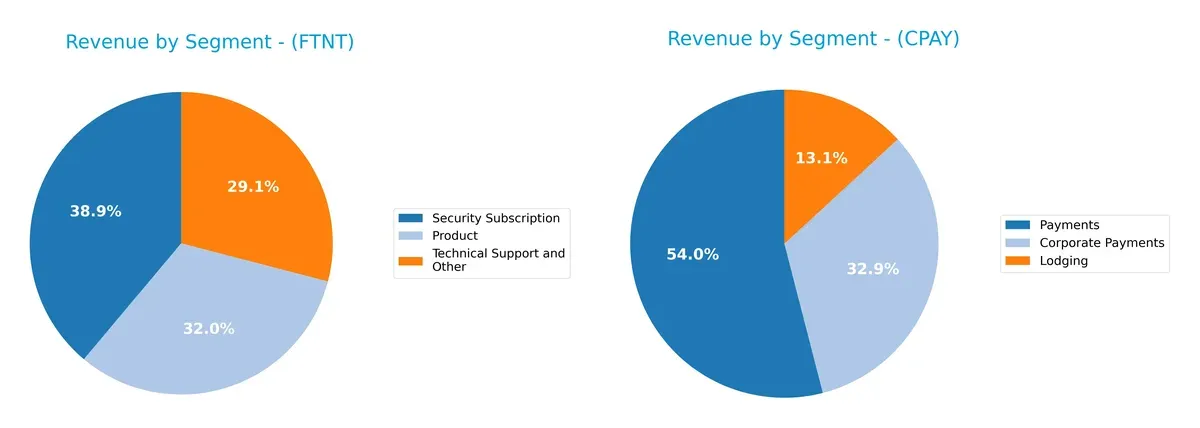
Fortinet, Inc. balances its $5.96B revenue across three strong segments: Security Subscription ($2.32B), Product ($1.91B), and Technical Support ($1.73B). This mix anchors its ecosystem lock-in and recurring revenue. Corpay, Inc. leans heavily on Payments ($2.01B), dwarfs Lodging ($489M) and Corporate Payments ($1.22B), exposing concentration risk but also infrastructure dominance in payments processing. Fortinet’s diversification offers resilience, while Corpay pivots on its core transactional platform.
Strengths and Weaknesses Comparison
This table compares the Strengths and Weaknesses of Fortinet, Inc. and Corpay, Inc.:
Fortinet Strengths
- Diversified product and service revenue streams
- High profitability with net margin of 27.26%
- Strong ROE at 149.77% indicates efficient capital use
- Favorable debt to assets ratio at 9.59%
- Global presence across Americas, EMEA, and Asia Pacific
- Solid fixed asset turnover at 4.2
Corpay Strengths
- Favorable net margin at 23.62% supports profitability
- Reasonable PE ratio of 19.73 signals moderate valuation
- Favorable WACC at 6.26% lowers capital costs
- Strong fixed asset turnover at 9.59
- Geographic revenue concentration in major economies like US, UK, Brazil
- Presence in corporate payments and lodging sectors
Fortinet Weaknesses
- High price-to-book ratio at 48.64 suggests overvaluation risk
- Unfavorable PE ratio at 32.48 compared to peers
- Dividend yield at 0% limits income for investors
- Current ratio of 1.17 is only neutral, potential liquidity concern
- Asset turnover is moderate at 0.65
- Heavy reliance on subscription and technical support revenues
Corpay Weaknesses
- Current ratio below 1 at 0.98 indicates liquidity risk
- Elevated debt-to-equity ratio at 2.58 raises leverage concerns
- Lower ROIC of 8.78% only neutral versus WACC
- Asset turnover at 0.17 is unfavorable, signaling less efficient asset use
- Unfavorable price-to-book at 5.43
- Dividend yield at 0% restricts shareholder returns
Fortinet leverages strong profitability and global diversification but faces valuation and liquidity caution. Corpay shows operational strengths in asset turnover and cost of capital but must address liquidity and leverage risks. Both companies’ profiles reflect strategic trade-offs investors must monitor closely.
The Moat Duel: Analyzing Competitive Defensibility
A structural moat is the only reliable shield protecting long-term profits from relentless competitive erosion. Let’s dissect the moats of two tech players:
Fortinet, Inc.: Network Effects & Integrated Security Dominance
Fortinet’s moat stems from powerful network effects and integrated cybersecurity solutions. Its 20%+ ROIC above WACC and 62.9% ROIC growth confirm efficient capital use and margin durability. Continued innovation in AI-driven security deepens this moat in 2026.
Corpay, Inc.: Cost Advantage in Payment Solutions
Corpay leverages cost advantages in vehicle and corporate payments, but its 2.5% ROIC excess over WACC is modest. A declining ROIC trend warns of margin pressure. Expansion into cross-border payments offers upside but may face stiff competition.
Network Effects vs. Cost Efficiency: Who Defends Market Share Better?
Fortinet’s robust and growing ROIC signals a wider, more sustainable moat than Corpay’s fragile cost edge. I see Fortinet better positioned to defend and expand market share amid intensifying competition.
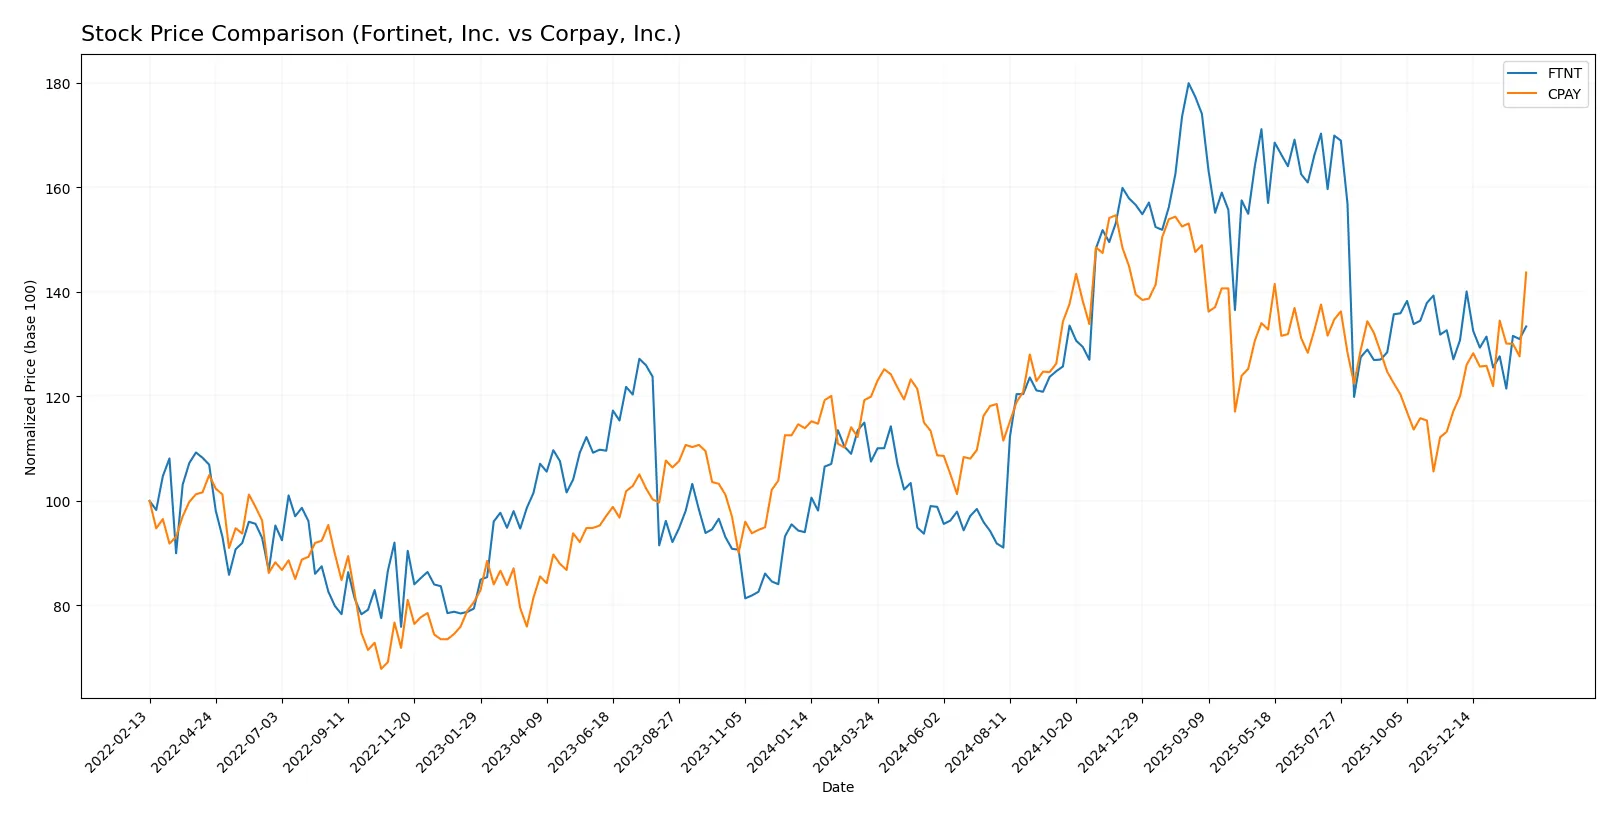
Which stock offers better returns?
Over the past year, Fortinet, Inc. and Corpay, Inc. exhibited strong upward price movements with differing momentum and volume dynamics shaping their trading patterns.
Trend Comparison
Fortinet, Inc. shows a bullish trend with a 24.04% price increase over 12 months. The trend decelerated recently, with a modest 4.95% rise and neutral buyer volume.
Corpay, Inc. has a bullish trend marked by a 19.8% gain over the year. Its momentum accelerated recently, posting a 22.63% increase supported by strong buyer dominance and rising volume.
Comparing both, Corpay’s recent acceleration and higher short-term gains outpace Fortinet’s steady but slowing upward trend, delivering superior market performance in the latest period.
Target Prices
Analysts set a positive tone with solid target price ranges for Fortinet, Inc. and Corpay, Inc.
| Company | Target Low | Target High | Consensus |
|---|---|---|---|
| Fortinet, Inc. | 70 | 90 | 85 |
| Corpay, Inc. | 300 | 390 | 359.33 |
Fortinet’s target consensus at 85 slightly exceeds its current price of 82.76, implying modest upside. Corpay’s target consensus of 359.33 sits just above its current price of 354.19, signaling cautious optimism among analysts.

Don’t Let Luck Decide Your Entry Point
Optimize your entry points with our advanced ProRealTime indicators. You’ll get efficient buy signals with precise price targets for maximum performance. Start outperforming now!
How do institutions grade them?
Fortinet, Inc. Grades
The latest Fortinet grades from reputable analysts are summarized below:
| Grading Company | Action | New Grade | Date |
|---|---|---|---|
| Rosenblatt | Maintain | Buy | 2026-02-06 |
| Mizuho | Maintain | Underperform | 2026-02-06 |
| JP Morgan | Maintain | Underweight | 2026-02-06 |
| RBC Capital | Maintain | Sector Perform | 2026-02-06 |
| Wedbush | Maintain | Outperform | 2026-02-06 |
| Scotiabank | Downgrade | Sector Perform | 2026-02-02 |
| JP Morgan | Maintain | Underweight | 2026-01-30 |
| Rosenblatt | Upgrade | Buy | 2026-01-29 |
| TD Cowen | Upgrade | Buy | 2026-01-23 |
| Citigroup | Maintain | Neutral | 2026-01-13 |
Corpay, Inc. Grades
Corpay’s recent grades from credible firms are detailed in the table below:
| Grading Company | Action | New Grade | Date |
|---|---|---|---|
| Mizuho | Maintain | Neutral | 2026-02-06 |
| JP Morgan | Maintain | Overweight | 2026-02-05 |
| RBC Capital | Maintain | Sector Perform | 2026-02-05 |
| Morgan Stanley | Maintain | Overweight | 2026-02-05 |
| Morgan Stanley | Upgrade | Overweight | 2026-01-26 |
| Oppenheimer | Maintain | Outperform | 2026-01-12 |
| Oppenheimer | Upgrade | Outperform | 2025-12-05 |
| UBS | Maintain | Neutral | 2025-11-06 |
| RBC Capital | Maintain | Sector Perform | 2025-11-06 |
| JP Morgan | Maintain | Overweight | 2025-11-06 |
Which company has the best grades?
Corpay consistently receives more favorable grades such as Overweight and Outperform. Fortinet’s ratings are mixed, ranging from Buy to Underperform. This variation may affect investor confidence and portfolio positioning.
Risks specific to each company
The following categories identify the critical pressure points and systemic threats facing both firms in the 2026 market environment:
1. Market & Competition
Fortinet, Inc.
- Operates in highly competitive cybersecurity sector with constant innovation pressure.
Corpay, Inc.
- Faces intense competition in payments and expense management, with evolving fintech rivals.
2. Capital Structure & Debt
Fortinet, Inc.
- Maintains moderate debt-to-equity ratio (0.81), low financial leverage, and strong interest coverage (113x).
Corpay, Inc.
- High debt-to-equity (2.58) signals elevated financial risk; interest coverage is modest (4.8x).
3. Stock Volatility
Fortinet, Inc.
- Beta near 1.05 implies average market volatility, with stable trading volumes.
Corpay, Inc.
- Lower beta (0.81) suggests less volatility, but smaller average trading volume may impact liquidity.
4. Regulatory & Legal
Fortinet, Inc.
- Cybersecurity regulatory changes could require costly compliance and product updates.
Corpay, Inc.
- Payment processing regulations across jurisdictions add complexity and legal risk exposure.
5. Supply Chain & Operations
Fortinet, Inc.
- Hardware and software supply chain disruptions could delay product delivery and impact revenue.
Corpay, Inc.
- Relies heavily on third-party payment networks and vendors; operational disruptions pose risks.
6. ESG & Climate Transition
Fortinet, Inc.
- Faces pressure to reduce carbon footprint in data centers and hardware manufacturing.
Corpay, Inc.
- ESG risks include ethical payment processing and environmental impact of logistics services.
7. Geopolitical Exposure
Fortinet, Inc.
- Global presence exposes it to geopolitical tensions affecting technology exports and cybersecurity policies.
Corpay, Inc.
- International operations face currency fluctuations and cross-border regulatory uncertainties.
Which company shows a better risk-adjusted profile?
Fortinet’s strongest risk is market competition requiring relentless innovation. Corpay’s highest risk is its leveraged capital structure, raising financial vulnerability. Fortinet’s Altman Z-Score (5.5) places it securely in the safe zone, while Corpay’s 1.6 signals distress. Fortinet’s moderate stock volatility and robust interest coverage show a better risk-adjusted profile. Recent leverage concerns at Corpay justify heightened caution despite solid market positioning.
Final Verdict: Which stock to choose?
Fortinet, Inc. impresses with its superpower of delivering exceptional capital efficiency and accelerating profitability. Its very favorable moat and strong cash generation underpin sustainable growth. A point of vigilance remains its rich valuation multiples, which could pressure returns if growth slows. Fortinet suits an aggressive growth portfolio seeking durable competitive advantage.
Corpay, Inc. leverages a strategic moat rooted in niche payment processing and steady recurring revenue. While its profitability trails Fortinet’s, Corpay offers a more reasonable cost of capital and accelerating price momentum. Its higher leverage and weaker liquidity signal caution, positioning Corpay as a fit for GARP investors balancing growth with valuation prudence.
If you prioritize robust economic moats and capital discipline, Fortinet outshines due to its superior ROIC spread and income statement strength. However, if you seek growth at a more moderate valuation and can tolerate higher financial risk, Corpay offers better momentum and a compelling niche play. Both scenarios demand close attention to valuation and cyclical risks.
Disclaimer: Investment carries a risk of loss of initial capital. The past performance is not a reliable indicator of future results. Be sure to understand risks before making an investment decision.
Go Further
I encourage you to read the complete analyses of Fortinet, Inc. and Corpay, Inc. to enhance your investment decisions: