Home > Comparison > Technology > CPAY vs FFIV
The strategic rivalry between Corpay, Inc. and F5, Inc. shapes the trajectory of the software infrastructure sector. Corpay operates as a broad-based payments company managing vehicle and corporate expenses globally. In contrast, F5 focuses on multi-cloud application security and delivery, targeting enterprise and public sector clients. This analysis contrasts their operational models and market approaches to identify which offers a superior risk-adjusted outlook for a diversified portfolio.
Table of contents
Companies Overview
Corpay and F5 stand as key players in the software infrastructure landscape, shaping enterprise operations globally.
Corpay, Inc.: Payments Infrastructure Powerhouse
Corpay leads as a payments company specializing in vehicle, lodging, and corporate payment solutions across multiple continents. Its core revenue stems from services like fuel cards, tolls, and cross-border payment automation. In 2026, Corpay focuses strategically on expanding its corporate payment solutions and enhancing global payment networks for business clients.
F5, Inc.: Multi-Cloud Application Security Leader
F5 commands the multi-cloud application security and delivery market with a suite of hardware and software solutions. Its revenue revolves around application security products like BIG-IP appliances and cloud-native services supporting hybrid IT environments. The company’s 2026 strategy centers on strengthening partnerships with major cloud providers and advancing its security offerings to meet evolving enterprise needs.
Strategic Collision: Similarities & Divergences
Both companies operate in software infrastructure but diverge sharply: Corpay champions payment automation, while F5 dominates application security and delivery. They compete indirectly in enterprise IT budgets—Corpay on transactional efficiency, F5 on cybersecurity robustness. Their investment profiles differ; Corpay offers exposure to global payment flows, while F5 invests heavily in cloud-era security innovation.
Income Statement Comparison
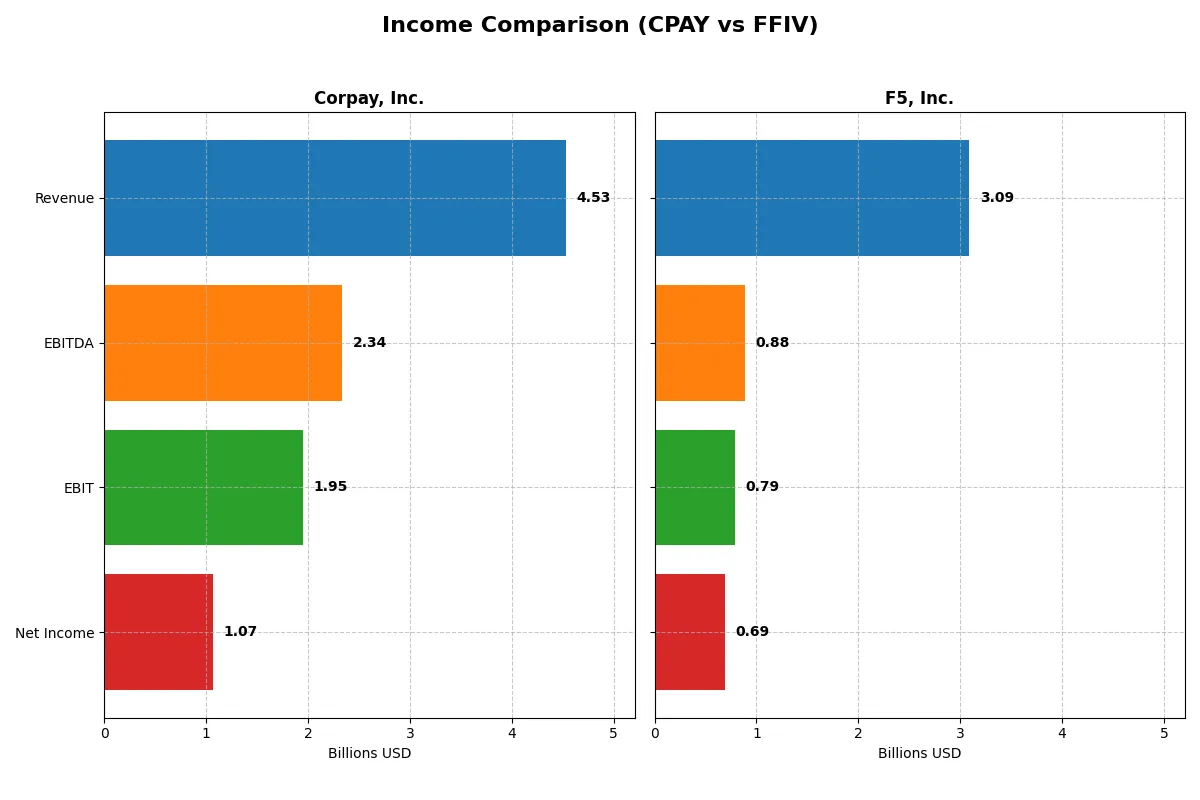
This data dissects the core profitability and scalability of both corporate engines to reveal who dominates the bottom line:
| Metric | Corpay, Inc. (CPAY) | F5, Inc. (FFIV) |
|---|---|---|
| Revenue | 4.53B | 3.09B |
| Cost of Revenue | 1.36B | 574M |
| Operating Expenses | 1.21B | 1.75B |
| Gross Profit | 3.17B | 2.51B |
| EBITDA | 2.34B | 884M |
| EBIT | 1.95B | 791M |
| Interest Expense | 404M | 0 |
| Net Income | 1.07B | 692M |
| EPS | 15.25 | 11.96 |
| Fiscal Year | 2025 | 2025 |
Income Statement Analysis: The Bottom-Line Duel
This income statement comparison reveals the true efficiency and profitability of Corpay, Inc. and F5, Inc.’s corporate engines.
Corpay, Inc. Analysis
Corpay’s revenue grew steadily from 2.8B in 2021 to 4.5B in 2025, with net income climbing from 840M to 1.07B. Its gross margin remains strong around 70%, while the net margin holds a solid 23.6% in 2025. The company demonstrates efficient cost control and improving operating income, though net margin dipped slightly last year.
F5, Inc. Analysis
F5 increased revenue from 2.6B in 2021 to 3.1B in 2025, with net income surging from 331M to 692M. It boasts a robust 81.4% gross margin and a healthy 22.4% net margin in 2025. The firm shows strong momentum with double-digit growth in EBIT and net margin, reflecting effective expense management and rising profitability.
Margin Power vs. Revenue Scale
Corpay leads in revenue scale and absolute net income, reflecting its larger market footprint. F5 excels in margin expansion and faster profit growth, showing superior operational leverage. For investors, Corpay offers size and steady profit, while F5 presents a dynamic growth profile with expanding margins.
Financial Ratios Comparison
These vital ratios act as a diagnostic tool to expose the underlying fiscal health, valuation premiums, and capital efficiency of the companies compared below:
| Ratios | Corpay, Inc. (CPAY) | F5, Inc. (FFIV) |
|---|---|---|
| ROE | 27.5% | 19.3% |
| ROIC | 8.8% | 13.8% |
| P/E | 19.7 | 26.9 |
| P/B | 5.4 | 5.2 |
| Current Ratio | 0.98 | 1.56 |
| Quick Ratio | 0.98 | 1.51 |
| D/E (Debt to Equity) | 2.58 | 0.07 |
| Debt-to-Assets | 37.9% | 4.1% |
| Interest Coverage | 4.83 | N/A (0) |
| Asset Turnover | 0.17 | 0.49 |
| Fixed Asset Turnover | 9.6 | 9.0 |
| Payout Ratio | 0% | 0% |
| Dividend Yield | 0% | 0% |
| Fiscal Year | 2025 | 2025 (Sep 30) |
Efficiency & Valuation Duel: The Vital Signs
Financial ratios serve as a company’s DNA, uncovering hidden risks and operational strengths that shape investment decisions.
Corpay, Inc.
Corpay posts a strong ROE of 27.55% and a solid net margin of 23.62%, indicating robust profitability. The P/E of 19.73 appears reasonable, but a high P/B of 5.43 signals valuation stretch. The firm offers no dividend, signaling reinvestment likely prioritizes growth over immediate shareholder returns.
F5, Inc.
F5 delivers a respectable ROE of 19.28% and a net margin of 22.42%, demonstrating profitability. However, its P/E at 26.91 suggests the stock trades at a premium. Strong liquidity ratios and low leverage underpin financial stability. Like Corpay, F5 pays no dividend, investing heavily in R&D and growth initiatives.
Premium Valuation vs. Operational Safety
F5’s favorable liquidity and capital structure contrast with Corpay’s higher profitability but stretched valuation and weaker liquidity. F5 offers a safer risk profile, while Corpay appeals to those seeking higher returns with more risk. Investors must weigh growth potential against financial resilience.
Which one offers the Superior Shareholder Reward?
Corpay, Inc. (CPAY) pays no dividends, reinvesting heavily in growth with a free cash flow per share of $18.5 and zero payout ratio. F5, Inc. (FFIV) also pays no dividends but maintains robust buybacks, supported by a strong operating cash flow ratio of 0.59 and low debt levels. CPAY’s lack of buybacks limits immediate shareholder reward despite solid FCF, while FFIV’s intense buyback program and prudent leverage create more sustainable total returns. I find F5, Inc. offers the superior shareholder reward in 2026 due to disciplined capital allocation and effective buyback execution.
Comparative Score Analysis: The Strategic Profile
The radar chart reveals the fundamental DNA and trade-offs of Corpay, Inc. and F5, Inc., highlighting their financial strengths and valuation nuances:
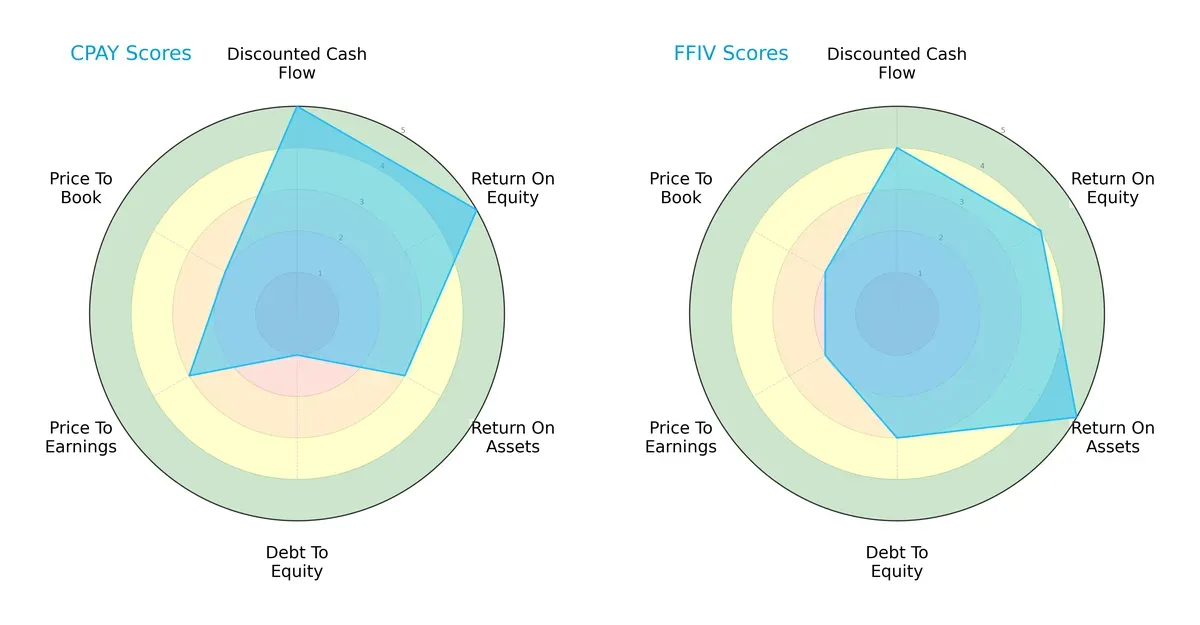
Corpay excels in discounted cash flow and return on equity, showing strong profit generation but carries high financial risk with a very unfavorable debt-to-equity score. F5 maintains a more balanced profile, with solid asset efficiency and moderate leverage, though its valuation metrics appear less attractive. F5’s overall score suggests steadier financial health, while Corpay relies heavily on specific profitability advantages.
Bankruptcy Risk: Solvency Showdown
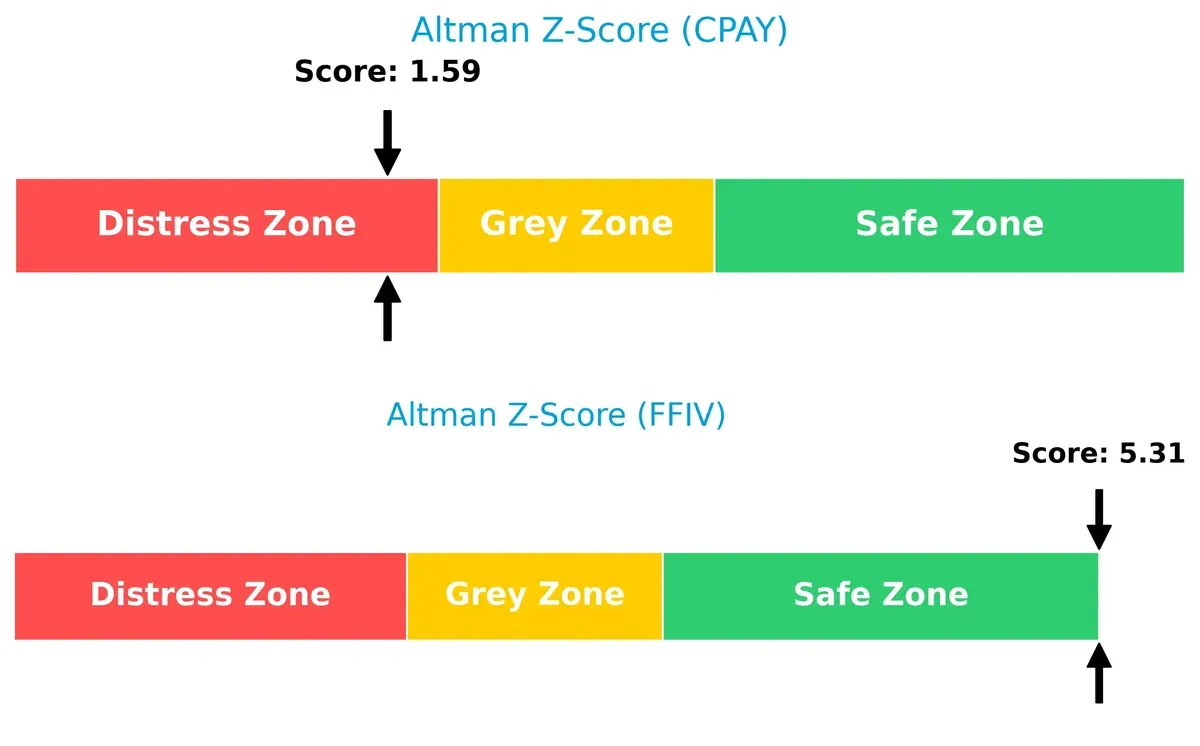
F5’s Altman Z-Score of 5.31 places it comfortably in the safe zone, signaling robust solvency. Corpay’s 1.59 score lands in the distress zone, indicating a high bankruptcy risk under current market conditions:
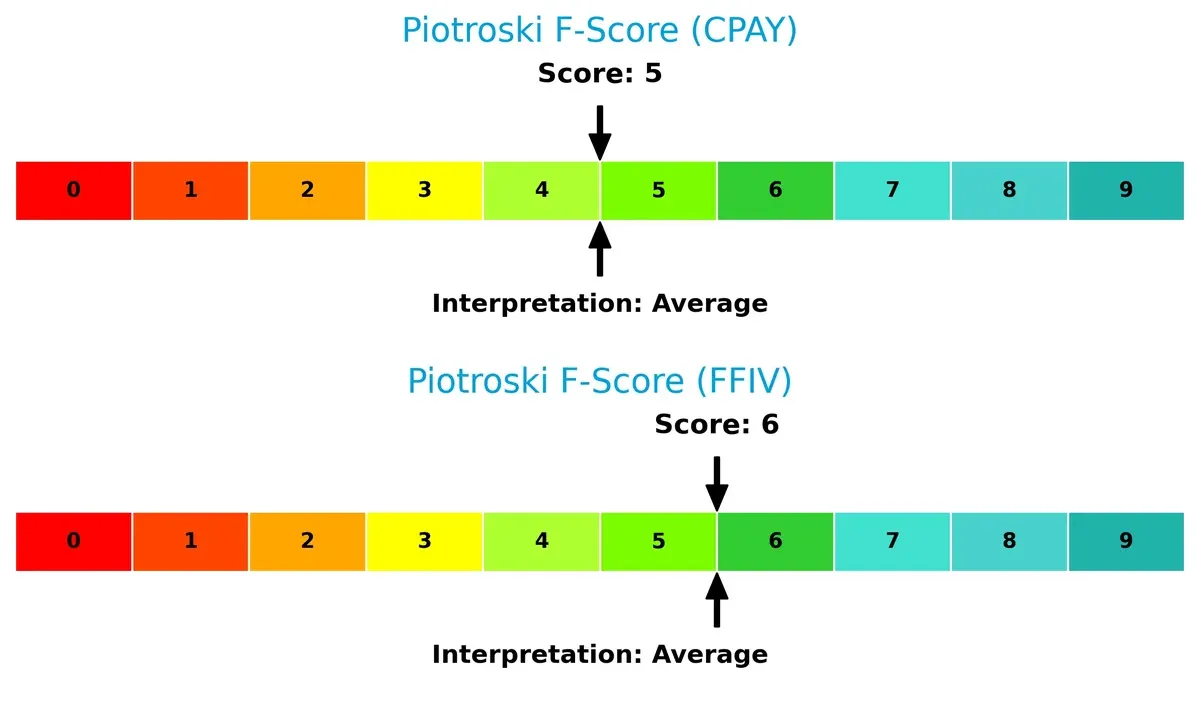
Financial Health: Quality of Operations
Both firms show average Piotroski F-Scores, with Corpay at 5 and F5 at 6. F5’s marginally higher score reflects slightly better internal financial health and operational quality, while Corpay’s weaker score flags moderate internal concerns:
How are the two companies positioned?
This section dissects the operational DNA of Corpay and F5 by comparing their revenue distribution and internal dynamics—strengths and weaknesses. The goal is to confront their economic moats to identify which business model offers the most resilient, sustainable competitive advantage today.
Revenue Segmentation: The Strategic Mix
This comparison dissects how Corpay, Inc. and F5, Inc. diversify their income streams and where their primary sector bets lie:
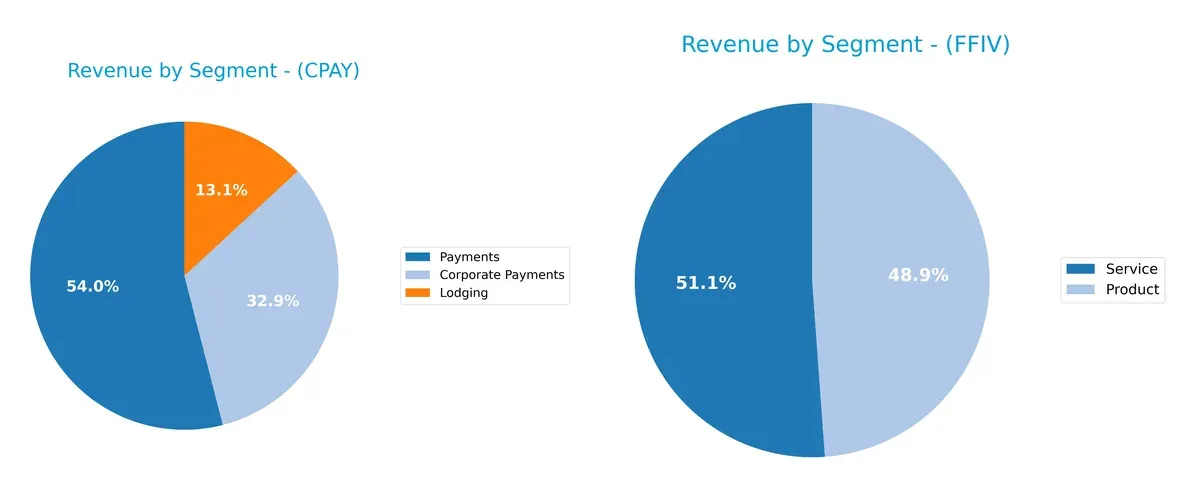
Corpay anchors its revenue in Payments at $2B, with Corporate Payments ($1.22B) and Lodging ($489M) trailing. F5 shows a balanced split between Service ($1.58B) and Product ($1.51B) revenues. Corpay’s concentration in Payments signals dependency risk but also a strong foothold in transaction ecosystems. F5’s diversified mix implies resilience through service contracts and product sales, reducing exposure to sector-specific shocks.
Strengths and Weaknesses Comparison
This table compares the Strengths and Weaknesses of Corpay, Inc. and F5, Inc.:
Corpay Strengths
- Strong profitability with 23.62% net margin and 27.55% ROE
- Favorable WACC at 6.26% supports capital efficiency
- High fixed asset turnover at 9.59 indicates efficient asset use
- Diversified revenue streams across Corporate Payments and Lodging
- Significant US revenue base of 2.08B
F5 Strengths
- Favorable profitability with 22.42% net margin and 19.28% ROE
- Higher ROIC at 13.8% exceeds WACC, indicating value creation
- Strong balance sheet with low debt-to-equity at 0.07 and high interest coverage
- Diversified revenue between Product and Service segments
- Global presence with balanced Americas, Asia Pacific, and EMEA revenues
Corpay Weaknesses
- Unfavorable liquidity with current ratio below 1 at 0.98
- High debt-to-equity at 2.58 raises financial risk
- Unfavorable asset turnover at 0.17 limits revenue generation from assets
- High price-to-book at 5.43 may indicate overvaluation
- No dividend yield reduces shareholder income
F5 Weaknesses
- Elevated P/E ratio at 26.91 suggests premium valuation
- Unfavorable asset turnover at 0.49 compared to peers
- No dividend yield limits income for investors
- Moderate WACC at 8.43% may pressure returns
- Slightly lower ROE relative to Corpay
Corpay demonstrates strong profitability but faces liquidity and leverage concerns, which could constrain flexibility. F5 shows robust financial health and global diversification but trades at a higher valuation, reflecting growth expectations. Both companies need to address asset turnover challenges to optimize capital efficiency.
The Moat Duel: Analyzing Competitive Defensibility
A structural moat is the only true shield preserving long-term profits from relentless competitive pressure. Let’s dissect how these firms defend their turf:
Corpay, Inc.: Cost Advantage with Payment Network Scale
Corpay’s moat stems from cost advantages and specialized payment solutions across vehicle and corporate expenses. Its 2.5% ROIC premium over WACC reflects value creation, though a declining ROIC trend signals pressure. Expansion into global markets could deepen its moat if operational efficiency improves.
F5, Inc.: Technology-Driven Network Effects
F5 leverages multi-cloud application security, building strong network effects through integrated hardware-software ecosystems. Its ROIC exceeds WACC by 5.4% with a robust upward trend, showcasing widening profitability. Continued cloud partnerships and innovation position it to disrupt and expand market share aggressively.
Cost Efficiency vs. Tech Ecosystem Dominance: The Moat Face-off
F5 possesses a deeper, more sustainable moat with accelerating ROIC and superior margin expansion. Corpay creates value but faces margin compression risks. F5 is better equipped to defend and grow its competitive position in 2026 and beyond.
Which stock offers better returns?
The past year saw Corpay, Inc. and F5, Inc. both exhibit strong bullish trends with accelerating price gains, reflecting robust trading dynamics and rising investor interest.
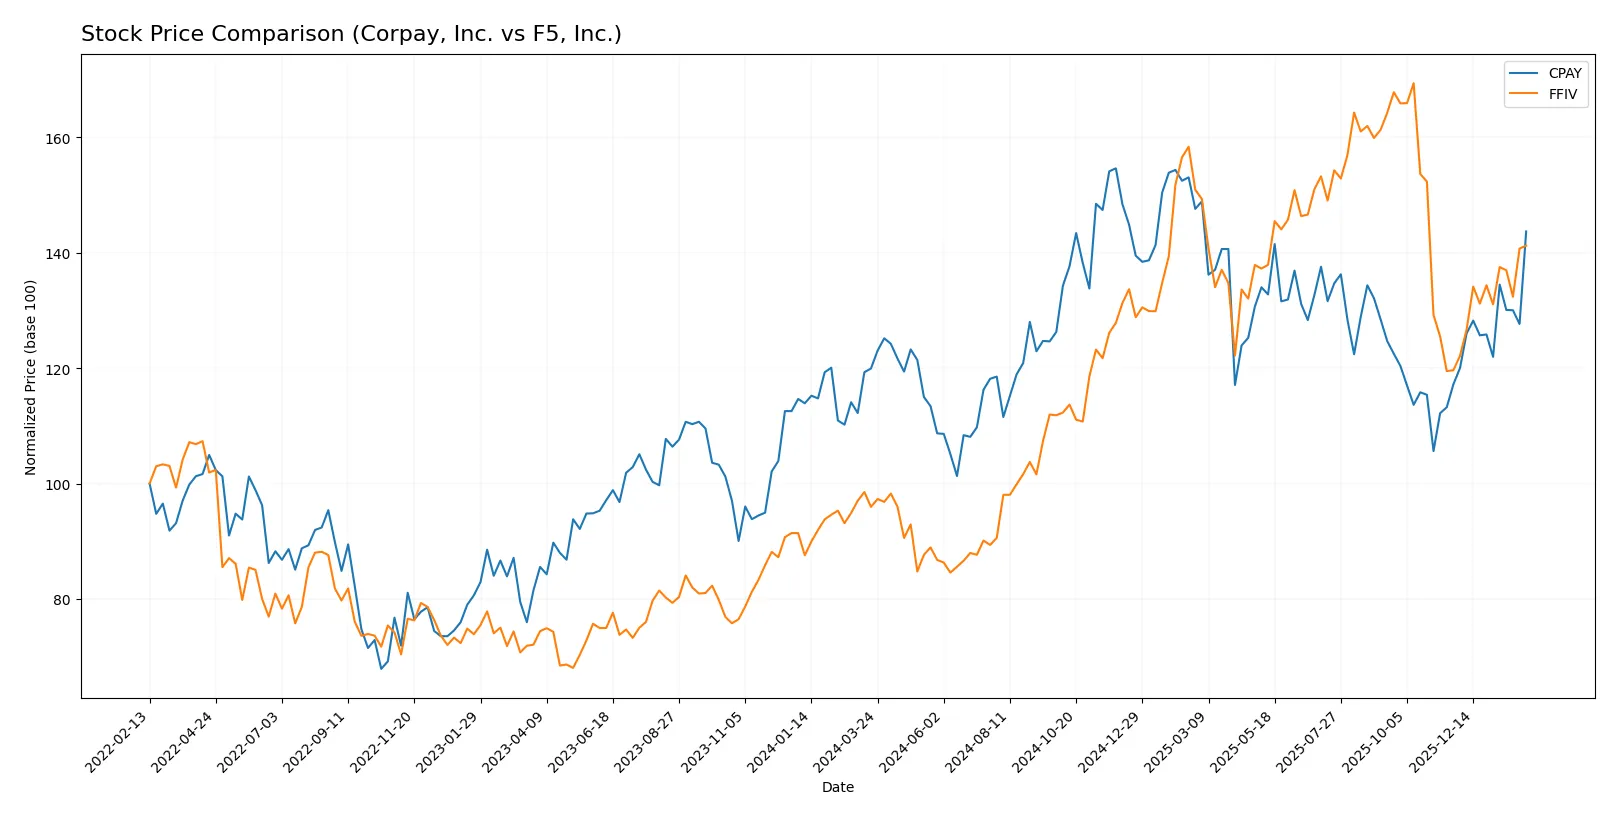
Trend Comparison
Corpay, Inc. gained 19.8% over the past 12 months, showing a bullish trend with accelerating momentum and a standard deviation of 31.25, indicating moderate price volatility.
F5, Inc. outperformed with a 47.19% gain over the same period, also bullish and accelerating, but with higher volatility, reflected by a 48.28 standard deviation.
F5, Inc. delivered the highest market performance, nearly doubling Corpay’s returns, both showing strong buyer dominance amid increasing trading volumes.
Target Prices
Analysts present a clear target price consensus for both Corpay, Inc. and F5, Inc.
| Company | Target Low | Target High | Consensus |
|---|---|---|---|
| Corpay, Inc. | 300 | 390 | 359.33 |
| F5, Inc. | 295 | 352 | 330.67 |
The consensus target prices for Corpay and F5 exceed their current prices, indicating analyst confidence in moderate upside potential for both stocks.

Don’t Let Luck Decide Your Entry Point
Optimize your entry points with our advanced ProRealTime indicators. You’ll get efficient buy signals with precise price targets for maximum performance. Start outperforming now!
How do institutions grade them?
Corpay, Inc. Grades
The following table summarizes recent analyst grades for Corpay, Inc.:
| Grading Company | Action | New Grade | Date |
|---|---|---|---|
| Mizuho | maintain | Neutral | 2026-02-06 |
| JP Morgan | maintain | Overweight | 2026-02-05 |
| RBC Capital | maintain | Sector Perform | 2026-02-05 |
| Morgan Stanley | maintain | Overweight | 2026-02-05 |
| Morgan Stanley | upgrade | Overweight | 2026-01-26 |
| Oppenheimer | maintain | Outperform | 2026-01-12 |
| Oppenheimer | upgrade | Outperform | 2025-12-05 |
| UBS | maintain | Neutral | 2025-11-06 |
| RBC Capital | maintain | Sector Perform | 2025-11-06 |
| JP Morgan | maintain | Overweight | 2025-11-06 |
F5, Inc. Grades
Below is a summary of recent analyst grades for F5, Inc.:
| Grading Company | Action | New Grade | Date |
|---|---|---|---|
| Needham | maintain | Hold | 2026-01-28 |
| RBC Capital | maintain | Outperform | 2026-01-28 |
| Piper Sandler | maintain | Overweight | 2026-01-28 |
| Barclays | maintain | Equal Weight | 2026-01-28 |
| Goldman Sachs | maintain | Neutral | 2026-01-28 |
| JP Morgan | upgrade | Overweight | 2026-01-15 |
| Piper Sandler | upgrade | Overweight | 2026-01-05 |
| RBC Capital | upgrade | Outperform | 2026-01-05 |
| Morgan Stanley | maintain | Equal Weight | 2025-12-17 |
| RBC Capital | maintain | Sector Perform | 2025-10-28 |
Which company has the best grades?
Both companies receive a mix of neutral and positive grades, but Corpay shows more consistent “Overweight” and “Outperform” ratings from major firms. F5 also has “Outperform” ratings but includes more “Equal Weight” and “Hold” grades. Investors may interpret Corpay’s higher and more frequent upgrades as a stronger institutional conviction.
Risks specific to each company
The following categories identify the critical pressure points and systemic threats facing both firms in the 2026 market environment:
1. Market & Competition
Corpay, Inc.
- Faces intense competition in payments and corporate expense management across multiple regions.
F5, Inc.
- Competes in a crowded multi-cloud security market with strong incumbents and rapid innovation cycles.
2. Capital Structure & Debt
Corpay, Inc.
- High debt-to-equity ratio of 2.58 signals leverage risk and potential financial inflexibility.
F5, Inc.
- Low debt-to-equity ratio of 0.07 indicates a solid balance sheet with minimal financial risk.
3. Stock Volatility
Corpay, Inc.
- Beta of 0.81 suggests lower volatility than the market, offering relatively stable stock price movements.
F5, Inc.
- Beta near 1.01 aligns with market volatility, reflecting higher sensitivity to economic swings.
4. Regulatory & Legal
Corpay, Inc.
- Exposure to cross-border payments regulations and data privacy laws across several jurisdictions.
F5, Inc.
- Faces evolving cybersecurity regulations and compliance requirements impacting product deployment globally.
5. Supply Chain & Operations
Corpay, Inc.
- Operational risks from managing international payment networks and technology integrations.
F5, Inc.
- Relies on hardware-software integration and cloud partnerships, vulnerable to supply chain disruptions.
6. ESG & Climate Transition
Corpay, Inc.
- Limited visibility on ESG initiatives; indirect climate transition risk from energy-intensive payment processing.
F5, Inc.
- Stronger focus on sustainable IT solutions, yet exposed to pressure for greener cloud and security services.
7. Geopolitical Exposure
Corpay, Inc.
- Significant operations in the US, Brazil, and UK expose it to geopolitical tensions and currency fluctuations.
F5, Inc.
- Global footprint includes sensitive regions; geopolitical risks could affect cloud partnerships and sales.
Which company shows a better risk-adjusted profile?
Corpay’s most critical risk lies in its leveraged capital structure, heightening financial vulnerability amid market uncertainties. F5’s biggest risk arises from competitive pressure and regulatory complexities in cloud security. F5’s stronger balance sheet and favorable Altman Z-score position it with a safer risk-adjusted profile. Corpay’s Altman Z-score of 1.59 places it in distress territory, signaling bankruptcy risk, while F5’s 5.31 score confirms robust financial health. This stark contrast justifies my heightened caution toward Corpay despite its market stability.
Final Verdict: Which stock to choose?
Corpay, Inc. stands out for its robust return on equity and strong operational cash flow, revealing a superpower in capital efficiency and profitability. However, its modest liquidity metrics serve as a point of vigilance. This company fits well within an aggressive growth portfolio willing to tolerate balance sheet nuances for growth potential.
F5, Inc. commands a strategic moat through its sustainable and growing return on invested capital, signaling a durable competitive advantage. Its conservative debt profile and healthier liquidity ratios offer a safer investment profile compared to Corpay. This stock aligns with a GARP (Growth at a Reasonable Price) strategy, emphasizing stability and steady growth.
If you prioritize aggressive capital efficiency and high profitability, Corpay might be the compelling choice due to its strong ROE and cash flow generation despite liquidity constraints. However, if you seek a safer, more stable investment with a sustainable competitive advantage, F5 offers better stability and a very favorable moat with growing profitability.
Disclaimer: Investment carries a risk of loss of initial capital. The past performance is not a reliable indicator of future results. Be sure to understand risks before making an investment decision.
Go Further
I encourage you to read the complete analyses of Corpay, Inc. and F5, Inc. to enhance your investment decisions: