Home > Comparison > Technology > CYBR vs CPAY
The strategic rivalry between CyberArk Software Ltd. and Corpay, Inc. shapes the infrastructure software landscape. CyberArk excels as a cybersecurity innovator focused on privileged access management, while Corpay operates a broad-based payments platform serving global corporate clients. This head-to-head pits specialized security solutions against scalable payment services. This analysis aims to identify which business model delivers superior risk-adjusted returns, guiding investors seeking durable growth in technology infrastructure.

Table of contents
Companies Overview
CyberArk Software Ltd. and Corpay, Inc. stand as pivotal players in the software infrastructure market, shaping enterprise technology globally.
CyberArk Software Ltd.: Cybersecurity Specialist
CyberArk leads in privileged access security, generating revenue through software solutions that protect critical credentials. Its 2026 focus sharpens on expanding SaaS offerings like Endpoint Privilege Manager and Cloud Entitlements Manager, targeting risk reduction in cloud environments. The company’s competitive edge lies in its robust identity and access management services.
Corpay, Inc.: Corporate Payments Innovator
Corpay excels in payment solutions for businesses and consumers, driving revenue from vehicle-related and corporate payment services. In 2026, it emphasizes scaling accounts payable automation and cross-border payment platforms. Corpay’s strength is its broad reach across travel, fleet, and corporate expense management sectors, leveraging its legacy as a payment network leader.
Strategic Collision: Similarities & Divergences
Both companies operate in software infrastructure but adopt distinct philosophies: CyberArk pursues a security-focused ecosystem, while Corpay builds an open payment infrastructure. Their primary battleground is enterprise efficiency—CyberArk through access control, Corpay via payment automation. This contrast creates unique investment profiles: CyberArk appeals to security-driven portfolios; Corpay suits those favoring fintech growth exposure.
Income Statement Comparison
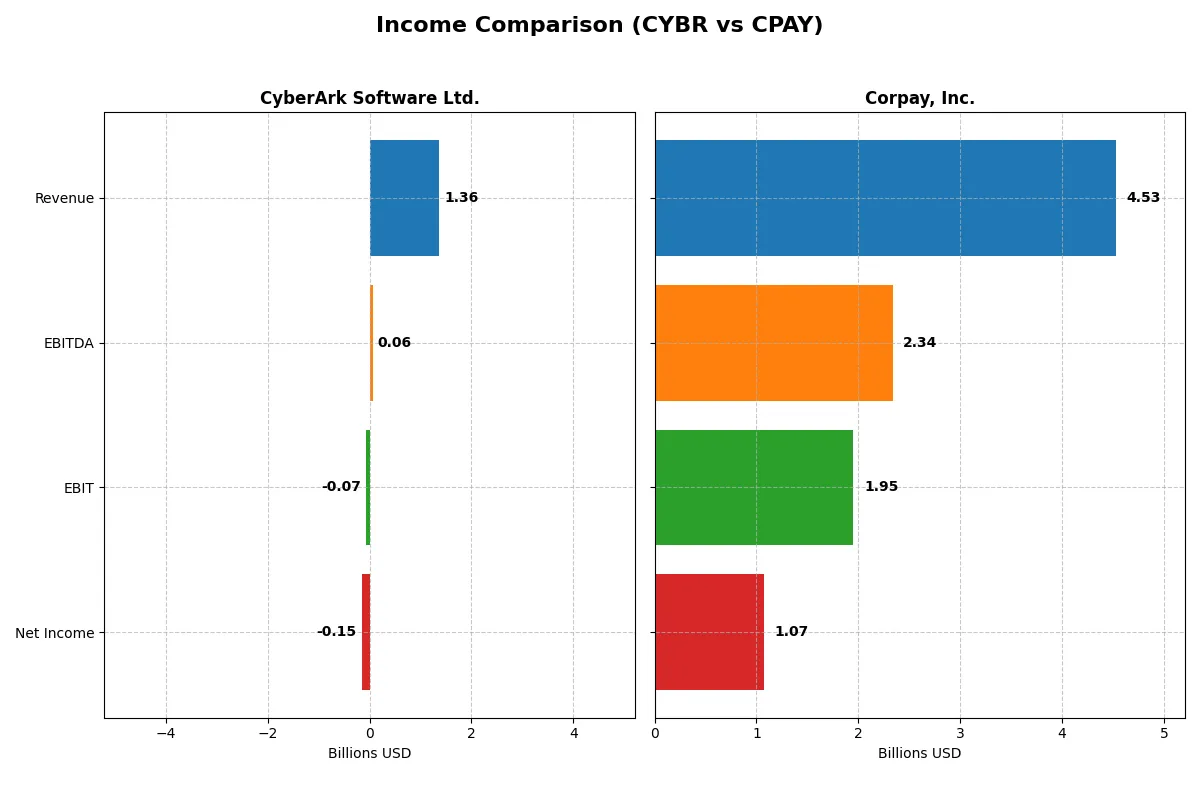
This data dissects the core profitability and scalability of both corporate engines to reveal who dominates the bottom line:
| Metric | CyberArk Software Ltd. (CYBR) | Corpay, Inc. (CPAY) |
|---|---|---|
| Revenue | 1.36B | 4.53B |
| Cost of Revenue | 350M | 1.36B |
| Operating Expenses | 1.12B | 1.21B |
| Gross Profit | 1.01B | 3.17B |
| EBITDA | 59M | 2.34B |
| EBIT | -69M | 1.95B |
| Interest Expense | 0 | 404M |
| Net Income | -147M | 1.07B |
| EPS | -2.93 | 15.25 |
| Fiscal Year | 2025 | 2025 |
Income Statement Analysis: The Bottom-Line Duel
This income statement comparison reveals the true operational efficiency and profitability of CyberArk Software Ltd. and Corpay, Inc. over recent years.
CyberArk Software Ltd. Analysis
CyberArk’s revenue surged 36% in 2025 to $1.36B, reflecting strong top-line momentum since 2021. However, net income remained negative at -$147M, deepening losses despite a robust 74% gross margin. Operating inefficiencies and rising expenses eroded profitability, pushing EBIT margin further into the red at -5.1%. The widened net loss signals ongoing challenges in scaling profitably.
Corpay, Inc. Analysis
Corpay expanded revenues steadily by nearly 14% in 2025, reaching $4.53B with solid gross margins near 70%. Net income grew 7.6% to $1.07B, lifting net margin to a healthy 23.6%. EBIT margin remained strong at 43.1%, demonstrating effective cost management despite an 8.9% interest burden. Corpay sustains profitable growth with operational leverage and disciplined capital allocation.
Profitability Resilience vs. Growth Struggles
Corpay clearly outperforms CyberArk on profitability and margin expansion, driven by higher scale and operational efficiency. CyberArk shows impressive revenue growth but struggles to convert top-line gains into net profits. Investors seeking durable earnings and margin strength will find Corpay’s profile more attractive, while CyberArk’s losses highlight execution risks amid rapid expansion.
Financial Ratios Comparison
These vital ratios act as a diagnostic tool to expose the underlying fiscal health, valuation premiums, and capital efficiency of the companies compared:
| Ratios | CyberArk Software Ltd. (CYBR) | Corpay, Inc. (CPAY) |
|---|---|---|
| ROE | -6.11% | 27.55% |
| ROIC | -2.74% | 8.78% |
| P/E | -152.24 | 19.73 |
| P/B | 9.31 | 5.43 |
| Current Ratio | 2.00 | 0.98 |
| Quick Ratio | 2.00 | 0.98 |
| D/E (Debt-to-Equity) | 0.51 | 2.58 |
| Debt-to-Assets | 25.38% | 37.86% |
| Interest Coverage | 0 | 4.83 |
| Asset Turnover | 0.28 | 0.17 |
| Fixed Asset Turnover | 32.73 | 9.59 |
| Payout ratio | 0 | 0 |
| Dividend yield | 0 | 0 |
| Fiscal Year | 2025 | 2025 |
Efficiency & Valuation Duel: The Vital Signs
Financial ratios serve as a company’s DNA, exposing hidden risks and revealing operational strengths essential for investor insight.
CyberArk Software Ltd.
CyberArk shows negative core profitability with ROE at -6.11% and net margin at -10.79%, signaling operational challenges. Its valuation appears stretched with a PB ratio of 9.31, although the P/E is favorable due to negative earnings. The firm retains earnings, heavily investing in R&D (25% of revenue), foregoing dividends for growth.
Corpay, Inc.
Corpay demonstrates robust profitability, with ROE at 27.55% and a healthy net margin of 23.62%. Its valuation is moderate, with a P/E of 19.73 but a high PB of 5.43. The balance sheet shows leverage concerns (D/E at 2.58) and a weak current ratio. Corpay returns no dividends, focusing cash flow on debt and operational efficiency.
Operational Struggles vs. Profitable Growth
CyberArk’s negative returns and high valuation suggest riskier growth, while Corpay delivers strong profitability but carries financial leverage risks. Corpay’s profile suits investors seeking operational strength and growth with some balance sheet caution. CyberArk fits those prioritizing innovation over immediate returns.
Which one offers the Superior Shareholder Reward?
CyberArk Software Ltd. (CYBR) and Corpay, Inc. (CPAY) both forgo dividends to reinvest in growth. CYBR shows zero dividend yield and payout, focusing on free cash flow reinvestment with a strong FCF per share of $5.17 in 2025. CPAY also pays no dividends but delivers a robust free cash flow per share of $18.52 in 2025. CPAY’s buyback intensity appears moderate, supported by solid operating margins (43%) and a sustainable net profit margin of 23.6%. CYBR posts negative net margins and weak profitability, indicating reinvestment risks. CPAY’s lower price-to-free-cash-flow ratio (~16x vs. CYBR’s 86x) signals better valuation discipline. I conclude CPAY offers a superior total shareholder return profile in 2026 due to stronger cash generation, profitable growth, and more sustainable capital allocation.
Comparative Score Analysis: The Strategic Profile
The radar chart reveals the fundamental DNA and trade-offs of CyberArk Software Ltd. and Corpay, Inc., highlighting their distinct financial strengths and weaknesses:
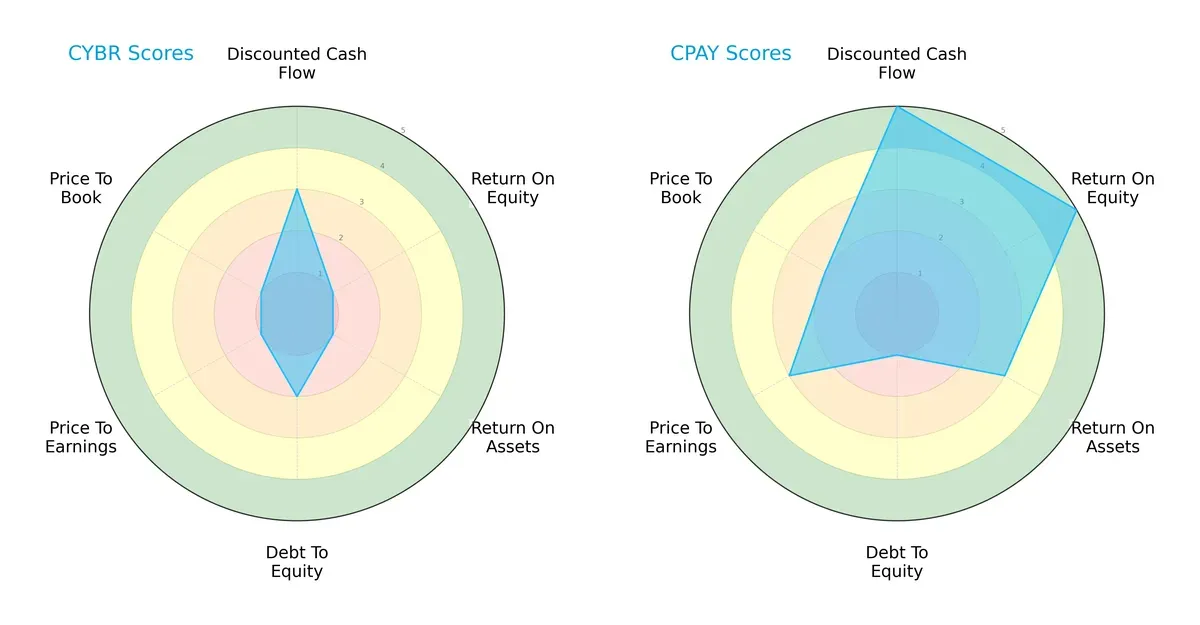
Corpay leads with superior DCF (5 vs. 3), ROE (5 vs. 1), and ROA (3 vs. 1) scores, reflecting efficient profit generation and asset utilization. CyberArk shows marginally better debt management (2 vs. 1), but both firms struggle with valuation metrics (PE/PB scores low for both). Corpay presents a more balanced, growth-oriented profile, while CyberArk relies on conservative leverage but suffers from weak profitability and valuation.
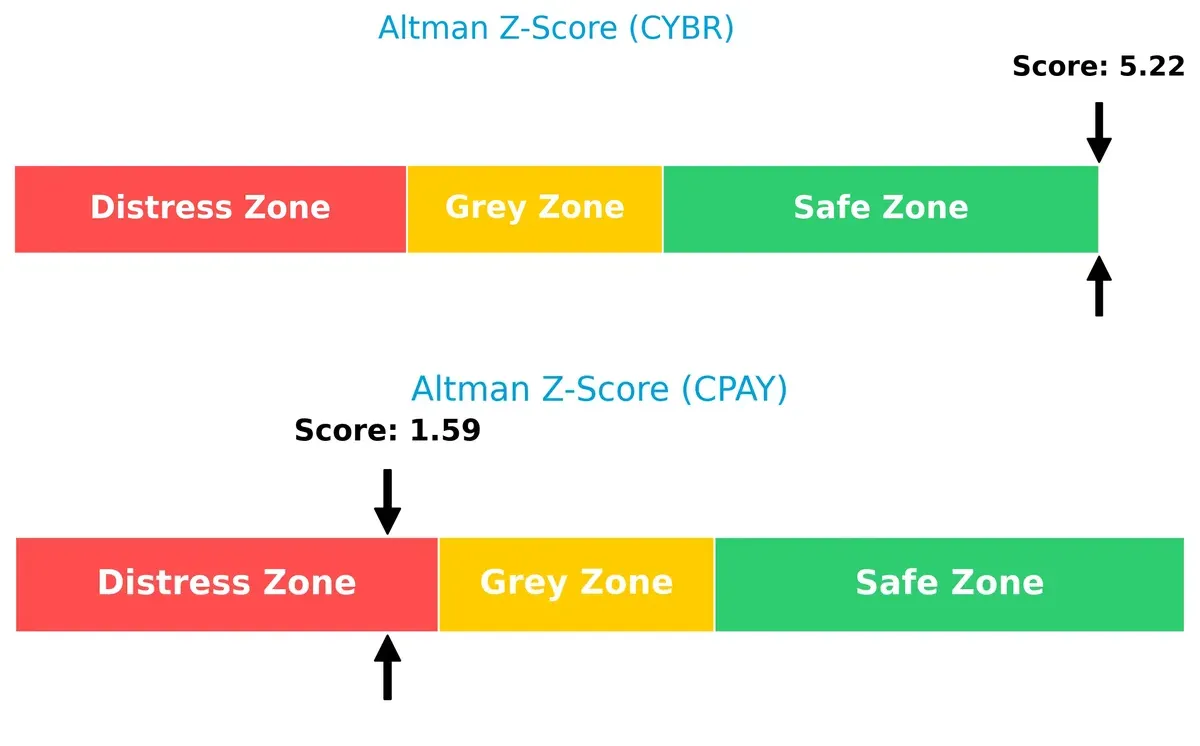
Bankruptcy Risk: Solvency Showdown
Corpay’s Altman Z-Score stands at 1.59 in the distress zone, signaling elevated bankruptcy risk. CyberArk scores 5.22, safely distanced from financial distress, indicating robust long-term survival prospects:
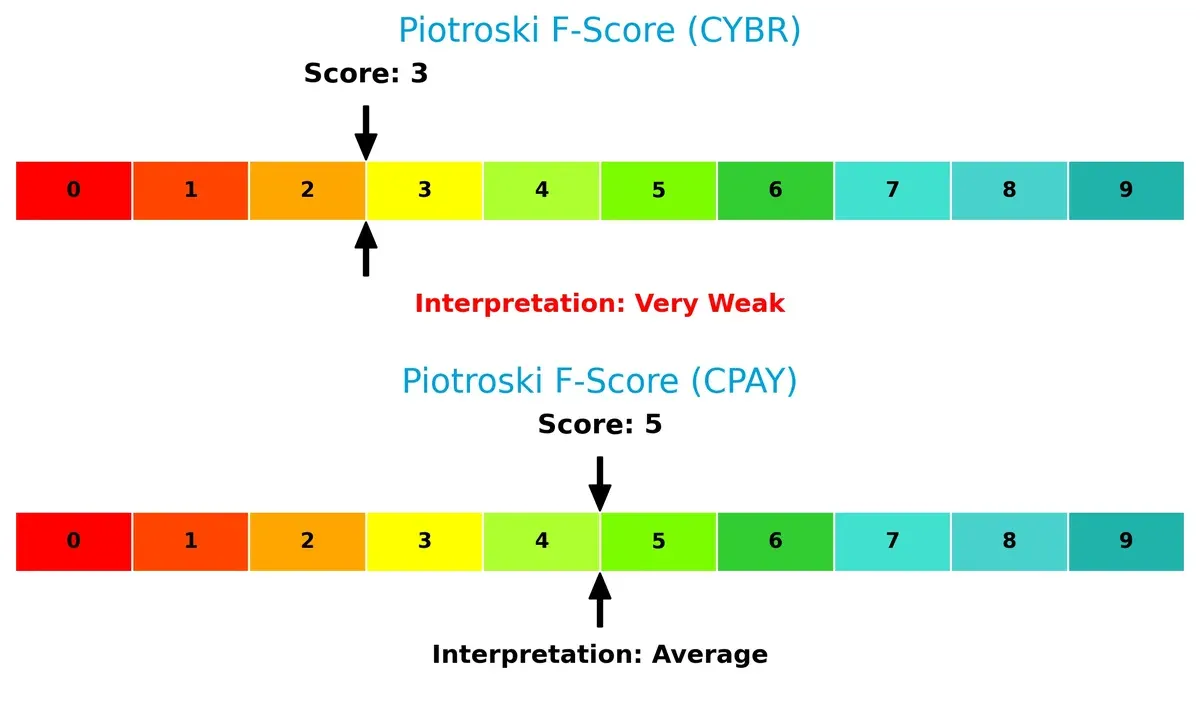
Financial Health: Quality of Operations
CyberArk posts a weak Piotroski F-Score of 3, flagging operational and financial health concerns. Corpay fares better at 5, suggesting moderate financial strength but room for improvement:
How are the two companies positioned?
This section dissects CyberArk and Corpay’s operational DNA by comparing revenue distribution and internal strengths and weaknesses. The goal is to confront their economic moats to identify which model offers the most resilient competitive advantage today.
Revenue Segmentation: The Strategic Mix
This comparison dissects how CyberArk Software Ltd. and Corpay, Inc. diversify income streams and where their primary sector bets lie:
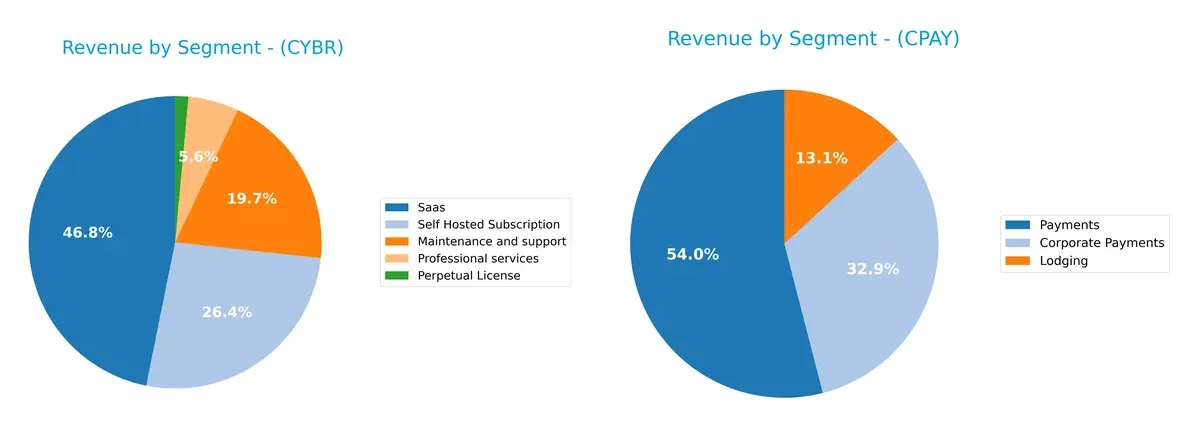
CyberArk spreads revenue across Saas ($469M), Self Hosted Subscription ($265M), and Maintenance ($197M), showing a balanced mix. Corpay anchors heavily on Payments ($2B), with Corporate Payments ($1.22B) and Lodging ($489M) trailing, revealing concentration risk. CyberArk’s diversified model supports ecosystem lock-in, while Corpay relies on infrastructure dominance in payments, exposing it to sector volatility.
Strengths and Weaknesses Comparison
This table compares the strengths and weaknesses of CyberArk Software Ltd. and Corpay, Inc.:
CyberArk Strengths
- Diverse product mix including SaaS, subscriptions, maintenance, and professional services
- Strong current and quick ratios at 2.0 indicate liquidity
- Favorable debt to assets ratio at 25% supports financial stability
- High fixed asset turnover of 32.73 signals efficient asset use
Corpay Strengths
- Strong profitability with net margin at 23.6% and ROE at 27.6%
- Favorable WACC at 6.26% aids capital efficiency
- Significant revenue from large markets like US, UK, and Brazil
- Fixed asset turnover of 9.59 shows good asset utilization
CyberArk Weaknesses
- Negative net margin (-10.8%), ROE (-6.1%) and ROIC (-2.7%) indicate profitability struggles
- Unfavorable interest coverage at 0 raises solvency concerns
- High price-to-book ratio (9.31) suggests overvaluation risks
- Asset turnover low at 0.28 limits revenue generation from assets
Corpay Weaknesses
- Current ratio below 1.0 (0.98) signals possible liquidity risk
- High debt-to-equity ratio (2.58) increases financial leverage risk
- Unfavorable asset turnover (0.17) limits efficiency
- Zero dividend yield may deter income-focused investors
CyberArk shows a diversified revenue base and solid liquidity but suffers from profitability and asset efficiency issues. Corpay delivers strong profitability and market reach but faces liquidity and leverage challenges. These contrasts highlight differing strategic priorities amid slight unfavorable financial ratio evaluations for both.
The Moat Duel: Analyzing Competitive Defensibility
A structural moat is the only lasting barrier that protects long-term profits from relentless competitive erosion. Let’s examine how these companies defend their turf:
CyberArk Software Ltd.: Intangible Assets Moat
CyberArk’s moat stems from specialized cybersecurity software, reflected in high gross margins (74%) but negative EBIT margins signal investment phases. Expansion in cloud security could deepen its moat by 2026.
Corpay, Inc.: Cost Advantage Moat
Corpay leverages scale and operational efficiency to deliver robust EBIT (43%) and net margins (24%), contrasting CyberArk’s profit struggles. Its global payment processing scale supports steady moat expansion.
Moat Battle: Intangible Security vs. Cost-Driven Scale
CyberArk’s intangible asset moat is narrower due to negative returns despite margin strength. Corpay’s cost advantage is wider with positive ROIC exceeding WACC. Corpay is better positioned to defend market share amid rising competition.
Which stock offers better returns?
The past year shows CyberArk’s strong 51.3% gain slowing recently, while Corpay’s steady 19.8% rise accelerates with buyer dominance in volume.
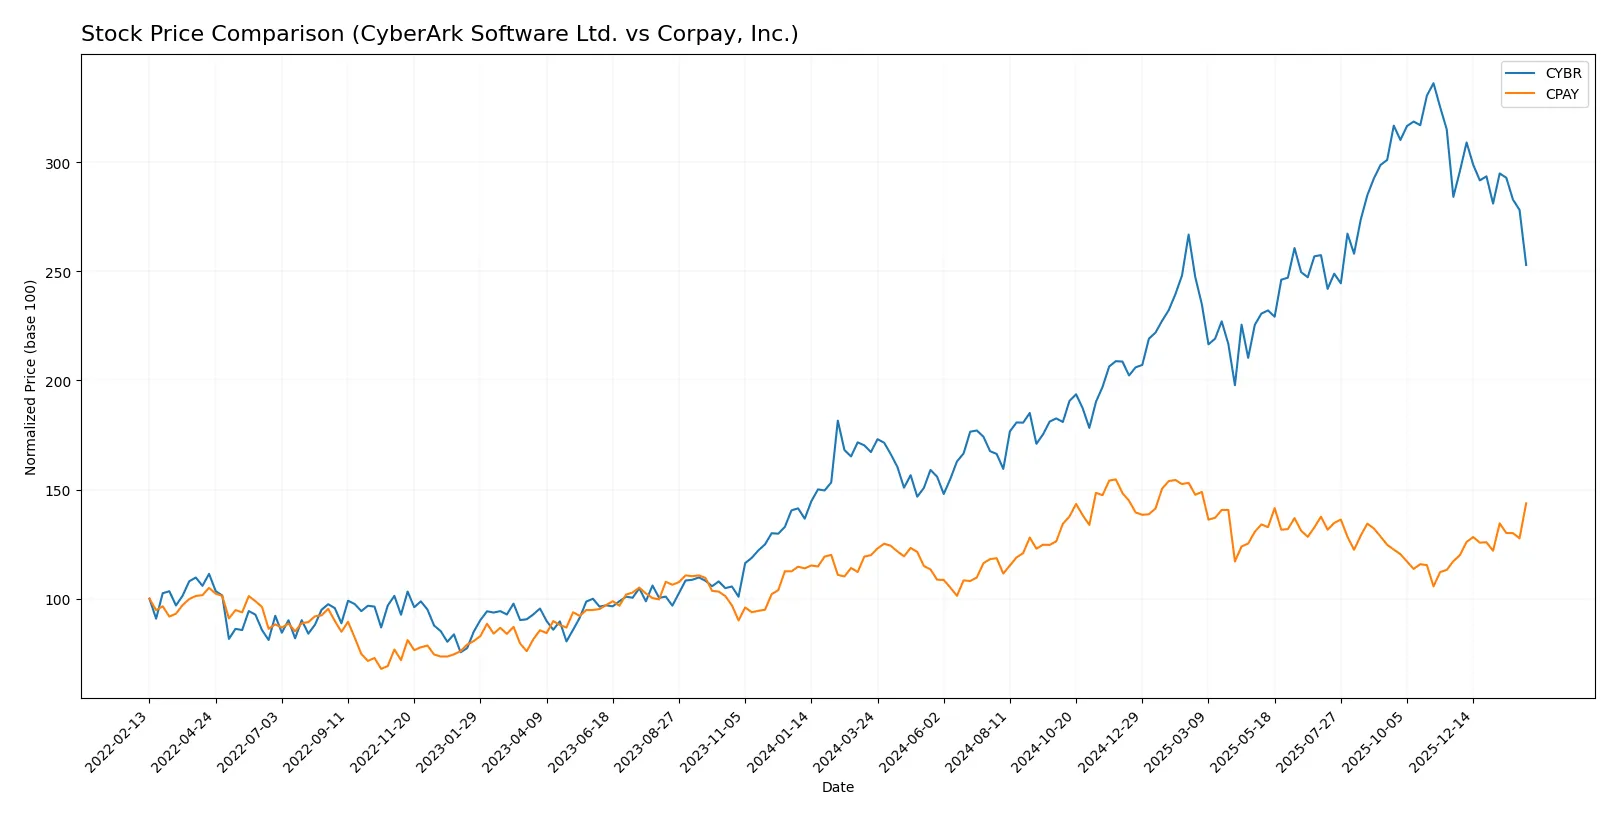
Trend Comparison
CyberArk’s stock rose 51.3% over 12 months, signaling a bullish trend with decelerating momentum. It hit a high of 520.78 and a low of 227.32.
Corpay’s stock gained 19.8% over 12 months, maintaining a bullish trend with accelerating momentum. Its recent 22.6% rise confirms strong upward movement.
CyberArk outperformed Corpay in total returns, but Corpay’s accelerating trend and buyer dominance suggest growing market confidence.
Target Prices
Analysts present confident upside for CyberArk Software Ltd. and Corpay, Inc. based on current target price consensus.
| Company | Target Low | Target High | Consensus |
|---|---|---|---|
| CyberArk Software Ltd. | 411 | 502 | 466.17 |
| Corpay, Inc. | 300 | 390 | 359.33 |
CyberArk’s consensus target of 466.17 implies about 19% upside versus the current 392 price. Corpay’s 359.33 target also suggests 1.5% potential gain, reflecting moderate analyst optimism.

Don’t Let Luck Decide Your Entry Point
Optimize your entry points with our advanced ProRealTime indicators. You’ll get efficient buy signals with precise price targets for maximum performance. Start outperforming now!
How do institutions grade them?
The following tables summarize recent institutional grades for CyberArk Software Ltd. and Corpay, Inc.:
CyberArk Software Ltd. Grades
These are the latest grades assigned by reputable firms for CyberArk Software Ltd.:
| Grading Company | Action | New Grade | Date |
|---|---|---|---|
| Oppenheimer | Maintain | Outperform | 2024-10-22 |
| Keybanc | Maintain | Overweight | 2024-10-18 |
| Mizuho | Maintain | Outperform | 2024-10-17 |
| BTIG | Maintain | Buy | 2024-10-09 |
| Barclays | Maintain | Overweight | 2024-10-07 |
| Wedbush | Maintain | Outperform | 2024-10-01 |
| Jefferies | Maintain | Buy | 2024-09-24 |
| Keybanc | Maintain | Overweight | 2024-08-09 |
| Citigroup | Maintain | Buy | 2024-08-09 |
| Susquehanna | Maintain | Positive | 2024-08-09 |
Corpay, Inc. Grades
Here are the recent institutional grades assigned to Corpay, Inc.:
| Grading Company | Action | New Grade | Date |
|---|---|---|---|
| Mizuho | Maintain | Neutral | 2026-02-06 |
| JP Morgan | Maintain | Overweight | 2026-02-05 |
| RBC Capital | Maintain | Sector Perform | 2026-02-05 |
| Morgan Stanley | Maintain | Overweight | 2026-02-05 |
| Morgan Stanley | Upgrade | Overweight | 2026-01-26 |
| Oppenheimer | Maintain | Outperform | 2026-01-12 |
| Oppenheimer | Upgrade | Outperform | 2025-12-05 |
| UBS | Maintain | Neutral | 2025-11-06 |
| RBC Capital | Maintain | Sector Perform | 2025-11-06 |
| JP Morgan | Maintain | Overweight | 2025-11-06 |
Which company has the best grades?
CyberArk Software Ltd. consistently receives strong buy and outperform ratings from multiple firms. Corpay, Inc. holds a mix of overweight, sector perform, and neutral grades with some recent upgrades. Investors may view CyberArk’s grades as a stronger signal of confidence and growth potential.
Risks specific to each company
The following categories identify critical pressure points and systemic threats facing CyberArk Software Ltd. and Corpay, Inc. in the 2026 market environment:
1. Market & Competition
CyberArk Software Ltd.
- Faces intense competition in cybersecurity software; negative margins signal pricing pressure.
Corpay, Inc.
- Operates in payments with solid margins but faces disruption from fintech startups.
2. Capital Structure & Debt
CyberArk Software Ltd.
- Moderate debt-to-equity of 0.51 with strong liquidity ratios; interest coverage is zero, a red flag.
Corpay, Inc.
- High leverage with debt-to-equity at 2.58; interest coverage moderate but debt level poses risk.
3. Stock Volatility
CyberArk Software Ltd.
- Beta near 0.93 implies moderate volatility; trading range wide, reflecting investor uncertainty.
Corpay, Inc.
- Lower beta at 0.81 indicates less volatility; price range narrower but recent price spike suggests momentum.
4. Regulatory & Legal
CyberArk Software Ltd.
- Cybersecurity sector faces increasing regulations globally; compliance costs could rise.
Corpay, Inc.
- Payments industry under scrutiny for anti-money laundering and data privacy; regulatory risk elevated.
5. Supply Chain & Operations
CyberArk Software Ltd.
- Software delivery less impacted by supply chain; operational efficiency challenged by low asset turnover.
Corpay, Inc.
- Operations rely on global payment networks; asset turnover low, indicating potential inefficiencies.
6. ESG & Climate Transition
CyberArk Software Ltd.
- Limited public ESG disclosures; cybersecurity relevance positive but environmental impact unclear.
Corpay, Inc.
- Growing pressure to enhance ESG practices; payments sector vulnerable to climate transition risks.
7. Geopolitical Exposure
CyberArk Software Ltd.
- Based in Israel with global footprint; geopolitical tensions in Middle East could affect stability.
Corpay, Inc.
- US-based with international operations; exposure to trade policies and global economic shifts.
Which company shows a better risk-adjusted profile?
CyberArk’s largest risk is its negative profitability and poor interest coverage, signaling operational stress despite healthier liquidity. Corpay’s elevated leverage and low liquidity ratios increase financial vulnerability despite stronger earnings. I view CyberArk as having a slightly better risk-adjusted profile due to its conservative capital structure and safer Altman Z-score (5.22 vs. 1.59). However, Corpay’s high debt and distress-zone bankruptcy risk demand caution. Recently, CyberArk’s zero interest coverage alarms me more, as it jeopardizes debt servicing despite favorable liquidity.
Final Verdict: Which stock to choose?
CyberArk Software Ltd. (CYBR) impresses with its growing operational efficiency and robust liquidity, signaling a potential turnaround despite current value destruction. Its high investment in R&D fuels innovation, but profitability remains a point of vigilance. CYBR suits portfolios seeking aggressive growth with a tolerance for volatility and recovery risk.
Corpay, Inc. (CPAY) commands a strategic moat through its sustainable cash flow and strong return on equity, underpinning consistent value creation. Though burdened by higher leverage and a tighter liquidity position, CPAY offers better stability relative to CyberArk. It fits well with GARP investors aiming for growth balanced by reasonable financial discipline.
If you prioritize dynamic innovation and are comfortable navigating near-term profitability challenges, CyberArk outshines as the compelling choice due to its accelerating operational improvements. However, if you seek a more stable income profile with proven capital efficiency, Corpay offers better stability and a clearer path to value creation despite some leverage risks.
Disclaimer: Investment carries a risk of loss of initial capital. The past performance is not a reliable indicator of future results. Be sure to understand risks before making an investment decision.
Go Further
I encourage you to read the complete analyses of CyberArk Software Ltd. and Corpay, Inc. to enhance your investment decisions: