Home > Comparison > Technology > GLW vs TRMB
The strategic rivalry between Corning Incorporated and Trimble Inc. shapes the Technology sector’s evolution. Corning operates as a diversified hardware and materials powerhouse with a broad industrial footprint. Trimble focuses on precision software and hardware solutions targeting construction, agriculture, and transportation niches. This head-to-head contrasts scale and diversification with specialized innovation. This analysis will determine which trajectory offers a superior risk-adjusted return for a balanced portfolio in 2026.

Table of contents
Companies Overview
Corning Incorporated and Trimble Inc. stand as pivotal players in the technology hardware sector, driving innovation across diverse industries.
Corning Incorporated: Leader in Advanced Glass and Optical Solutions
Corning Incorporated commands a global market position in display technologies and optical communications. Its revenue stems from selling glass substrates for LCDs, OLEDs, optical fibers, and specialty materials. In 2026, Corning sharpens its focus on expanding environmental technologies and life sciences, reinforcing its diversified portfolio.
Trimble Inc.: Innovator in Precision Technology Systems
Trimble Inc. specializes in technology solutions for construction, agriculture, geospatial, and transportation sectors. Its core income comes from software and hardware that enhance field operations and asset management. Trimble’s strategic thrust in 2026 emphasizes integrated software platforms for infrastructure and mobility, targeting workflow optimization and automation.
Strategic Collision: Similarities & Divergences
Both companies operate within hardware and equipment, yet Corning builds on a materials science moat, while Trimble leverages software-driven process innovation. Their battle for market share unfolds primarily in industrial technology adoption. Corning’s scale and diversified segments contrast with Trimble’s focused, high-growth niche, shaping distinct investment profiles.
Income Statement Comparison
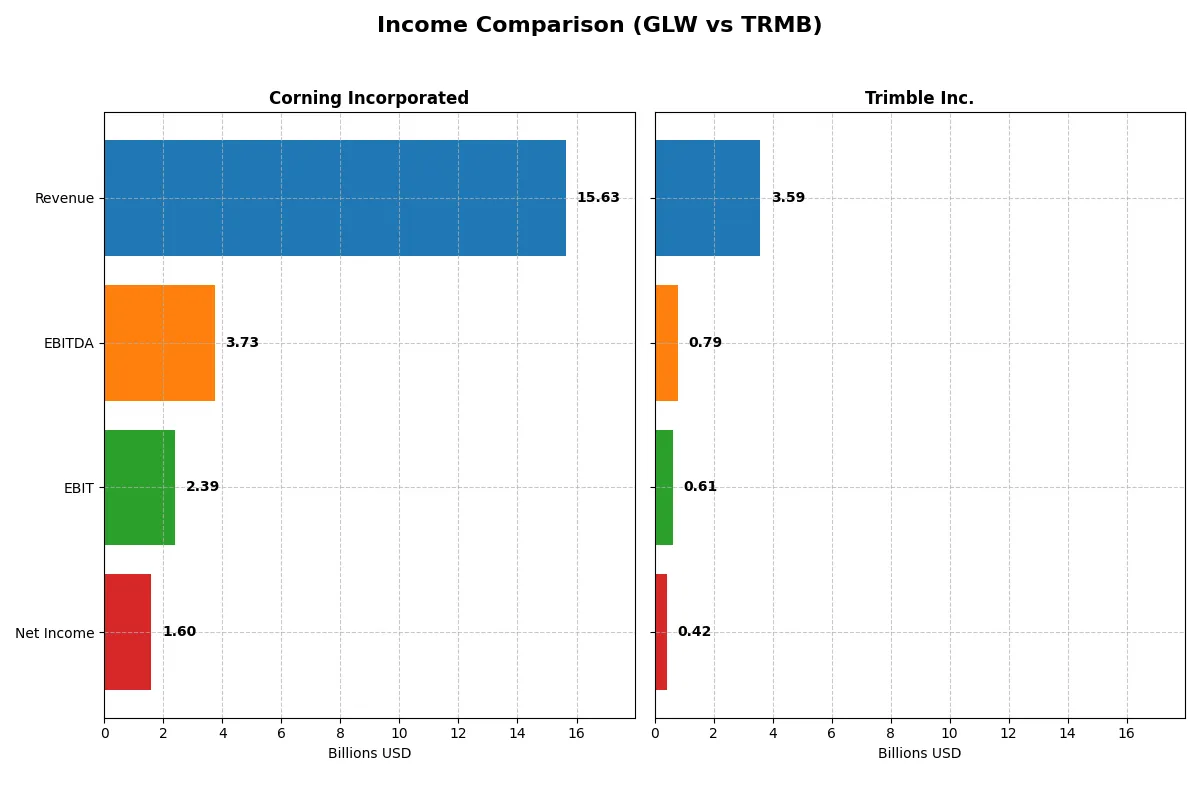
This data dissects the core profitability and scalability of both corporate engines to reveal who dominates the bottom line:
| Metric | Corning Incorporated (GLW) | Trimble Inc. (TRMB) |
|---|---|---|
| Revenue | 15.6B | 3.59B |
| Cost of Revenue | 10.1B | 1.14B |
| Operating Expenses | 3.18B | 1.84B |
| Gross Profit | 5.51B | 2.45B |
| EBITDA | 3.74B | 790M |
| EBIT | 2.39B | 610M |
| Interest Expense | 336M | 74M |
| Net Income | 1.60B | 424M |
| EPS | 1.86 | 1.77 |
| Fiscal Year | 2025 | 2025 |
Income Statement Analysis: The Bottom-Line Duel
This income statement comparison reveals the true operational efficiency and profit quality of Corning Incorporated and Trimble Inc.
Corning Incorporated Analysis
Corning’s revenue climbed steadily from 14.1B in 2021 to 15.6B in 2025, showcasing solid top-line growth. Net income fluctuated, peaking at 1.9B in 2021 before dipping to 506M in 2024, then recovering to 1.6B in 2025. Gross and net margins remain healthy, with 35.3% and 10.2% respectively in 2025. The sharp EBIT growth of 109% in the latest year signals improving operational leverage and efficiency.
Trimble Inc. Analysis
Trimble’s revenue peaked at 3.8B in 2023 but declined to 3.6B by 2025, reflecting top-line pressure. Net income followed a similar path, rising to 1.5B in 2024 before plunging to 424M in 2025. Despite a robust gross margin of 68.3% in 2025, net margin contracted to 11.8%, dragged by a 71% net margin decline year-over-year. The sharp EBIT drop (-71%) indicates weakening profitability and margin compression.
Margin Strength vs. Revenue Resilience
Corning demonstrates stronger revenue growth and margin expansion, with improving EBIT and net income momentum. Trimble, despite higher gross margins, suffers from declining revenue and deteriorating net profitability. Corning’s profile suits investors seeking growing operational efficiency, while Trimble reflects a riskier, margin-challenged position.
Financial Ratios Comparison
These vital ratios act as a diagnostic tool to expose the underlying fiscal health, valuation premiums, and capital efficiency of the companies compared below:
| Ratios | Corning Incorporated (GLW) | Trimble Inc. (TRMB) |
|---|---|---|
| ROE | 13.52% | 7.27% |
| ROIC | 7.57% | 6.48% |
| P/E | 47.18 | 43.87 |
| P/B | 6.38 | 3.19 |
| Current Ratio | 1.59 | 1.09 |
| Quick Ratio | 1.04 | 0.96 |
| D/E (Debt/Equity) | 0.71 | 0.24 |
| Debt-to-Assets | 27.23% | 14.95% |
| Interest Coverage | 6.94 | 8.17 |
| Asset Turnover | 0.50 | 0.39 |
| Fixed Asset Turnover | 1.05 | 19.62 |
| Payout Ratio | 62.59% | 0% |
| Dividend Yield | 1.33% | 0% |
| Fiscal Year | 2025 | 2025 |
Efficiency & Valuation Duel: The Vital Signs
Financial ratios act as a company’s DNA, exposing hidden risks and revealing operational excellence critical for informed investment decisions.
Corning Incorporated
Corning shows a neutral ROE of 13.52% and a favorable net margin at 10.21%, signaling solid profitability. However, its P/E of 47.18 and P/B of 6.38 mark the stock as expensive and stretched. The company returns value through a 1.33% dividend yield, balancing shareholder rewards with reinvestment in R&D.
Trimble Inc.
Trimble posts a favorable net margin of 11.82% but a low ROE of 7.27%, suggesting weaker core profitability. The P/E of 43.87 and P/B of 3.19 also indicate an expensive valuation. It pays no dividend, instead prioritizing growth via heavy R&D spending, reflecting a reinvestment strategy over immediate shareholder returns.
Premium Valuation vs. Operational Safety
Corning combines stronger shareholder returns and balanced profitability with a more stretched valuation. Trimble trades at a slight discount but shows lower profitability and no dividends. Investors seeking income might prefer Corning’s profile, while those favoring growth and reinvestment may lean toward Trimble.
Which one offers the Superior Shareholder Reward?
Corning (GLW) pays a steady dividend yield near 1.3% in 2025 with a high payout ratio of 62.6%, signaling strong shareholder income but potential risk if earnings dip. Its buyback intensity appears moderate but consistent, supporting total return. Trimble (TRMB) opts out of dividends, reinvesting heavily in growth, reflected in a low free cash flow yield and no payout ratio. Trimble’s buyback activity is minimal, emphasizing capital allocation toward innovation and expansion. Historically, Corning’s dividend-plus-buyback model offers reliable income amid cyclical markets. Trimble’s growth reinvestment suits aggressive investors but carries higher volatility. I judge Corning’s balanced distribution as more sustainable and attractive for total shareholder return in 2026.
Comparative Score Analysis: The Strategic Profile
The radar chart reveals the fundamental DNA and trade-offs of Corning Incorporated and Trimble Inc., highlighting their core financial strengths and vulnerabilities:
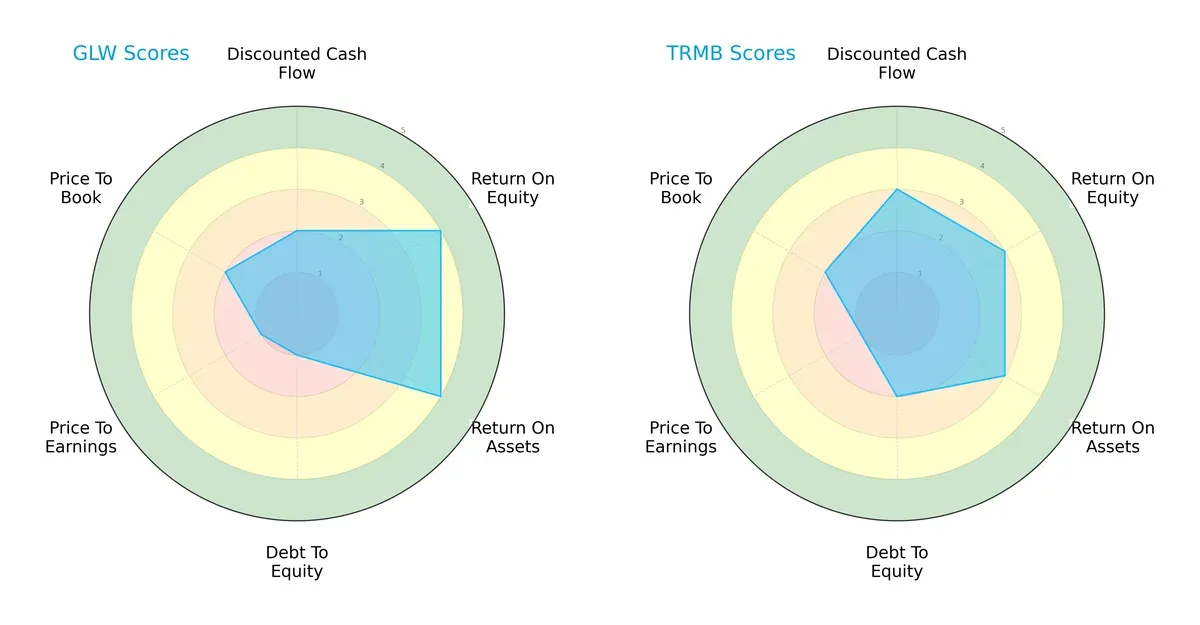
Corning exhibits stronger operational efficiency with higher ROE (4 vs. 3) and ROA (4 vs. 3) scores, signaling better asset utilization. Trimble leads slightly in discounted cash flow (3 vs. 2), suggesting more moderate valuation expectations. However, Corning’s very poor debt-to-equity (1 vs. 2) and valuation scores (P/E at 1 vs. 1; P/B at 2 vs. 2) reveal leverage and pricing weaknesses. Overall, Corning leans on operational prowess, while Trimble presents a more balanced but moderate profile.
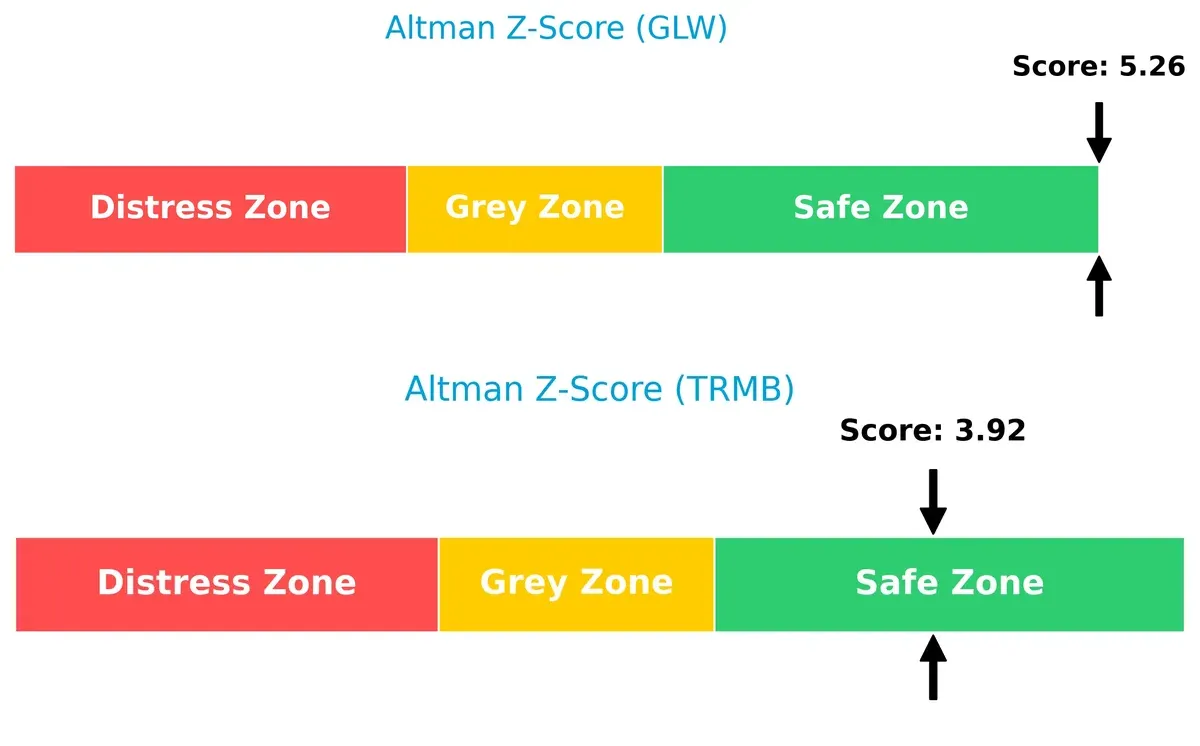
Bankruptcy Risk: Solvency Showdown
Corning’s Altman Z-Score at 5.26 surpasses Trimble’s 3.92, both safely above distress thresholds, indicating robust long-term solvency but a clear edge for Corning:
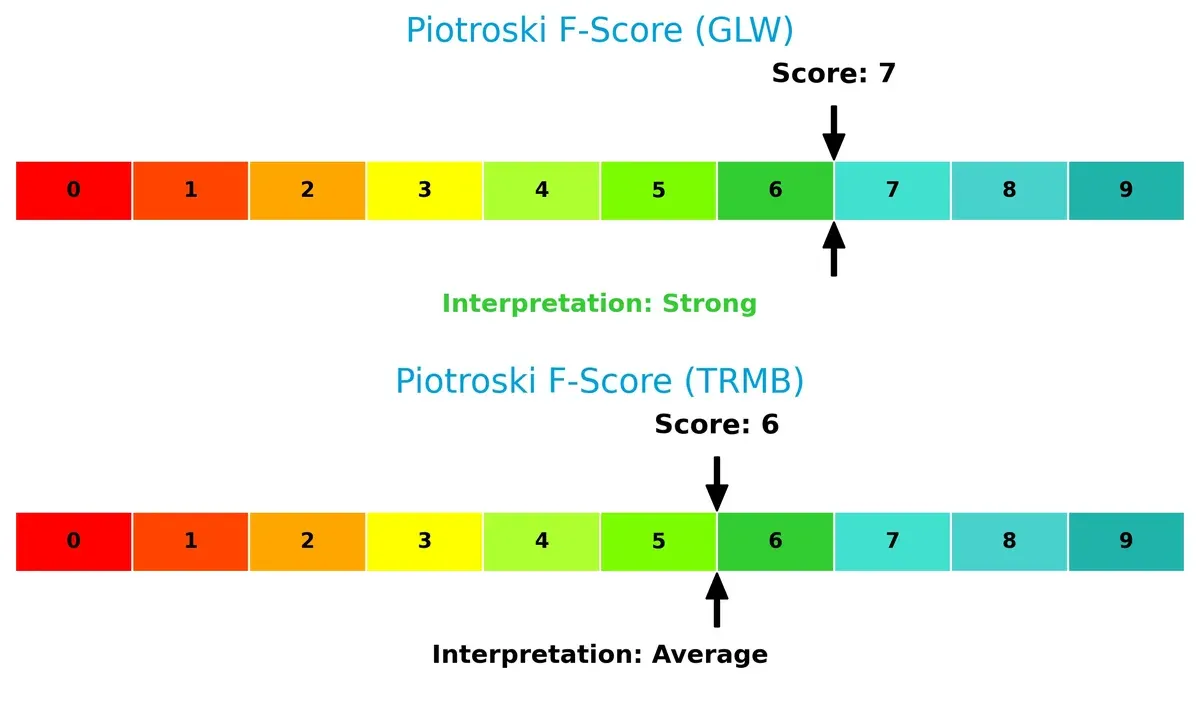
Financial Health: Quality of Operations
Corning’s Piotroski F-Score of 7 signals strong financial health, outperforming Trimble’s moderate 6, which may hint at emerging internal weaknesses:
How are the two companies positioned?
This section dissects the operational DNA of Corning and Trimble by comparing their revenue distribution and internal dynamics. The objective is to confront their economic moats to identify the more resilient, sustainable competitive advantage in today’s market.
Revenue Segmentation: The Strategic Mix
This visual comparison dissects how Corning Incorporated and Trimble Inc. diversify their income streams and where their primary sector bets lie:
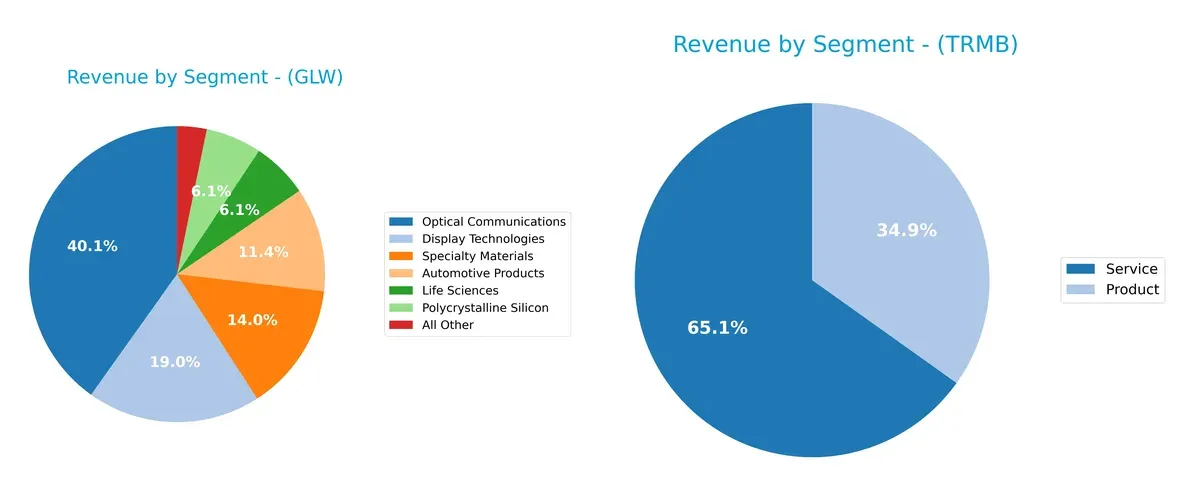
Corning’s revenue spreads broadly, anchored by Optical Communications at $6.27B and Display Technologies at $3B. Specialty Materials and Automotive Products add depth, showing a balanced ecosystem approach. In contrast, Trimble’s latest mix pivots around a two-segment split: Services at $2.4B and Products at $1.28B, indicating a more concentrated focus with less segment diversification. Corning’s mix reduces concentration risk, while Trimble’s focus may leverage service-driven recurring revenue but faces dependency risks.
Strengths and Weaknesses Comparison
This table compares the Strengths and Weaknesses of Corning Incorporated and Trimble Inc.:
Corning Incorporated Strengths
- Diverse product segments including Optical Communications and Specialty Materials
- Strong global presence with significant Asia Pacific and North America revenues
- Favorable net margin and current/quick ratios
- Moderate debt levels with good interest coverage
Trimble Inc. Strengths
- Focused product and service revenue streams with growth in service segment
- Favorable debt-to-equity and debt-to-assets ratios
- High fixed asset turnover indicating efficient asset use
- Favorable interest coverage despite lower ROE
Corning Incorporated Weaknesses
- High P/E and P/B ratios indicate potential overvaluation
- ROIC below WACC suggests limited value creation
- Neutral ROE and asset turnover may limit profitability gains
Trimble Inc. Weaknesses
- Unfavorable ROE and WACC point to cost of capital challenges
- Unfavorable net margin relative to debt ratios
- No dividend yield reduces income appeal
- Lower current and quick ratios may affect liquidity
Corning’s diversified portfolio and geographic reach strengthen its market resilience, though valuation and capital efficiency concerns persist. Trimble’s asset efficiency and debt management stand out but face profitability and liquidity challenges, affecting its strategic flexibility.
The Moat Duel: Analyzing Competitive Defensibility
A structural moat is the sole shield protecting long-term profits from relentless competition erosion. Let’s dissect the moats at play:
Corning Incorporated (GLW): Intangible Assets Driving Material Innovation
Corning leverages decades of proprietary glass technology and R&D expertise. This intangible asset moat supports stable margins and a growing ROIC trend despite currently shedding value. New specialty materials and life sciences markets could deepen its competitive edge in 2026.
Trimble Inc. (TRMB): Integrated Software Ecosystem in Geospatial and Construction
Trimble’s moat centers on its integrated software and hardware platform, creating switching costs for professional users. However, its declining ROIC and profit erosion signal weakening defensibility. Expansion into autonomous and mobility solutions offers growth potential but faces stiff competition.
Moat Strength: Intangible Innovation vs. Software Integration
Corning’s intangible assets present a wider moat with improving profitability, while Trimble struggles with a shrinking economic moat amid competitive pressures. Corning appears better positioned to defend and expand its market share long-term.
Which stock offers better returns?
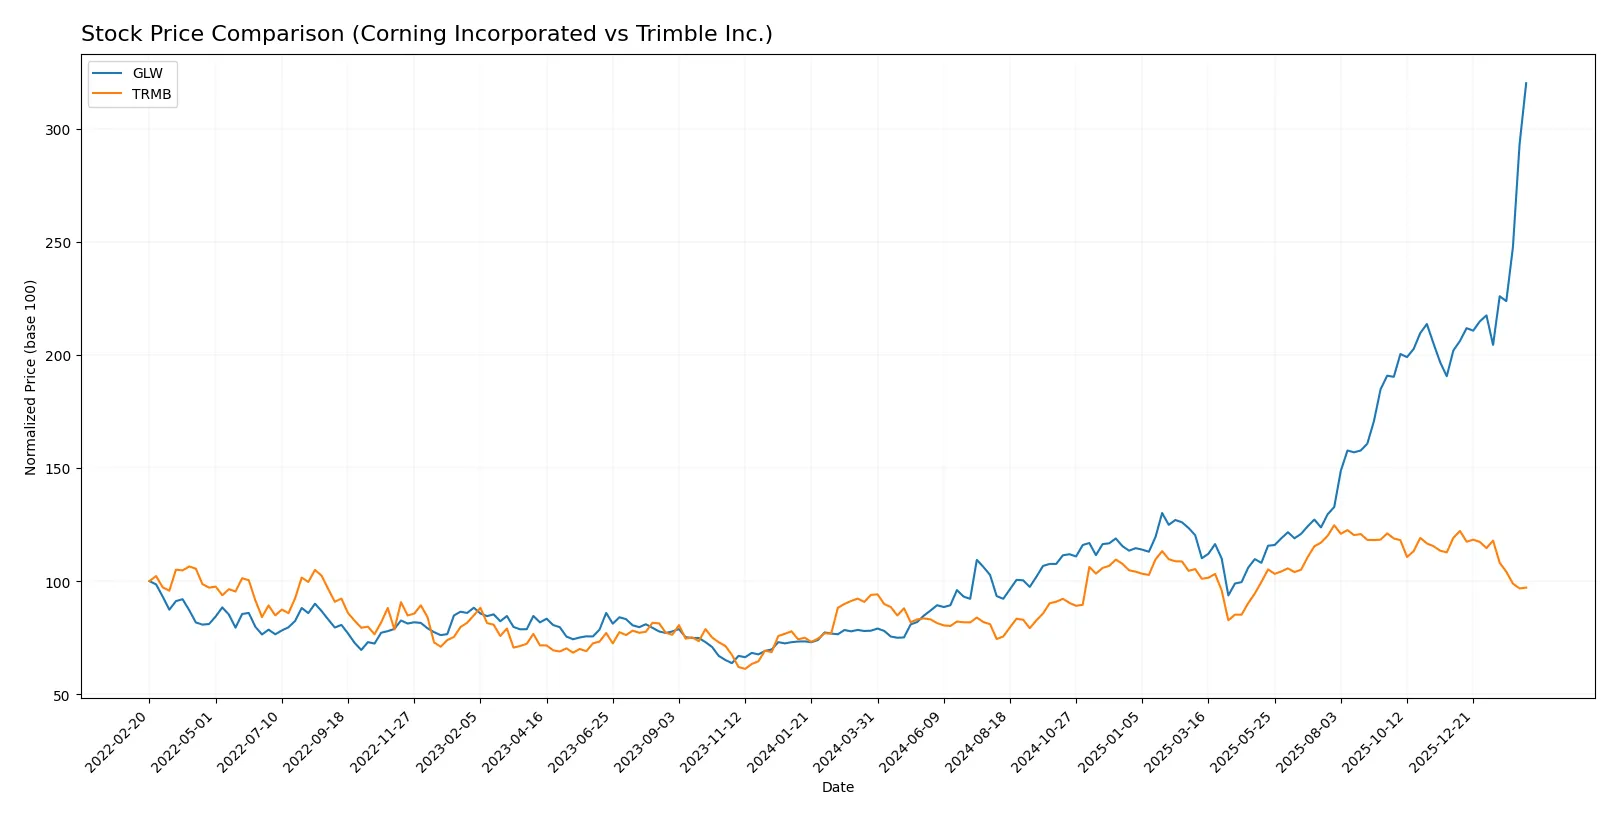
Over the past year, Corning Incorporated’s stock surged sharply with accelerating gains, while Trimble Inc. showed mild overall growth but recent weakening.
Trend Comparison
Corning Incorporated’s stock climbed 310% over the last 12 months, marking a bullish trend with accelerating momentum and a high volatility of 20.87. It reached a peak price of 133.46 and a low of 31.27.
Trimble Inc.’s stock rose 3.43% over the same period, signaling a mild bullish trend but with decelerating momentum and lower volatility at 9.67. Recent performance weakened, showing an 18.45% decline.
Corning’s stock outperformed Trimble’s significantly, delivering the highest market returns and stronger price acceleration during the past year.
Target Prices
Analysts present a moderate target consensus for Corning Incorporated and Trimble Inc., suggesting room for upside potential.
| Company | Target Low | Target High | Consensus |
|---|---|---|---|
| Corning Incorporated | 100 | 135 | 118.67 |
| Trimble Inc. | 86 | 101 | 95 |
Corning’s consensus target of 118.67 sits below its current price of 133.46, indicating potential overvaluation. Trimble’s consensus target of 95 is substantially above its 66.4 current price, signaling strong analyst optimism.

Don’t Let Luck Decide Your Entry Point
Optimize your entry points with our advanced ProRealTime indicators. You’ll get efficient buy signals with precise price targets for maximum performance. Start outperforming now!
How do institutions grade them?
The following are institutional grade updates for Corning Incorporated and Trimble Inc.:
Corning Incorporated Grades
This table summarizes recent analyst grades for Corning Incorporated from major firms.
| Grading Company | Action | New Grade | Date |
|---|---|---|---|
| Morgan Stanley | Maintain | Equal Weight | 2026-01-29 |
| Mizuho | Maintain | Outperform | 2026-01-29 |
| Citigroup | Maintain | Buy | 2026-01-29 |
| Susquehanna | Maintain | Positive | 2026-01-29 |
| JP Morgan | Maintain | Overweight | 2026-01-28 |
| Citigroup | Maintain | Buy | 2026-01-12 |
| Morgan Stanley | Maintain | Equal Weight | 2025-12-17 |
| UBS | Maintain | Buy | 2025-11-21 |
| UBS | Maintain | Buy | 2025-10-29 |
| Susquehanna | Maintain | Positive | 2025-10-29 |
Trimble Inc. Grades
This table presents recent analyst grades for Trimble Inc. from recognized grading institutions.
| Grading Company | Action | New Grade | Date |
|---|---|---|---|
| Wells Fargo | Maintain | Overweight | 2026-02-12 |
| Barclays | Maintain | Overweight | 2026-01-12 |
| Keybanc | Upgrade | Overweight | 2025-12-16 |
| Piper Sandler | Maintain | Overweight | 2025-11-07 |
| JP Morgan | Maintain | Overweight | 2025-09-19 |
| Raymond James | Maintain | Outperform | 2025-08-07 |
| JP Morgan | Maintain | Overweight | 2025-08-07 |
| Oppenheimer | Maintain | Outperform | 2025-08-07 |
| Oppenheimer | Maintain | Outperform | 2025-07-17 |
| JP Morgan | Maintain | Overweight | 2025-07-10 |
Which company has the best grades?
Trimble Inc. consistently receives “Overweight” and “Outperform” ratings, indicating stronger analyst conviction. Corning’s grades cluster around “Buy” and “Equal Weight,” suggesting a more cautious stance. Investors may perceive Trimble as having higher growth expectations.
Risks specific to each company
In the 2026 market environment, the following categories identify critical pressure points and systemic threats facing Corning Incorporated (GLW) and Trimble Inc. (TRMB):
1. Market & Competition
Corning Incorporated
- Faces intense competition in display and optical technologies, with pressure from innovation cycles and price sensitivity.
Trimble Inc.
- Competes in software and hardware solutions with rapid tech shifts and high customer customization demands.
2. Capital Structure & Debt
Corning Incorporated
- Moderate leverage (D/E 0.71) with solid interest coverage (7.11x), but slightly weaker debt-to-equity rating.
Trimble Inc.
- Low leverage (D/E 0.24) and strong interest coverage (8.19x) indicate conservative capital structure and lower financial risk.
3. Stock Volatility
Corning Incorporated
- Beta of 1.12 suggests moderate volatility, typical for hardware industry leaders.
Trimble Inc.
- Higher beta at 1.58 signals greater stock volatility and sensitivity to market swings.
4. Regulatory & Legal
Corning Incorporated
- Exposure to global trade regulations and environmental compliance in manufacturing and materials.
Trimble Inc.
- Faces regulatory scrutiny in data privacy, software compliance, and international technology exports.
5. Supply Chain & Operations
Corning Incorporated
- Complex supply chain for glass and specialty materials vulnerable to raw material price fluctuations.
Trimble Inc.
- Supply chain risk from reliance on precision hardware components and software integration challenges.
6. ESG & Climate Transition
Corning Incorporated
- Invests in environmental tech but faces pressure to reduce emissions and resource consumption in manufacturing.
Trimble Inc.
- ESG risks tied to sustainable software solutions and energy use in operations, with growing stakeholder expectations.
7. Geopolitical Exposure
Corning Incorporated
- Significant global footprint exposes it to tariffs, trade wars, and geopolitical tensions.
Trimble Inc.
- Moderate international exposure with risk from shifting global tech policies and export controls.
Which company shows a better risk-adjusted profile?
Corning’s key risk lies in capital structure with moderate leverage that demands cautious monitoring. Trimble faces higher stock volatility and regulatory complexity, increasing operational risk. Corning’s stronger Altman Z-Score (5.26 vs. 3.92) and higher Piotroski score (7 vs. 6) suggest better financial stability. Despite Trimble’s conservative debt, its elevated beta and regulatory challenges tilt the risk-adjusted profile in Corning’s favor. The recent widening in Trimble’s trading range and weaker ROE underscore this concern.
Final Verdict: Which stock to choose?
Corning Incorporated’s superpower lies in its steadily improving profitability and robust cash flow generation. Despite a valuation premium and a slight value destruction indicated by ROIC versus WACC, its growing operating returns and solid balance sheet make it a compelling candidate for investors targeting aggressive growth with a tolerance for cyclical fluctuations. The main point of vigilance remains its high price multiples, which could temper near-term upside.
Trimble Inc. boasts a strategic moat rooted in its niche technology solutions and recurring revenue streams. Its lower leverage and strong interest coverage suggest a safer financial profile compared to Corning. However, declining profitability trends and weaker cash flow dynamics imply caution. Trimble suits investors favoring GARP strategies, where moderate growth is balanced against reasonable valuation and financial stability.
If you prioritize dynamic growth with improving profitability and are comfortable with valuation risk, Corning outshines as the compelling choice due to its accelerating earnings momentum and strong cash conversion. However, if you seek more stability and a defined strategic niche, Trimble offers better downside protection despite its challenges, fitting investors focused on sustainable competitive advantages at a more measured pace.
Disclaimer: Investment carries a risk of loss of initial capital. The past performance is not a reliable indicator of future results. Be sure to understand risks before making an investment decision.
Go Further
I encourage you to read the complete analyses of Corning Incorporated and Trimble Inc. to enhance your investment decisions: