Home > Comparison > Technology > GLW vs TDY
The strategic rivalry between Corning Incorporated and Teledyne Technologies shapes the evolution of the technology hardware sector. Corning, a diversified materials innovator, excels in display and optical communications, while Teledyne drives growth through specialized instrumentation and aerospace electronics. This contest highlights a contrast between broad industrial innovation and focused high-tech solutions. This analysis aims to determine which trajectory offers superior risk-adjusted returns for a diversified portfolio in 2026.
Table of contents
Companies Overview
Corning Incorporated and Teledyne Technologies Incorporated stand as pivotal players in the hardware and equipment sector, shaping technology landscapes globally.
Corning Incorporated: Glass and Optical Innovation Leader
Corning commands the display technologies market with glass substrates for LCDs and OLEDs powering TVs and mobile devices. Its optical communications segment drives revenue through fibers, cables, and network components. In 2026, Corning sharpens its focus on specialty materials and environmental technologies, reinforcing its competitive edge in advanced glass and emissions control products.
Teledyne Technologies Incorporated: Precision Instrumentation Powerhouse
Teledyne excels in industrial growth markets by providing instrumentation, digital imaging, aerospace, and defense electronics. It generates revenue via sensors, imaging systems, and engineered defense solutions. The company’s 2026 strategy emphasizes integrated engineered systems and advanced sensor technologies, targeting defense and space applications for sustained innovation leadership.
Strategic Collision: Similarities & Divergences
While both operate in hardware and equipment, Corning pursues a materials-centric, product-driven approach, contrasting with Teledyne’s system integration and technology-enabling philosophy. Their competition centers on industrial and defense technology markets. Corning offers a broad materials moat, whereas Teledyne’s strength lies in specialized instrumentation. Their distinct business models create divergent risk and growth profiles for investors.
Income Statement Comparison
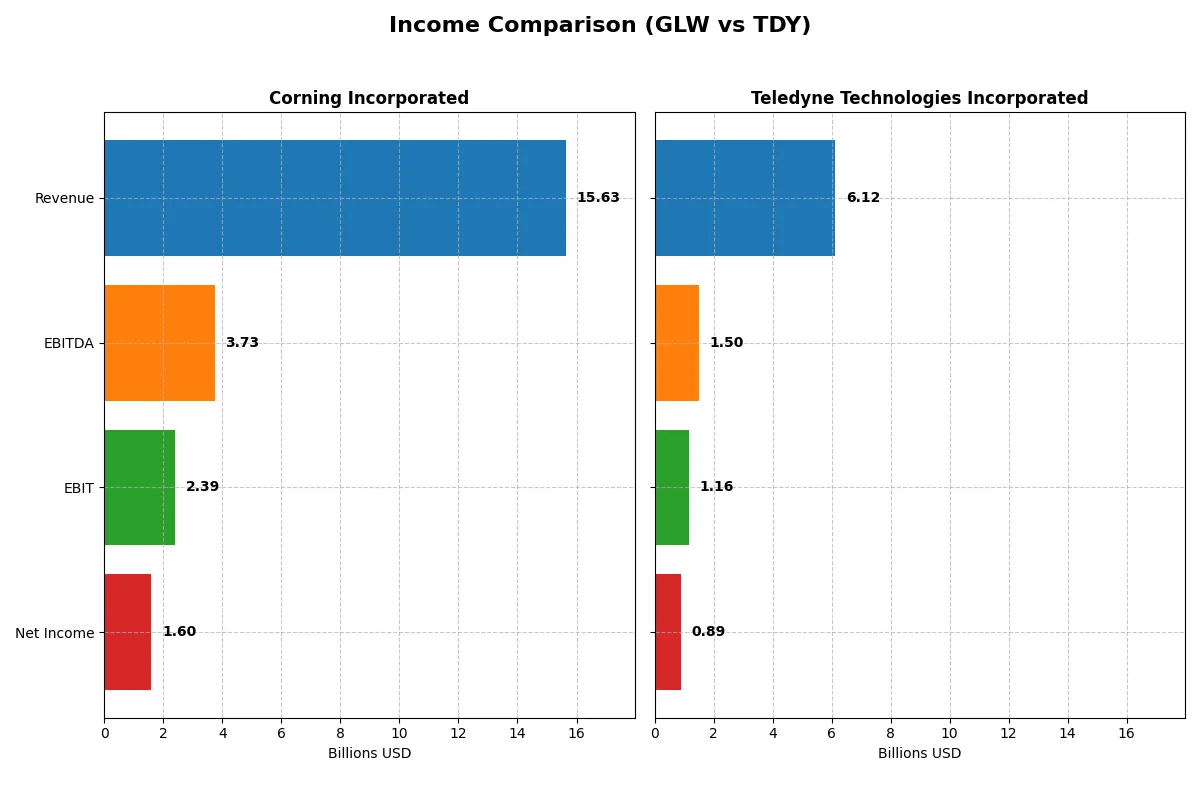
This data dissects the core profitability and scalability of both corporate engines, revealing who dominates the bottom line:
| Metric | Corning Incorporated (GLW) | Teledyne Technologies Incorporated (TDY) |
|---|---|---|
| Revenue | 15.6B | 6.1B |
| Cost of Revenue | 10.1B | 3.7B |
| Operating Expenses | 3.2B | 1.2B |
| Gross Profit | 5.5B | 2.4B |
| EBITDA | 3.7B | 1.5B |
| EBIT | 2.4B | 1.2B |
| Interest Expense | 336M | 60M |
| Net Income | 1.6B | 895M |
| EPS | 1.86 | 18.88 |
| Fiscal Year | 2025 | 2025 |
Income Statement Analysis: The Bottom-Line Duel
This income statement comparison reveals how efficiently Corning and Teledyne convert revenue into profit and sustain their corporate engines.
Corning Incorporated Analysis
Corning’s revenue climbed steadily from 14.1B in 2021 to 15.6B in 2025, reflecting a 19.1% jump in the latest year. Net income surged sharply to 1.6B in 2025, driven by a doubling of EBIT and a net margin above 10%. Its gross margin at 35.3% remains solid, signaling efficient cost control amid rising expenses.
Teledyne Technologies Incorporated Analysis
Teledyne grew revenue from 4.6B in 2021 to 6.1B in 2025, marking a 7.9% increase last year and a strong 32.5% over five years. Net income nearly doubled to 895M, supported by a robust net margin near 14.6%. Its higher gross margin of 39.2% and EBIT margin of 19% highlight superior operational efficiency compared to peers.
Margin Strength vs. Growth Momentum
Teledyne outperforms Corning in margin quality and consistent net income growth, reflecting a more efficient cost structure and capital allocation. Corning shows impressive recent earnings acceleration but lags in sustained net income growth. Investors seeking stable profitability might favor Teledyne’s profile, while those focused on rapid earnings momentum could watch Corning closely.
Financial Ratios Comparison
These vital ratios act as a diagnostic tool to expose the underlying fiscal health, valuation premiums, and capital efficiency of the companies analyzed:
| Ratios | Corning Incorporated (GLW) | Teledyne Technologies Incorporated (TDY) |
|---|---|---|
| ROE | 13.5% | 8.5% |
| ROIC | 7.4% | 6.8% |
| P/E | 47.2 | 27.3 |
| P/B | 6.38 | 2.33 |
| Current Ratio | 1.59 | 1.64 |
| Quick Ratio | 1.04 | 1.08 |
| D/E | 0.71 | 0.24 |
| Debt-to-Assets | 27.2% | 16.2% |
| Interest Coverage | 6.78 | 19.29 |
| Asset Turnover | 0.50 | 0.40 |
| Fixed Asset Turnover | 1.05 | 7.29 |
| Payout ratio | 62.6% | 0% |
| Dividend yield | 1.33% | 0% |
| Fiscal Year | 2025 | 2025 |
Efficiency & Valuation Duel: The Vital Signs
Ratios serve as a company’s financial DNA, exposing hidden risks and operational strengths that define its market standing.
Corning Incorporated
Corning posts a solid net margin of 10.21% and a ROE of 13.52%, signaling moderate profitability. However, its P/E of 47.18 and P/B of 6.38 stretch valuation, suggesting the stock trades at a premium. Dividend yield at 1.33% offers steady returns, balancing growth with shareholder income.
Teledyne Technologies Incorporated
Teledyne outperforms in net margin at 14.63%, but its ROE lags at 8.51%, indicating mixed profitability. Its P/E of 27.35 is more reasonable, and a low P/B of 2.33 implies fair valuation. The absence of dividends points to reinvestment in growth and R&D, emphasizing long-term value creation.
Premium Valuation vs. Operational Safety
Corning’s valuation appears stretched but offers shareholder dividends, while Teledyne balances favorable margins with prudent reinvestment. Investors seeking income might prefer Corning’s profile; those favoring growth and operational efficiency may lean toward Teledyne.
Which one offers the Superior Shareholder Reward?
I compare Corning Incorporated (GLW) and Teledyne Technologies Incorporated (TDY) on dividends, buybacks, and sustainability. GLW yields 1.33% with a 63% payout ratio, supported by modest free cash flow of $1.64/share. It also executes steady buybacks, balancing shareholder returns and capex. TDY pays no dividend but reinvests heavily, delivering $22.66 free cash flow per share and consistent buybacks. TDY’s margin and cash flow strength support growth-driven returns. I see TDY’s shareholder reward as superior in 2026, due to higher sustainable cash generation and capital allocation focused on expansion, outpacing GLW’s income-oriented but slower growth model.
Comparative Score Analysis: The Strategic Profile
The radar chart reveals the fundamental DNA and trade-offs of Corning Incorporated and Teledyne Technologies Incorporated, highlighting their core financial strengths and vulnerabilities:
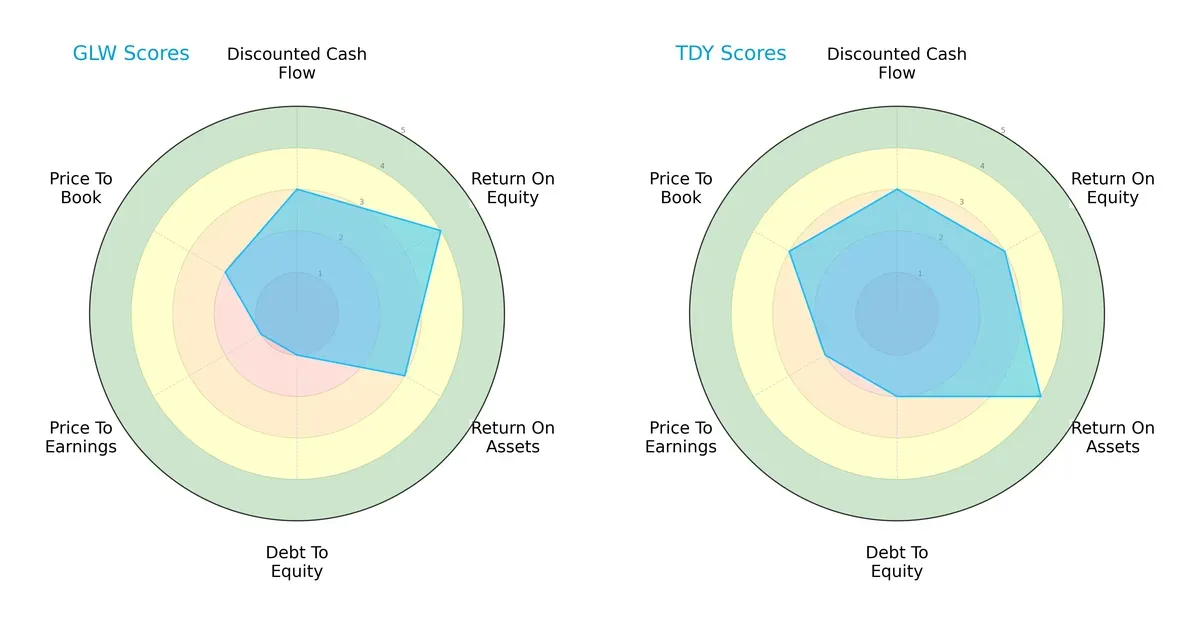
Corning boasts a higher Return on Equity (4 vs. 3) but struggles with debt and valuation scores (Debt/Equity 1 vs. 2, P/E 1 vs. 2). Teledyne offers a more balanced profile with stronger asset efficiency (ROA 4 vs. 3) and healthier valuation metrics (P/B 3 vs. 2). Corning relies heavily on equity returns but faces financial leverage risks, while Teledyne presents steadier operational metrics and moderate leverage.
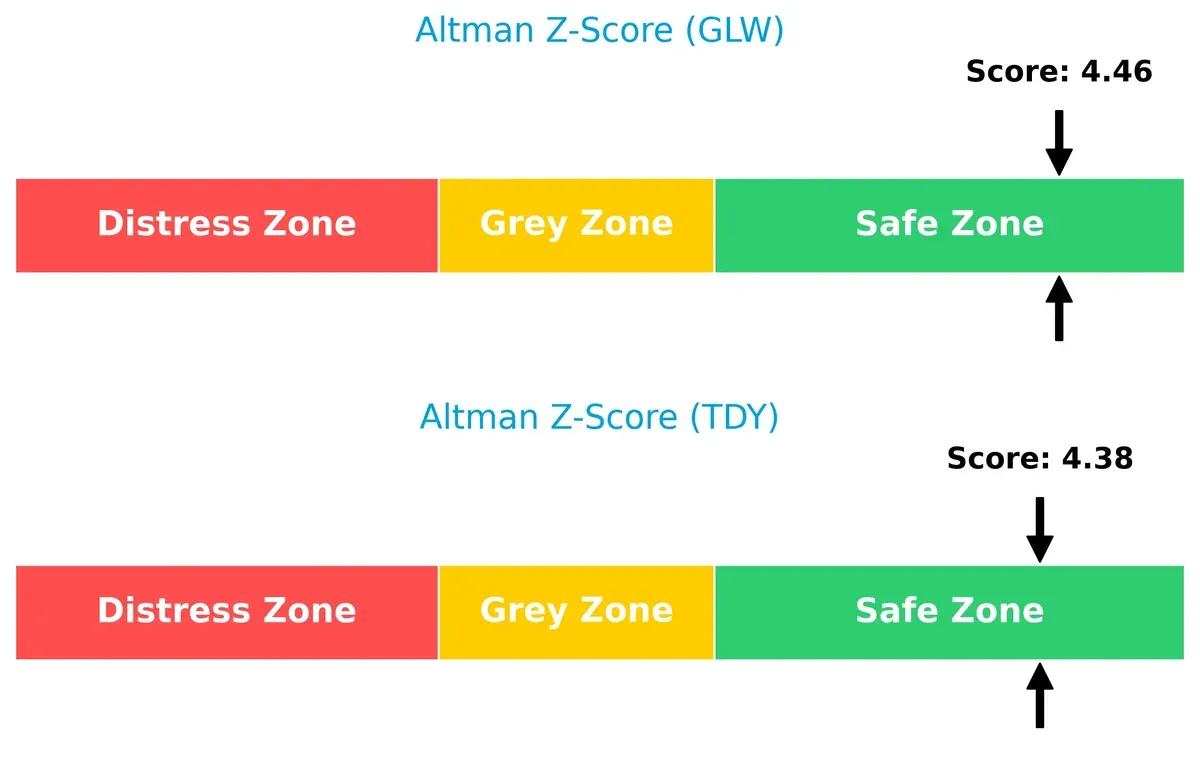
Bankruptcy Risk: Solvency Showdown
Both firms score safely above 4 in Altman Z-Score, indicating robust financial health and low bankruptcy risk in today’s volatile cycle:
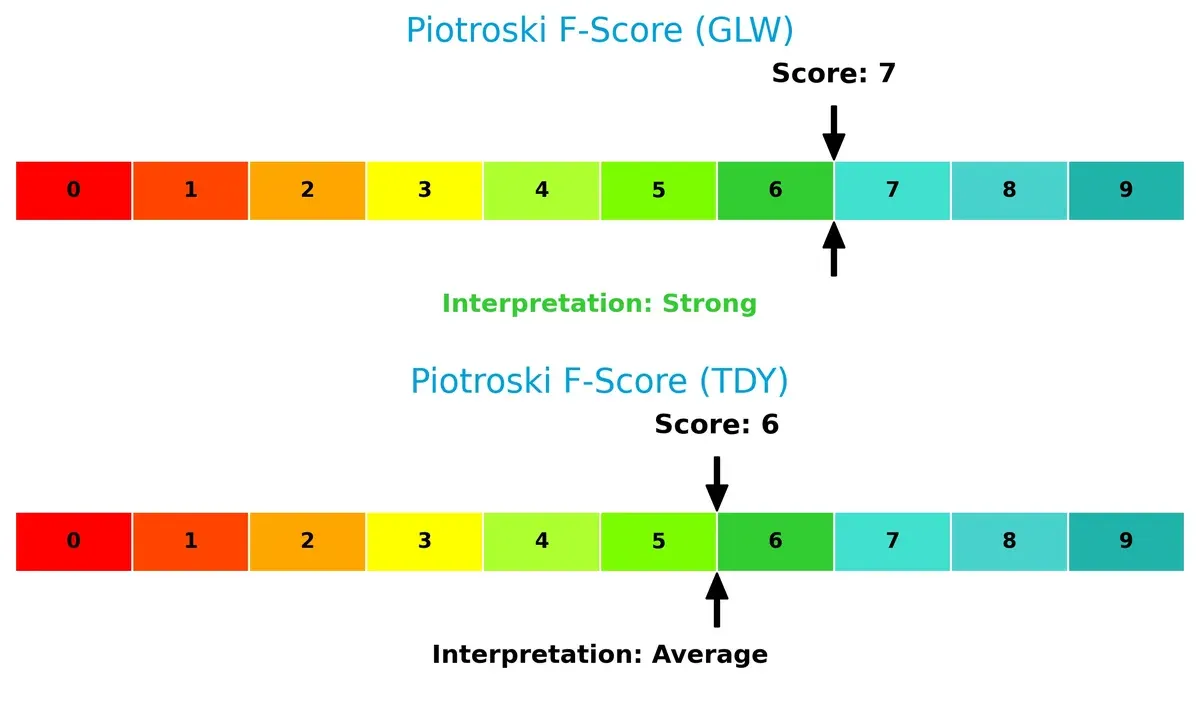
Financial Health: Quality of Operations
Corning’s Piotroski F-Score of 7 signals strong financial health, outperforming Teledyne’s score of 6, which suggests moderate internal risks:
How are the two companies positioned?
This section dissects Corning and Teledyne’s operational DNA by comparing their revenue distribution and internal dynamics. The goal is to confront their economic moats to identify which model offers a more resilient, sustainable competitive advantage today.
Revenue Segmentation: The Strategic Mix
The following visual comparison dissects how Corning Incorporated and Teledyne Technologies diversify their income streams and where their primary sector bets lie:
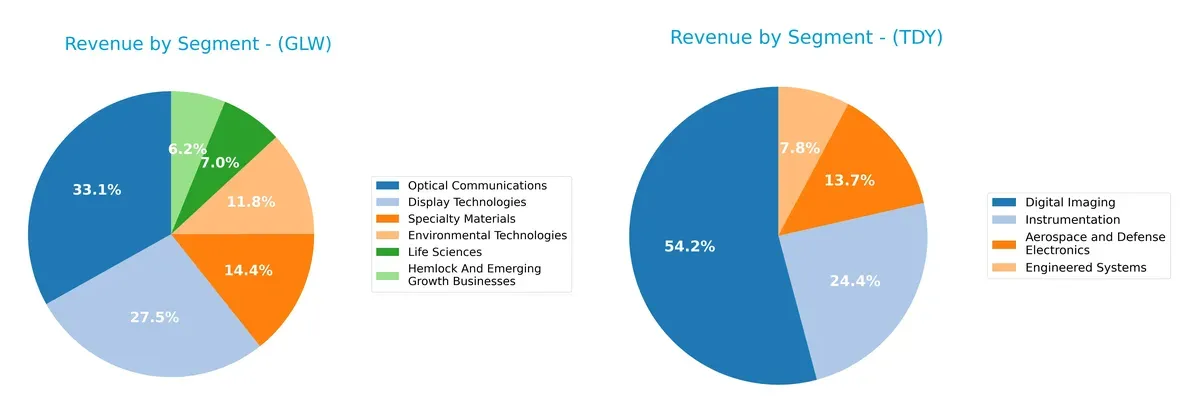
Corning’s revenue dwarfs in Optical Communications at $4.7B and Display Technologies at $3.9B, anchoring its portfolio in advanced materials. It maintains notable contributions from Specialty Materials and Environmental Technologies, showing a balanced yet tech-focused mix. Teledyne pivots on Digital Imaging with $3.1B, but its Aerospace and Defense Electronics and Instrumentation segments add meaningful diversification. Corning’s concentration risks contrast with Teledyne’s broader industrial ecosystem lock-in.
Strengths and Weaknesses Comparison
This table compares the strengths and weaknesses of Corning Incorporated and Teledyne Technologies Incorporated:
Corning Incorporated Strengths
- Diversified revenue across multiple advanced technology segments
- Favorable net margin at 10.21%
- Strong liquidity with current ratio of 1.59
- Moderate debt with favorable debt-to-assets at 27.23%
- Global presence focused on Asia Pacific and North America
Teledyne Technologies Incorporated Strengths
- Higher net margin at 14.63%
- Strong interest coverage at 19.47
- Favorable debt levels with debt-to-assets at 16.19%
- High fixed asset turnover at 7.29
- Concentrated revenue in aerospace, imaging, and instrumentation segments
Corning Incorporated Weaknesses
- Price multiples appear elevated with P/E at 47.18 and P/B at 6.38
- Neutral returns on equity and invested capital below WACC
- Asset turnover neutral at 0.5 indicating moderate efficiency
- No dividend yield advantage, only neutral at 1.33%
Teledyne Technologies Incorporated Weaknesses
- Lower return on equity at 8.51% flagged as unfavorable
- Unfavorable asset turnover at 0.4 suggests operational inefficiency
- No dividend yield offered
- P/E remains elevated at 27.35 despite lower profitability
Both companies show slightly favorable overall financial profiles but face challenges in operational efficiency and valuation metrics. Corning’s diversified portfolio and strong liquidity contrast with Teledyne’s higher profitability but operational inefficiencies. These factors shape their strategic positioning differently in competitive markets.
The Moat Duel: Analyzing Competitive Defensibility
A structural moat is the only reliable shield protecting long-term profits from relentless competition erosion. Let’s examine the moat dynamics of two tech hardware leaders:
Corning Incorporated (GLW): Intangible Asset Moat through Specialty Materials
I see Corning’s moat rooted in its advanced glass and optical materials technology. Its stable margins and 35% gross margin reflect strong pricing power. New display and life sciences applications in 2026 could deepen this advantage, but rising competition in optical fibers remains a threat.
Teledyne Technologies Incorporated (TDY): Diversified Technology Moat via Integration and Innovation
Teledyne’s moat stems from broad instrumentation and aerospace tech integration, contrasting with Corning’s material focus. Higher 39% gross margin and 19% EBIT margin demonstrate robust competitive positioning. Expanding defense and imaging markets in 2026 offer growth, although innovation pace is critical to maintain edge.
Moat Battle: Intangible Assets vs. Integrated Technology Ecosystem
Both companies show growing ROIC trends but currently shed value versus WACC, signaling caution. Teledyne’s broader technology integration and higher margins suggest a deeper moat. I view Teledyne as better positioned to defend and expand its market share amid evolving industry demands.
Which stock offers better returns?
The past year shows strong bullish trends for both Corning Incorporated and Teledyne Technologies Incorporated, with notable price appreciation and increasing trading volumes reflecting robust market interest.
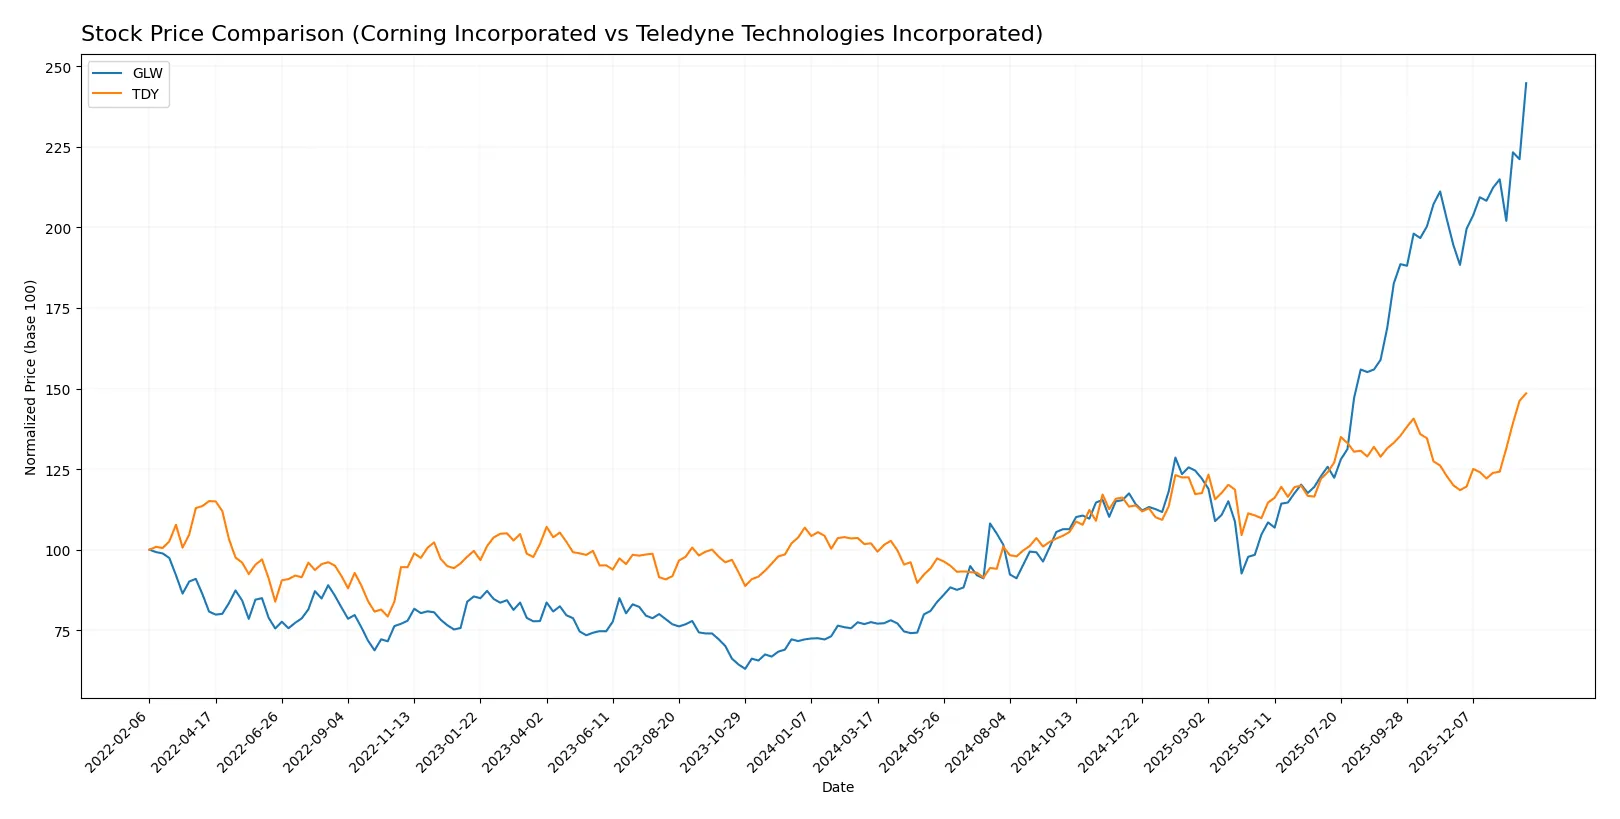
Trend Comparison
Corning Incorporated’s stock price surged 215.65% over the past 12 months, showing bullish acceleration and a high of 103.25, supported by steady buyer dominance and moderate volatility (std dev 18.43).
Teledyne Technologies Incorporated gained 45.62% over 12 months with bullish acceleration, hitting a high of 620.3. Volatility is significantly higher (std dev 58.2), though recent buyer dominance remains strong.
Corning’s trend outpaces Teledyne’s significantly in total returns over the past year, despite Teledyne’s higher volatility and recent strong upward slope.
Target Prices
Analysts show a confident target price range for Corning Incorporated and Teledyne Technologies.
| Company | Target Low | Target High | Consensus |
|---|---|---|---|
| Corning Incorporated | 100 | 130 | 116.63 |
| Teledyne Technologies Incorporated | 599 | 720 | 638.5 |
Corning’s target consensus of 116.63 suggests a 13% upside from its current 103.25 price. Teledyne’s 638.5 target consensus implies modest upside versus the current 620.3 price.

Don’t Let Luck Decide Your Entry Point
Optimize your entry points with our advanced ProRealTime indicators. You’ll get efficient buy signals with precise price targets for maximum performance. Start outperforming now!
How do institutions grade them?
Corning Incorporated Grades
The following table summarizes recent institutional grades for Corning Incorporated:
| Grading Company | Action | New Grade | Date |
|---|---|---|---|
| Morgan Stanley | Maintain | Equal Weight | 2026-01-29 |
| Mizuho | Maintain | Outperform | 2026-01-29 |
| Citigroup | Maintain | Buy | 2026-01-29 |
| Susquehanna | Maintain | Positive | 2026-01-29 |
| JP Morgan | Maintain | Overweight | 2026-01-28 |
| Citigroup | Maintain | Buy | 2026-01-12 |
| Morgan Stanley | Maintain | Equal Weight | 2025-12-17 |
| UBS | Maintain | Buy | 2025-11-21 |
| Citigroup | Maintain | Buy | 2025-10-29 |
| JP Morgan | Maintain | Overweight | 2025-10-29 |
Teledyne Technologies Incorporated Grades
Below is a summary of recent institutional grades for Teledyne Technologies Incorporated:
| Grading Company | Action | New Grade | Date |
|---|---|---|---|
| Barclays | Maintain | Equal Weight | 2026-01-22 |
| Needham | Maintain | Buy | 2026-01-22 |
| Stifel | Maintain | Buy | 2026-01-22 |
| Citigroup | Maintain | Neutral | 2026-01-13 |
| Barclays | Maintain | Equal Weight | 2026-01-12 |
| Needham | Maintain | Buy | 2025-10-23 |
| Barclays | Maintain | Equal Weight | 2025-10-23 |
| Stifel | Maintain | Buy | 2025-10-23 |
| Morgan Stanley | Maintain | Equal Weight | 2025-10-15 |
| UBS | Maintain | Buy | 2025-07-24 |
Which company has the best grades?
Corning Incorporated generally receives stronger grades, with multiple Buy and Outperform ratings. Teledyne Technologies shows solid Buy ratings but also several Equal Weight and Neutral grades. Corning’s higher-grade consistency may signal stronger institutional confidence.
Risks specific to each company
The following categories identify critical pressure points and systemic threats facing Corning Incorporated and Teledyne Technologies in the 2026 market environment:
1. Market & Competition
Corning Incorporated
- Faces intense competition in display tech and optical communications; high P/E ratio suggests market expectations are lofty.
Teledyne Technologies Incorporated
- Operates in niche industrial and aerospace tech; moderate P/E ratio reflects steadier market valuation but faces innovation pressure.
2. Capital Structure & Debt
Corning Incorporated
- Moderate leverage (D/E 0.71) with solid interest coverage (7.11x); debt-to-assets at 27.23% signals manageable risk.
Teledyne Technologies Incorporated
- Low leverage (D/E 0.24), strong interest coverage (19.47x), and low debt-to-assets (16.19%) reveal a conservative, stable capital structure.
3. Stock Volatility
Corning Incorporated
- Beta 1.125 indicates slightly higher volatility than market average, reflecting cyclical tech exposure.
Teledyne Technologies Incorporated
- Beta 1.027 signals volatility close to market average; less sensitivity to broad tech swings.
4. Regulatory & Legal
Corning Incorporated
- Exposure to environmental regulations in emissions control products; potential legal risks tied to global supply chains.
Teledyne Technologies Incorporated
- Aerospace and defense segments subject to stringent export controls and compliance requirements, increasing regulatory risk.
5. Supply Chain & Operations
Corning Incorporated
- Complex global supply chains for glass substrates and optical components; vulnerable to material shortages and logistic disruptions.
Teledyne Technologies Incorporated
- Relies on specialized components and manufacturing for aerospace and defense; operational risks from supplier concentration.
6. ESG & Climate Transition
Corning Incorporated
- Faces pressure to reduce environmental impact in manufacturing; ESG initiatives critical for reputation and compliance.
Teledyne Technologies Incorporated
- Must align defense and industrial solutions with sustainability goals; growing scrutiny on emissions and resource use.
7. Geopolitical Exposure
Corning Incorporated
- Significant global sales, including Asia; geopolitical tensions could disrupt supply chains and market access.
Teledyne Technologies Incorporated
- Defense contracts and international operations expose it to geopolitical risks and shifting government policies.
Which company shows a better risk-adjusted profile?
Teledyne’s lower leverage, stronger interest coverage, and balanced valuation offer a more resilient risk profile. Corning’s higher market expectations and more complex supply chains introduce greater vulnerability. Teledyne’s conservative capital structure and safer Altman Z-score reinforce its relative stability amid 2026 uncertainties.
Final Verdict: Which stock to choose?
Corning Incorporated’s superpower lies in its ability to combine solid margin expansion with disciplined capital allocation, driving steadily improving profitability despite a challenging macro environment. Its point of vigilance remains the relatively high valuation multiples, which could pressure returns if growth slows. It suits an aggressive growth portfolio willing to tolerate premium pricing for quality execution.
Teledyne Technologies boasts a strategic moat through its strong intangible asset base and consistent free cash flow generation, underpinned by efficient capital management and lower leverage than Corning. It offers better financial stability and a more reasonable valuation, making it attractive for investors seeking GARP—growth at a reasonable price—with a tilt toward stability.
If you prioritize aggressive growth fueled by operational momentum and margin expansion, Corning Incorporated is the compelling choice due to its accelerating profitability and market enthusiasm. However, if you seek a blend of steady growth and financial prudence with a defensible moat, Teledyne Technologies offers better stability and a more balanced risk profile. Both companies have improving ROIC trends but currently shed value relative to cost of capital, signaling cautious optimism.
Disclaimer: Investment carries a risk of loss of initial capital. The past performance is not a reliable indicator of future results. Be sure to understand risks before making an investment decision.
Go Further
I encourage you to read the complete analyses of Corning Incorporated and Teledyne Technologies Incorporated to enhance your investment decisions: