Home > Comparison > Technology > GLW vs TEL
The strategic rivalry between Corning Incorporated and TE Connectivity Ltd. shapes the trajectory of the hardware, equipment, and parts industry. Corning excels as a diversified technology leader with strengths in display and specialty materials. TE Connectivity dominates as a global connectivity and sensor solutions provider across multiple industrial sectors. This analysis will assess which company’s operational model offers superior risk-adjusted returns for a diversified portfolio in today’s evolving technology landscape.
Table of contents
Companies Overview
Corning Incorporated and TE Connectivity Ltd. both play pivotal roles in the hardware and equipment parts market, shaping global technology infrastructure.
Corning Incorporated: Pioneer in Specialty Glass and Optical Solutions
Corning dominates the display technologies and optical communications markets with glass substrates for LCDs and OLEDs in consumer electronics. It generates revenue through diverse segments, including specialty materials and environmental technologies. In 2026, Corning emphasizes innovation in ultra-thin glass and optical fiber solutions to maintain its competitive edge.
TE Connectivity Ltd.: Global Leader in Connectivity and Sensor Solutions
TE Connectivity specializes in connectivity and sensor products across transportation, industrial, and communications markets worldwide. Its revenue stems from terminals, connectors, sensors, and cables sold directly and through distributors. The company’s 2026 focus targets expanding sensor technology and connectivity solutions across automotive and industrial sectors.
Strategic Collision: Similarities & Divergences
Both firms operate in hardware and equipment but diverge strategically: Corning leans on advanced materials and optical innovation, while TE Connectivity prioritizes connectivity and sensor integration. They compete chiefly in industrial and communications infrastructure. Corning offers a materials-driven investment profile; TE Connectivity presents a diversified, solutions-oriented approach.
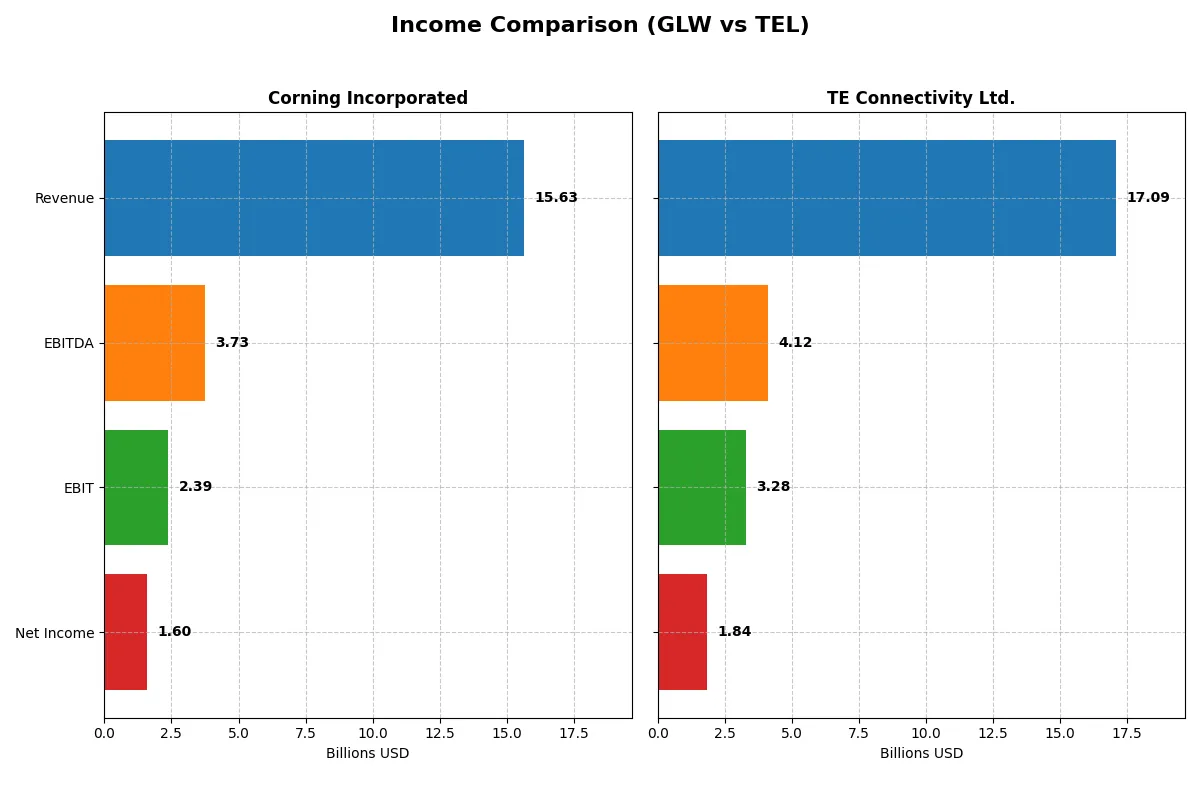
Income Statement Comparison
This data dissects the core profitability and scalability of both corporate engines to reveal who dominates the bottom line:
| Metric | Corning Incorporated (GLW) | TE Connectivity Ltd. (TEL) |
|---|---|---|
| Revenue | 15.6B | 17.1B |
| Cost of Revenue | 10.1B | 11.2B |
| Operating Expenses | 3.18B | 2.70B |
| Gross Profit | 5.51B | 5.91B |
| EBITDA | 3.74B | 4.12B |
| EBIT | 2.39B | 3.28B |
| Interest Expense | 336M | 77M |
| Net Income | 1.60B | 1.84B |
| EPS | 1.86 | 6.20 |
| Fiscal Year | 2025 | 2025 |
Income Statement Analysis: The Bottom-Line Duel
This income statement comparison reveals which company runs a more efficient and profitable corporate engine, crucial for long-term shareholder value.
Corning Incorporated Analysis
Corning’s revenue climbed steadily, reaching $15.6B in 2025, while net income surged to $1.6B. Its gross margin holds firm at 35.3%, and net margin improved to 10.2%, signaling disciplined cost control. The 2025 jump in EBIT margin to 15.3% shows strong operational leverage and growing profitability momentum.
TE Connectivity Ltd. Analysis
TE Connectivity posted $17.1B revenue in 2025, up moderately but with a more volatile net income at $1.8B. Its gross margin is close at 34.6%, but a superior EBIT margin of 19.2% highlights greater operational efficiency. However, net margin growth declined sharply, reflecting pressure on bottom-line stability despite solid revenue scale.
Margin Discipline vs. Revenue Muscle
Corning demonstrates sharper margin expansion and operational discipline with a 109% EBIT growth last year, outpacing TE’s modest 14%. While TE boasts higher revenue and EBIT margin, its net income and EPS trends raise caution. For investors, Corning’s profile offers a clearer path to sustainable profit growth, rewarding efficiency over sheer size.
Financial Ratios Comparison
These vital ratios act as a diagnostic tool to expose the underlying fiscal health, valuation premiums, and capital efficiency of the companies compared below:
| Ratios | Corning Incorporated (GLW) | TE Connectivity Ltd. (TEL) |
|---|---|---|
| ROE | 13.52% | 14.64% |
| ROIC | 7.40% | 8.82% |
| P/E | 47.18 | 34.99 |
| P/B | 6.38 | 5.12 |
| Current Ratio | 1.59 | 1.56 |
| Quick Ratio | 1.04 | 1.03 |
| D/E | 0.71 | 0.52 |
| Debt-to-Assets | 27.23% | 26.12% |
| Interest Coverage | 6.78 | 41.70 |
| Asset Turnover | 0.50 | 0.68 |
| Fixed Asset Turnover | 1.05 | 3.96 |
| Payout ratio | 62.59% | 43.59% |
| Dividend yield | 1.33% | 1.25% |
| Fiscal Year | 2025 | 2025 |
Efficiency & Valuation Duel: The Vital Signs
Ratios act as a company’s DNA, uncovering hidden risks and revealing operational excellence that raw numbers alone cannot show.
Corning Incorporated
Corning shows a solid 13.5% ROE and a favorable 10.2% net margin, indicating decent profitability. However, its P/E of 47.2 and P/B of 6.4 suggest an expensive valuation, reflecting stretched investor expectations. The company delivers a 1.33% dividend yield, balancing modest shareholder returns with reinvestment in R&D at over 7% of revenue.
TE Connectivity Ltd.
TE Connectivity posts a slightly higher 14.6% ROE and a 10.8% net margin, demonstrating efficient profit generation. Its P/E of 35.0 and P/B of 5.1 remain elevated but less stretched than Corning’s. TE offers a 1.25% dividend yield and shows strong capital efficiency, notably a 3.96 fixed asset turnover, supporting sustainable shareholder value creation.
Premium Valuation vs. Operational Safety
Both firms carry slightly favorable ratios but differ in valuation and efficiency profiles. Corning’s higher multiples imply more risk due to stretched expectations, while TE’s stronger asset turnover and lower P/E offer a more balanced risk-reward ratio. Investors seeking operational efficiency and moderate valuation may lean toward TE’s profile.
Which one offers the Superior Shareholder Reward?
Corning Incorporated (GLW) delivers a 1.33% dividend yield with a high 63% payout ratio, signaling a mature distribution approach but pressured free cash flow coverage at 1.18x. TE Connectivity Ltd. (TEL) yields 1.25% with a conservative 44% payout and robust free cash flow coverage at 2.38x, reflecting strong capital allocation discipline. Both run active buyback programs; TEL’s larger free cash flow per share ($10.78 vs. $1.64) supports more sustainable repurchases and growth reinvestment. I find TEL’s balanced dividend and aggressive buybacks more sustainable, offering superior total shareholder return in 2026.
Comparative Score Analysis: The Strategic Profile
The radar chart reveals the fundamental DNA and trade-offs of both firms, highlighting their financial strengths and vulnerabilities across key metrics:
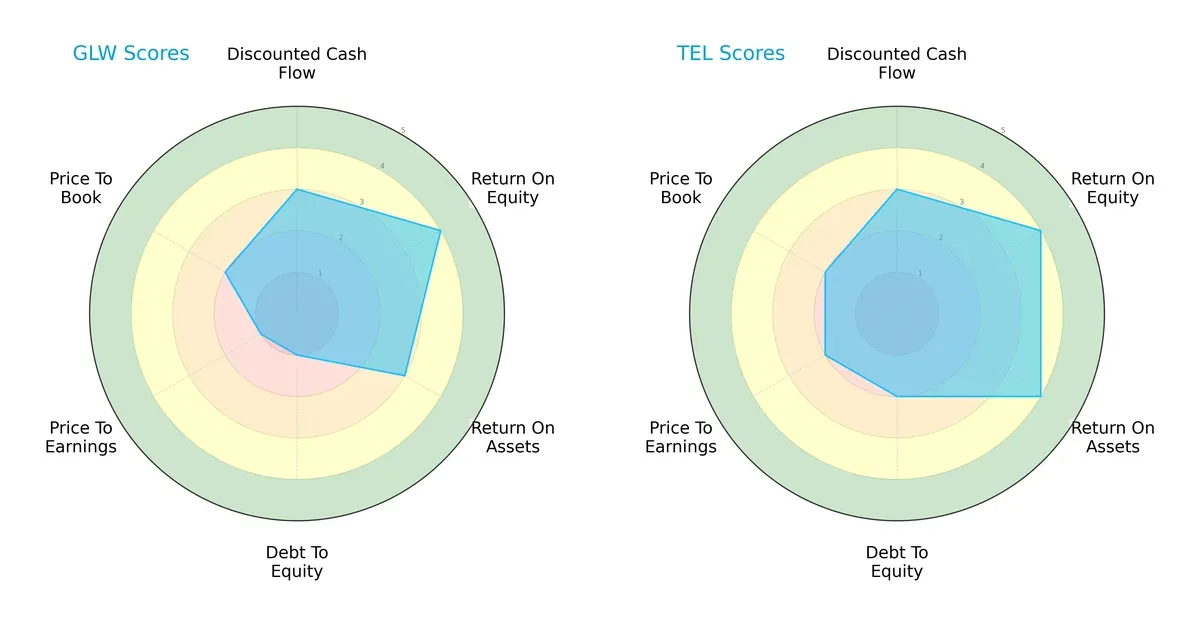
I observe that both Corning Incorporated and TE Connectivity deliver strong returns on equity (ROE scores of 4). TE Connectivity has an edge in asset efficiency with a ROA score of 4, compared to Corning’s 3. Corning struggles with leverage, evidenced by a debt-to-equity score of 1, while TE Connectivity maintains a healthier balance at 2. Valuation-wise, TE scores better on price-to-earnings (2 vs. 1) and matches Corning on price-to-book (2 each). TE Connectivity presents a more balanced financial profile, whereas Corning relies on its strong ROE but carries heavier debt and less favorable valuation metrics.
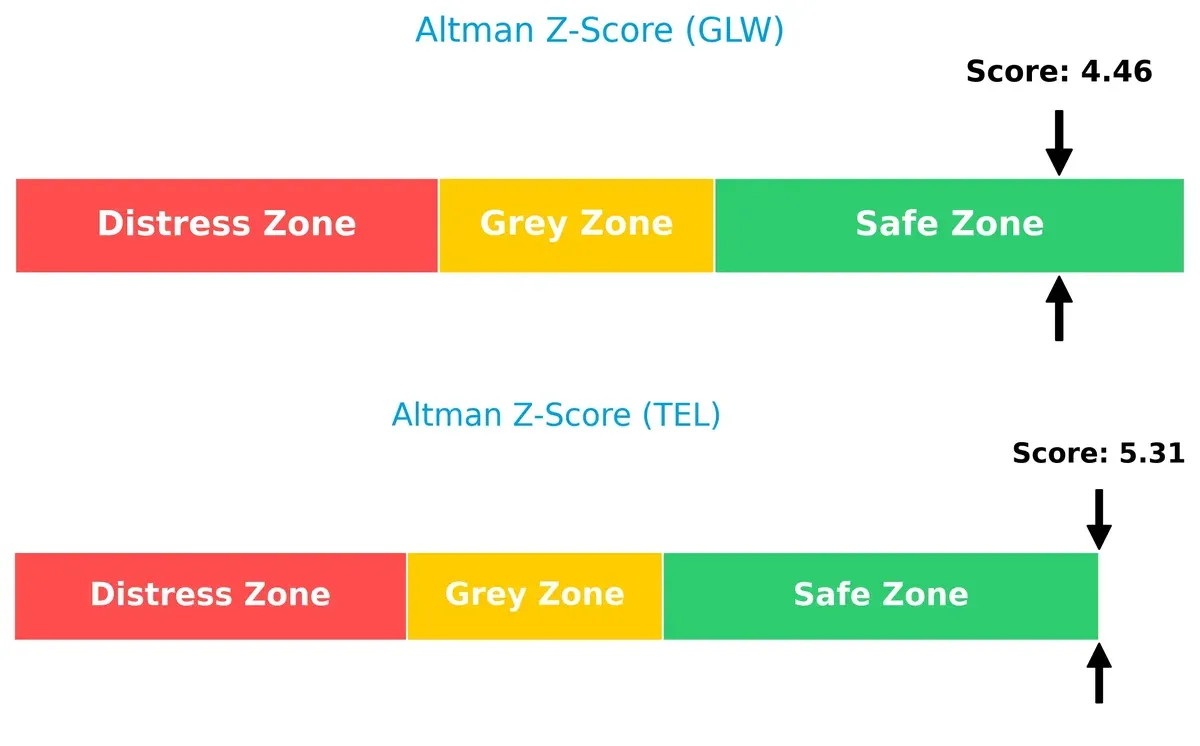
Bankruptcy Risk: Solvency Showdown
TE Connectivity’s Altman Z-Score of 5.31 surpasses Corning’s 4.46, both comfortably in the safe zone. This gap implies TE has a stronger buffer against financial distress in this cycle:
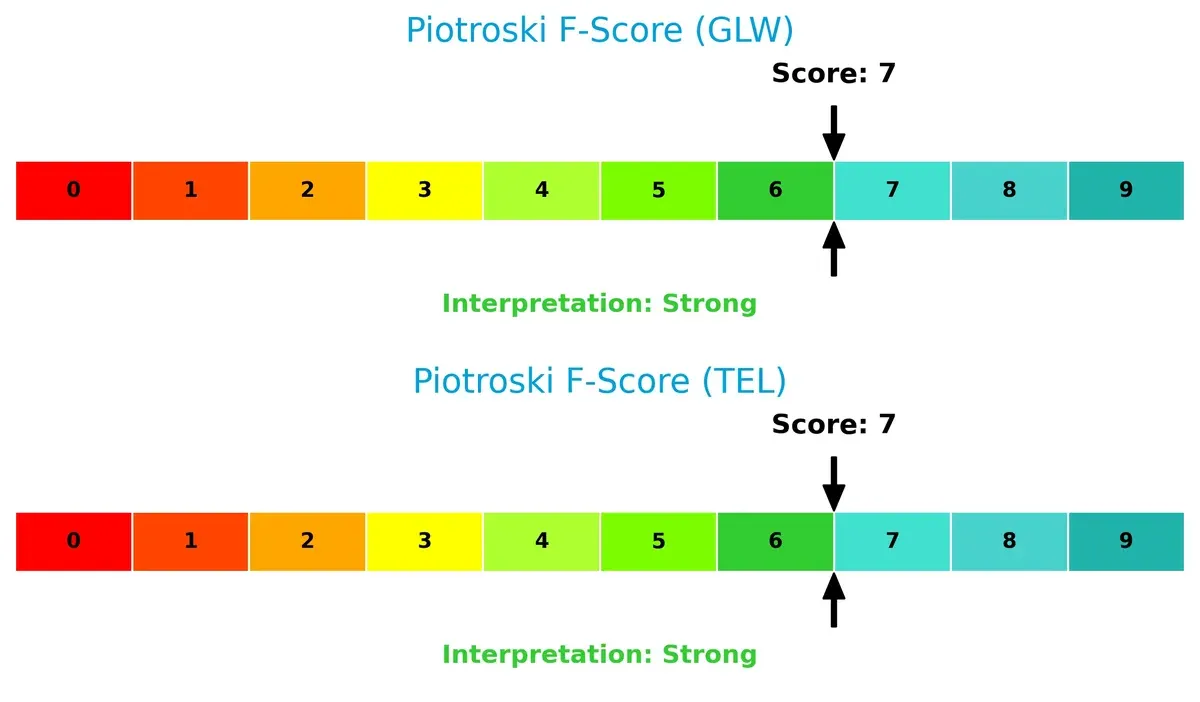
Financial Health: Quality of Operations
Both firms post a Piotroski F-Score of 7, signaling strong financial health. Neither shows acute red flags, indicating solid internal operations and prudent management practices:
How are the two companies positioned?
This section dissects Corning and TE Connectivity’s operational DNA by comparing their revenue distribution and internal dynamics. The goal is to confront their economic moats and identify which model offers the most resilient competitive advantage today.
Revenue Segmentation: The Strategic Mix
This visual comparison dissects how Corning Incorporated and TE Connectivity diversify their income streams and where their primary sector bets lie:
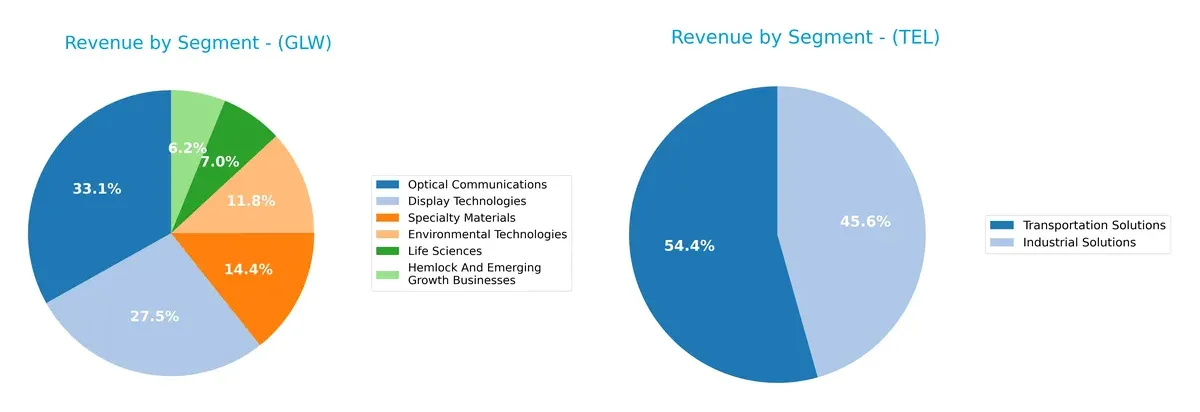
Corning shows a balanced revenue spread across Optical Communications ($4.66B), Display Technologies ($3.87B), and Specialty Materials ($2.02B). TE Connectivity relies heavily on Transportation Solutions ($9.39B) and Industrial Solutions ($7.87B), anchoring its revenue in two dominant sectors. Corning’s diversification reduces concentration risk, while TE’s focus leverages infrastructure dominance but exposes it to cyclical industry shifts.
Strengths and Weaknesses Comparison
This table compares the Strengths and Weaknesses of Corning Incorporated and TE Connectivity Ltd.:
Corning Incorporated Strengths
- Diverse revenue streams across six distinct product segments
- Strong global presence with substantial Asia Pacific and North America sales
- Favorable liquidity ratios indicating solid short-term financial health
TE Connectivity Ltd. Strengths
- Focused industrial and transportation solutions with high revenue scale
- Robust global footprint including China and U.S. markets
- Exceptional interest coverage and fixed asset turnover ratios signaling efficient capital use
Corning Incorporated Weaknesses
- High valuation multiples (PE 47.18, PB 6.38) may pressure future returns
- Neutral profitability metrics signal moderate capital efficiency
- Asset turnover remains average, limiting revenue generation from assets
TE Connectivity Ltd. Weaknesses
- Also faces elevated valuation multiples (PE 35, PB 5.12)
- Moderate return on invested capital relative to weighted average cost of capital
- Slightly lower dividend yield compared to peers
Both companies exhibit slightly favorable financial health with diversified revenues and strong global operations. However, elevated valuation multiples and only neutral capital efficiency indicate cautious monitoring of profitability and asset utilization is warranted for strategic planning.
The Moat Duel: Analyzing Competitive Defensibility
A structural moat protects long-term profits from relentless competition erosion. Without it, market share and pricing power rapidly vanish:
Corning Incorporated: Intangible Assets Anchor
Corning’s moat stems from specialized glass technologies and patents. This yields stable margins and rising ROIC despite fierce industry competition. Expansion in life sciences and environmental tech should deepen this moat in 2026.
TE Connectivity Ltd.: Cost Advantage with Diversified Reach
TE leverages scale and operational efficiency across global markets, driving superior EBIT margins. Unlike Corning’s asset-heavy moat, TE’s cost advantage faces pressure from declining ROIC trends but may benefit from new industrial and communication solutions.
Moat Strength: Innovation Intangibles vs. Efficiency Scale
Corning’s growing ROIC signals a deeper moat than TE’s shrinking returns. Corning’s intangible assets better defend market share against commoditization. I see Corning as more resilient to competitive threats in 2026.
Which stock offers better returns?
The past year revealed strong price gains for Corning Incorporated and TE Connectivity Ltd., with contrasting momentum and trading dynamics shaping their trajectories.
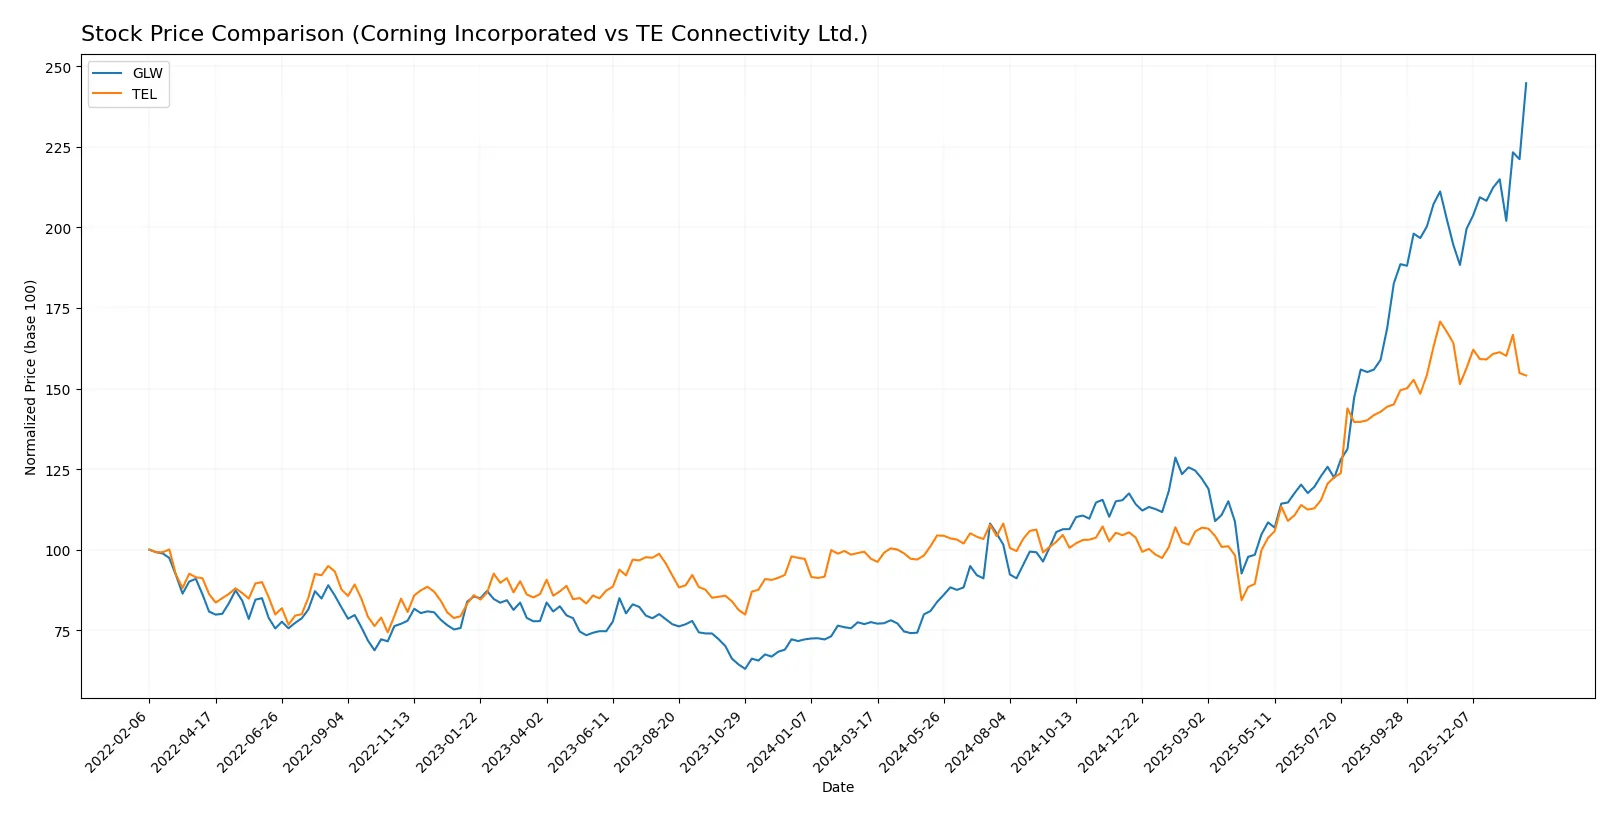
Trend Comparison
Corning Incorporated’s stock surged 215.65% over the past 12 months, showing a bullish trend with accelerating momentum and a high price range between 31.27 and 103.25. Recent months continued positive movement with a 25.82% gain.
TE Connectivity Ltd. rose 58.53% over the same period, marking a bullish yet decelerating trend. The stock fluctuated between 122.0 and 247.01, but recent weeks saw a slight bearish reversal with a -6.13% decline.
Corning’s stock outperformed TE Connectivity substantially over the year, delivering stronger gains and accelerating growth, while TE showed slower progress and recent weakening.
Target Prices
Analysts present a bullish target consensus for both Corning Incorporated and TE Connectivity Ltd.
| Company | Target Low | Target High | Consensus |
|---|---|---|---|
| Corning Incorporated | 100 | 130 | 116.63 |
| TE Connectivity Ltd. | 238 | 306 | 270.29 |
The target consensus for Corning exceeds its current price of 103.25, implying upside potential. TE Connectivity’s consensus target of 270.29 is significantly above its current 222.78, signaling strong analyst confidence.

Don’t Let Luck Decide Your Entry Point
Optimize your entry points with our advanced ProRealTime indicators. You’ll get efficient buy signals with precise price targets for maximum performance. Start outperforming now!
How do institutions grade them?
Corning Incorporated Grades
This table summarizes recent grades and actions from top grading companies for Corning Incorporated.
| Grading Company | Action | New Grade | Date |
|---|---|---|---|
| Morgan Stanley | Maintain | Equal Weight | 2026-01-29 |
| Mizuho | Maintain | Outperform | 2026-01-29 |
| Citigroup | Maintain | Buy | 2026-01-29 |
| Susquehanna | Maintain | Positive | 2026-01-29 |
| JP Morgan | Maintain | Overweight | 2026-01-28 |
| Citigroup | Maintain | Buy | 2026-01-12 |
| Morgan Stanley | Maintain | Equal Weight | 2025-12-17 |
| UBS | Maintain | Buy | 2025-11-21 |
| Citigroup | Maintain | Buy | 2025-10-29 |
| JP Morgan | Maintain | Overweight | 2025-10-29 |
TE Connectivity Ltd. Grades
This table outlines recent grades and actions from established grading companies for TE Connectivity Ltd.
| Grading Company | Action | New Grade | Date |
|---|---|---|---|
| Oppenheimer | Upgrade | Outperform | 2026-01-27 |
| Barclays | Maintain | Overweight | 2026-01-23 |
| Truist Securities | Maintain | Hold | 2026-01-22 |
| Wells Fargo | Maintain | Equal Weight | 2026-01-22 |
| UBS | Maintain | Buy | 2026-01-14 |
| Truist Securities | Maintain | Hold | 2025-12-19 |
| Wells Fargo | Maintain | Equal Weight | 2025-12-09 |
| Truist Securities | Maintain | Hold | 2025-11-21 |
| Barclays | Maintain | Overweight | 2025-11-21 |
| TD Cowen | Maintain | Buy | 2025-11-17 |
Which company has the best grades?
Corning Incorporated generally holds stronger buy and outperform ratings from multiple top-tier firms. TE Connectivity Ltd. has a broader mix of hold and equal weight ratings despite some upgrades. This divergence may influence investor confidence and portfolio positioning.
Risks specific to each company
The following categories identify the critical pressure points and systemic threats facing both firms in the 2026 market environment:
1. Market & Competition
Corning Incorporated
- Faces intense competition in display technologies and optical communications sectors, pressuring margins.
TE Connectivity Ltd.
- Competes globally in connectivity and sensor markets, with diverse industrial exposure but strong market presence.
2. Capital Structure & Debt
Corning Incorporated
- Moderate leverage with debt-to-assets at 27.23%, interest coverage ratio of 7.11 indicates manageable debt.
TE Connectivity Ltd.
- Lower leverage with debt-to-assets at 26.12%, exceptional interest coverage ratio of 42.61 signals strong debt servicing ability.
3. Stock Volatility
Corning Incorporated
- Beta of 1.125 suggests slightly above-market volatility; range shows notable price fluctuation.
TE Connectivity Ltd.
- Higher beta at 1.242 indicates greater stock price sensitivity to market swings; range is wider.
4. Regulatory & Legal
Corning Incorporated
- Subject to environmental regulations impacting its emissions control segment; compliance costs remain a concern.
TE Connectivity Ltd.
- Operates across multiple regions with complex regulatory requirements, including aerospace and medical sectors, increasing compliance risk.
5. Supply Chain & Operations
Corning Incorporated
- Global supply chain exposed to semiconductor and display component shortages, affecting production timelines.
TE Connectivity Ltd.
- Diverse supplier base mitigates risk but exposure to global logistics disruptions affects industrial and transportation segments.
6. ESG & Climate Transition
Corning Incorporated
- Faces pressure to innovate greener materials and reduce emissions in environmental technologies segment.
TE Connectivity Ltd.
- Strong focus on sustainable product lines but must navigate evolving ESG standards across international markets.
7. Geopolitical Exposure
Corning Incorporated
- Primarily US-based, with global sales; trade tensions may impact supply chain and export markets.
TE Connectivity Ltd.
- Swiss-headquartered with extensive global footprint, including emerging markets, increasing geopolitical risk complexity.
Which company shows a better risk-adjusted profile?
TE Connectivity’s superior debt servicing capacity and diversified geographic exposure offer a stronger risk-adjusted profile. Corning’s higher stock volatility and regulatory pressures in emissions control present notable risks. The standout concern for Corning lies in its debt metrics, while TE’s challenge is navigating geopolitical complexities. Recent data shows TE’s interest coverage ratio at 42.61, vastly outperforming Corning’s 7.11, underscoring TE’s financial resilience amid market uncertainties.
Final Verdict: Which stock to choose?
Corning Incorporated’s superpower lies in its improving profitability and strong cash generation despite modest value destruction. Its balance sheet shows resilience, but the elevated valuation multiples remain a point of vigilance. It suits investors aiming for aggressive growth with a tolerance for premium pricing and cyclical swings.
TE Connectivity commands a strategic moat through its operational efficiency and robust asset turnover, underpinning steady cash flow and superior interest coverage. Compared to Corning, it offers better financial stability but slower recent growth. It fits well in a GARP portfolio, balancing growth potential with reasonable risk.
If you prioritize rapid earnings expansion and can absorb valuation premiums, Corning outshines with accelerating momentum. However, if you seek better stability and efficiency amid market uncertainty, TE Connectivity offers superior risk management and consistent returns. Each presents a distinct analytical scenario tailored to different investor profiles.
Disclaimer: Investment carries a risk of loss of initial capital. The past performance is not a reliable indicator of future results. Be sure to understand risks before making an investment decision.
Go Further
I encourage you to read the complete analyses of Corning Incorporated and TE Connectivity Ltd. to enhance your investment decisions: