Home > Comparison > Technology > GLW vs SANM
The strategic rivalry between Corning Incorporated and Sanmina Corporation shapes the Technology sector’s hardware landscape. Corning, a diversified innovator in specialty materials and optical communications, contrasts with Sanmina’s integrated manufacturing solutions and supply chain expertise. This head-to-head highlights a battle between broad industrial innovation and focused manufacturing efficiency. This analysis aims to identify which company’s trajectory offers superior risk-adjusted returns for a diversified portfolio in today’s evolving tech environment.
Table of contents
Companies Overview
Corning Incorporated and Sanmina Corporation represent key players in the Hardware, Equipment & Parts sector, each shaping critical technology supply chains.
Corning Incorporated: Innovator in Glass and Optical Solutions
Corning Incorporated dominates as a technology materials leader specializing in glass substrates for displays and optical fibers. Its revenue stems from diversified segments including Display Technologies and Optical Communications. In 2026, Corning’s strategic focus centers on advancing specialty materials and life sciences products to sustain its technological edge and global market presence.
Sanmina Corporation: Integrated Manufacturing Powerhouse
Sanmina Corporation excels as a provider of end-to-end manufacturing solutions offering design, assembly, and logistics services. Its core revenue relies on integrated manufacturing and component production for industries like aerospace and communications. The firm prioritizes expanding its cloud-based manufacturing execution software and supply chain services to enhance operational efficiency and customer value.
Strategic Collision: Similarities & Divergences
Both companies operate within technology hardware but diverge in approach: Corning emphasizes proprietary material innovation, while Sanmina focuses on manufacturing scalability and services. Their battle for market share unfolds in high-tech industrial and communications sectors. Corning’s investment profile reflects deep R&D moats; Sanmina appeals to investors favoring integrated production and service diversification.
Income Statement Comparison
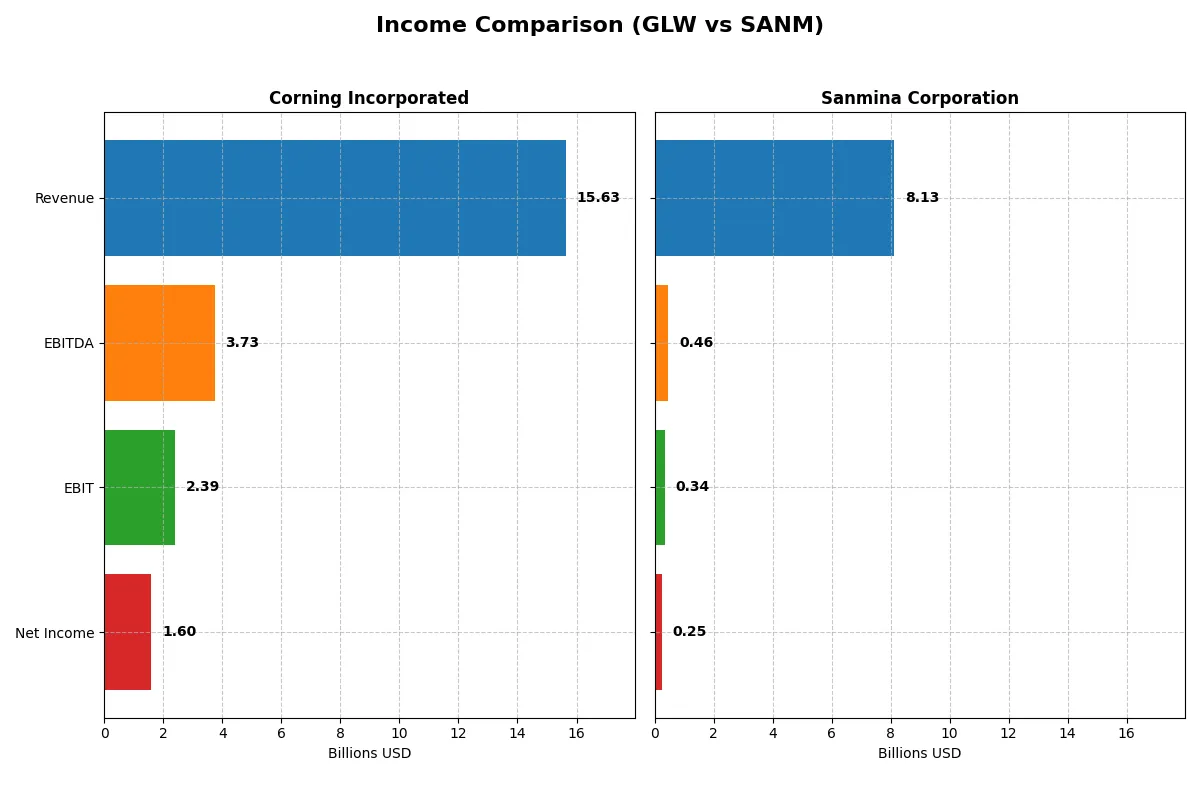
This data dissects the core profitability and scalability of both corporate engines to reveal who dominates the bottom line:
| Metric | Corning Incorporated (GLW) | Sanmina Corporation (SANM) |
|---|---|---|
| Revenue | 15.6B | 8.13B |
| Cost of Revenue | 10.1B | 7.41B |
| Operating Expenses | 3.18B | 362M |
| Gross Profit | 5.51B | 716M |
| EBITDA | 3.74B | 463M |
| EBIT | 2.39B | 344M |
| Interest Expense | 336M | 4.30M |
| Net Income | 1.60B | 246M |
| EPS | 1.86 | 4.56 |
| Fiscal Year | 2025 | 2025 |
Income Statement Analysis: The Bottom-Line Duel
This income statement comparison reveals which company runs the most efficient and profitable corporate engine in 2025.
Corning Incorporated Analysis
Corning’s revenue surged 19% to $15.6B in 2025, driving gross profit to $5.5B with a strong 35.3% gross margin. Net income jumped sharply by 215% to $1.6B, lifting net margin to a healthy 10.2%. The company’s EBIT more than doubled, signaling robust operational momentum and efficient cost control.
Sanmina Corporation Analysis
Sanmina posted $8.1B revenue in 2025, up 7.4% year-on-year, with a gross profit of $716M and a modest 8.8% gross margin. Net income grew 14% to $246M, maintaining a slim 3.0% net margin. EBIT declined slightly, reflecting some operational pressures despite favorable EPS growth and very low interest expenses.
Margin Strength vs. Moderate Growth
Corning dominates with superior revenue scale and margin expansion, delivering double-digit net margin and rapid EBIT growth. Sanmina’s revenue growth is steady but accompanied by thin margins and flat EBIT. For investors prioritizing profitability and operational leverage, Corning’s profile offers a clearer path to value creation.
Financial Ratios Comparison
These vital ratios act as a diagnostic tool to expose the underlying fiscal health, valuation premiums, and capital efficiency of the companies compared below:
| Ratios | Corning Incorporated (GLW) | Sanmina Corporation (SANM) |
|---|---|---|
| ROE | 13.5% | 10.4% |
| ROIC | 7.4% | 9.0% |
| P/E | 47.2 | 25.6 |
| P/B | 6.38 | 2.67 |
| Current Ratio | 1.59 | 1.72 |
| Quick Ratio | 1.04 | 1.02 |
| D/E | 0.71 | 0.17 |
| Debt-to-Assets | 27.2% | 6.7% |
| Interest Coverage | 6.78 | 82.53 |
| Asset Turnover | 0.50 | 1.39 |
| Fixed Asset Turnover | 1.05 | 11.91 |
| Payout Ratio | 62.6% | 0% |
| Dividend Yield | 1.33% | 0% |
| Fiscal Year | 2025 | 2025 |
Efficiency & Valuation Duel: The Vital Signs
Financial ratios serve as a company’s DNA, exposing hidden risks and operational strengths crucial for investment decisions.
Corning Incorporated
Corning shows solid profitability with a 13.5% ROE and a favorable 10.2% net margin, signaling operational competence. However, its valuation appears stretched, with a high P/E of 47.2 and P/B of 6.4. The company returns value via a modest 1.3% dividend yield, balancing shareholder payout with R&D investment.
Sanmina Corporation
Sanmina delivers a moderate 10.5% ROE but weaker profitability at a 3.0% net margin. Its valuation is more reasonable, with a P/E of 25.6 and a neutral P/B of 2.7, reflecting market caution. The firm offers no dividend, channeling capital into growth and maintaining a strong balance sheet with low debt.
Premium Valuation vs. Operational Efficiency
Corning commands a premium valuation backed by stronger profitability but carries valuation risk. Sanmina offers a better balance of operational efficiency and financial prudence with lower valuation multiples. Investors seeking growth with less valuation stretch may prefer Sanmina’s profile, while those tolerating premium pricing for higher margins may lean toward Corning.
Which one offers the Superior Shareholder Reward?
I observe Corning Incorporated (GLW) delivers a balanced mix of dividends and buybacks, yielding 1.33% with a 63% payout ratio, well covered by free cash flow (FCF/OpCF ratio 0.52). Their buyback intensity remains moderate. Sanmina Corporation (SANM) pays no dividends, reinvesting heavily in growth and acquisitions, reflected in a robust free cash flow per share of $8.58 and a healthier capital expenditure coverage ratio of 4.21. SANM’s aggressive buybacks and reinvestment fuel higher asset turnover (1.39 vs. GLW’s 0.50), signaling faster growth potential. However, GLW’s sustainable dividend combined with consistent buybacks offers steadier long-term value. For 2026, I favor GLW for superior total shareholder return through reliable income and capital return discipline.
Comparative Score Analysis: The Strategic Profile
The radar chart reveals the fundamental DNA and trade-offs of Corning Incorporated and Sanmina Corporation, highlighting their core financial strengths and weaknesses:
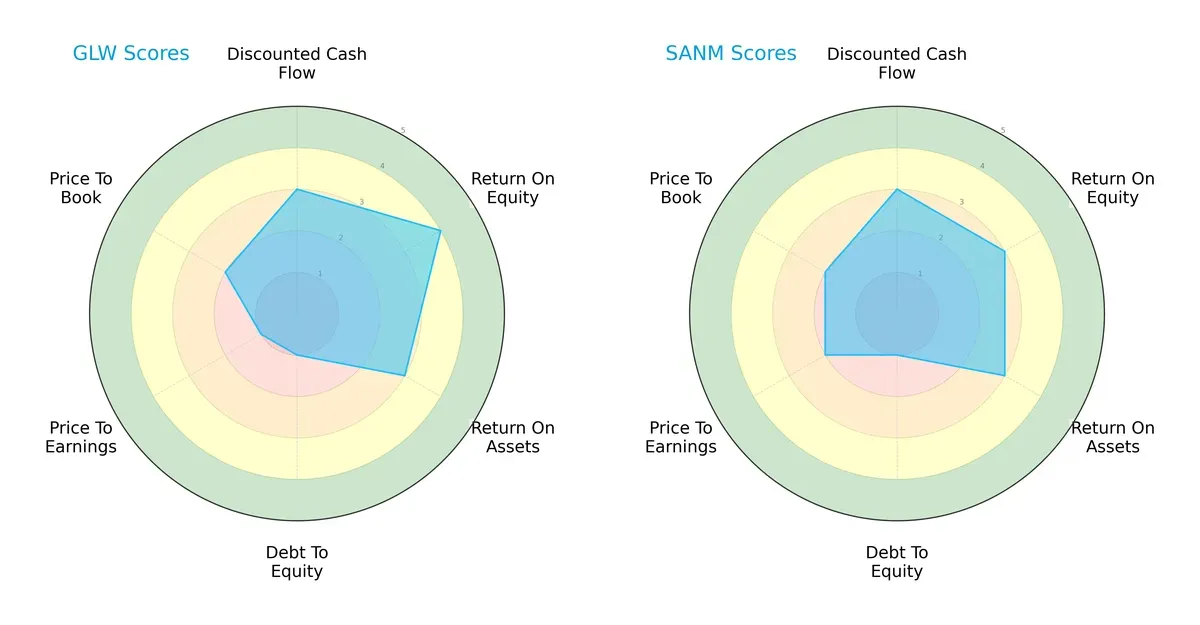
Corning shows a stronger return on equity (ROE 4 vs. 3) and slightly better asset efficiency (ROA 3 vs. 3). Both firms struggle with debt, scoring very low on debt-to-equity (1 each). Corning’s valuation metrics lag behind Sanmina’s, with weaker P/E (1 vs. 2) and similar P/B (2 each). Overall, Corning relies more on profitability, while Sanmina exhibits a more balanced valuation profile but with average operational returns.
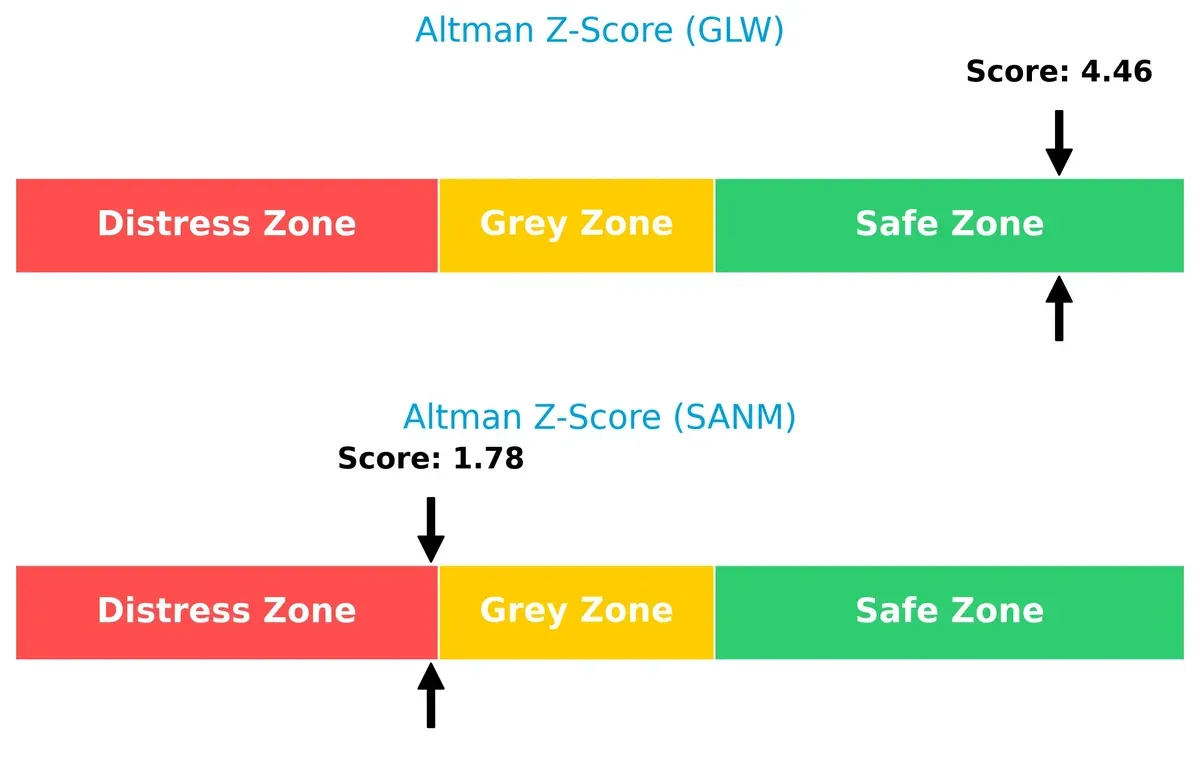
Bankruptcy Risk: Solvency Showdown
Corning’s Altman Z-Score of 4.46 places it firmly in the safe zone, signaling strong long-term survival prospects. Sanmina’s 1.78 score falls into the distress zone, implying elevated bankruptcy risk in this cycle:
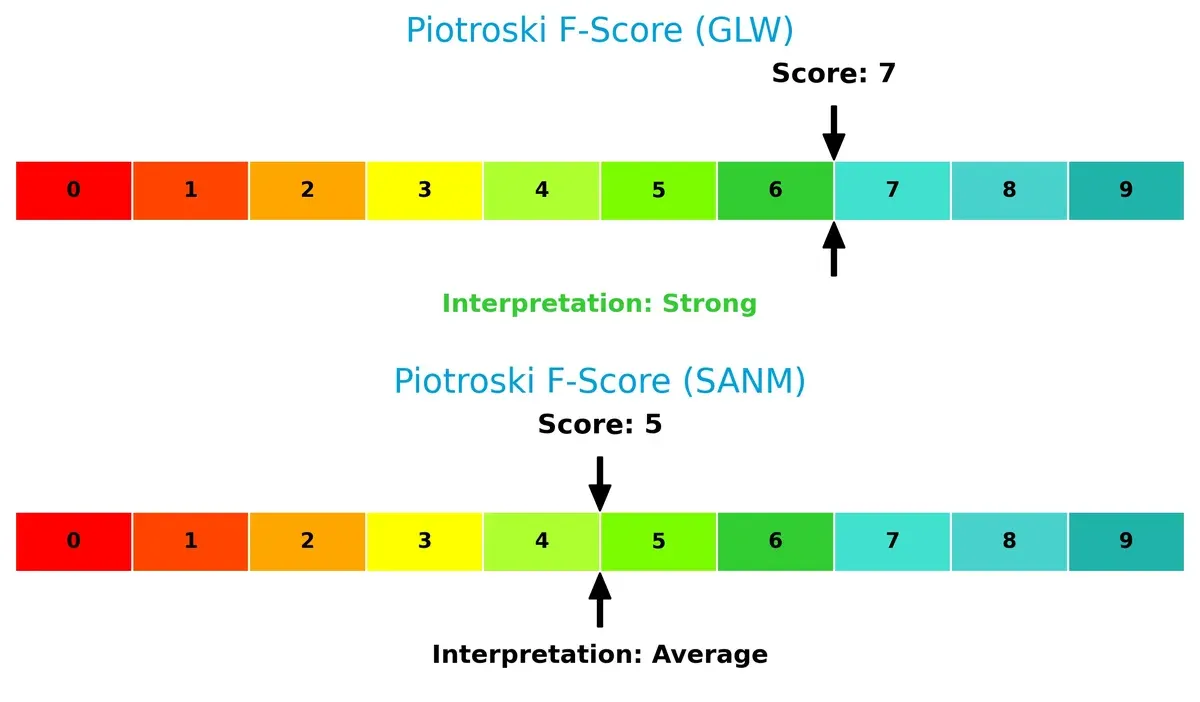
Financial Health: Quality of Operations
Corning’s Piotroski F-Score of 7 indicates strong financial health with robust internal metrics. Sanmina’s score of 5 reflects average financial strength and potential red flags in operational efficiency or leverage:
How are the two companies positioned?
This section dissects the operational DNA of Corning and Sanmina by comparing their revenue distribution and internal dynamics. The goal is to confront their economic moats and identify which model offers the most resilient competitive advantage.
Revenue Segmentation: The Strategic Mix
This comparison dissects how Corning Incorporated and Sanmina Corporation diversify their income streams and reveals where their primary sector bets lie:
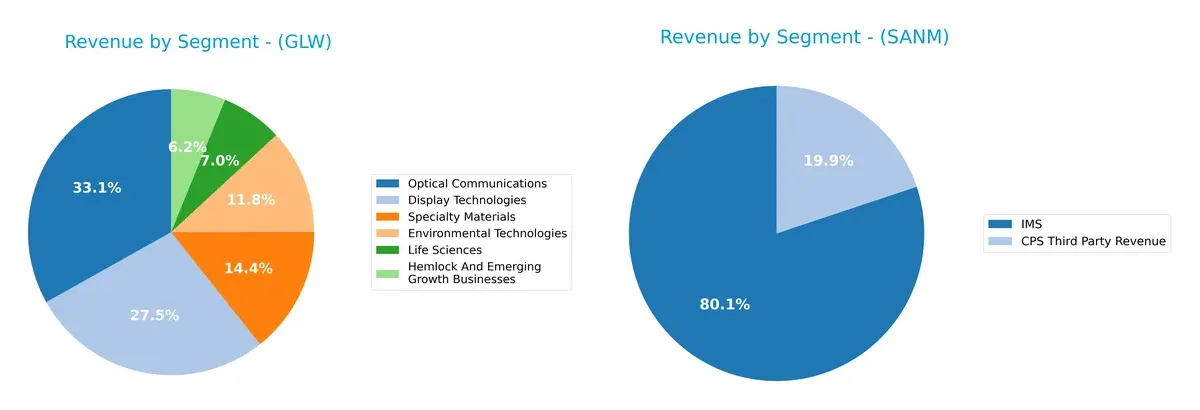
Corning anchors its revenue in Optical Communications ($4.66B) and Display Technologies ($3.87B), supported by Specialty Materials ($2.02B) and Environmental Technologies ($1.67B). This diversified portfolio reduces concentration risk and leverages multiple industry ecosystems. Sanmina, however, pivots heavily on IMS ($6.51B), with CPS Third Party Revenue ($1.62B) trailing far behind, signaling a dependence on its core manufacturing services. Corning’s broader mix suggests stronger resilience versus Sanmina’s single-segment concentration risk.
Strengths and Weaknesses Comparison
This table compares the strengths and weaknesses of Corning Incorporated and Sanmina Corporation:
Corning Incorporated Strengths
- Diversified revenue streams across six product segments
- Favorable net margin at 10.21%
- Strong current and quick ratios above 1.0
- Moderate debt-to-assets ratio at 27.23%
- Broad geographic presence with high Asia Pacific sales
Sanmina Corporation Strengths
- Favorable asset and fixed asset turnover indicating operational efficiency
- Very strong interest coverage ratio at 80.01
- Low debt-to-equity and debt-to-assets ratios
- Favorable current and quick ratios above 1.0
- Balanced geographic revenue with strong Americas presence
Corning Incorporated Weaknesses
- High P/E ratio of 47.18 signals overvaluation risk
- Unfavorable P/B ratio at 6.38
- Neutral ROIC below WACC may limit value creation
- Moderate debt level with neutral D/E ratio
- Dividend yield modest at 1.33%
Sanmina Corporation Weaknesses
- Low net margin at 3.03% reflects profitability challenges
- Unfavorable zero dividend yield
- P/E ratio at 25.59 still elevated
- Higher unfavorable ratio percentage than Corning
- Less diversified product segmentation with two main segments
Both companies show slightly favorable overall financial profiles but differ in operational focus. Corning leverages diversified products and moderate profitability, while Sanmina excels in operational efficiency and low leverage but struggles with margin and dividend returns. These contrasts suggest distinct strategic priorities in growth versus capital structure.
The Moat Duel: Analyzing Competitive Defensibility
A structural moat is the only reliable shield preserving long-term profits against relentless competition erosion. Let’s dissect two contenders’ moats:
Corning Incorporated: Innovation-Driven Intangible Asset Moat
Corning leverages proprietary glass and optical technologies, reflected in stable 15% EBIT margins and strong 35% gross margins. Its expanding product lines in specialty materials hint at deeper moats ahead in 2026.
Sanmina Corporation: Cost Advantage and Integrated Solutions Moat
Sanmina’s moat centers on cost-efficient manufacturing and comprehensive supply chain services, yielding modest 4% EBIT margins versus Corning. Its integrated model supports steady revenue growth but faces margin pressure amid industry shifts.
Verdict: Innovation Moat vs. Cost Leadership Resilience
Corning’s intangible asset moat is wider and more defensible, supported by superior margins and innovation pipeline. Sanmina’s cost advantage is narrower, vulnerable to commoditization. Corning stands better poised to defend and expand market share in 2026.
Which stock offers better returns?
Over the past year, Corning Incorporated’s stock surged sharply, showing accelerating gains, while Sanmina Corporation’s price rose significantly but slowed with recent declines.
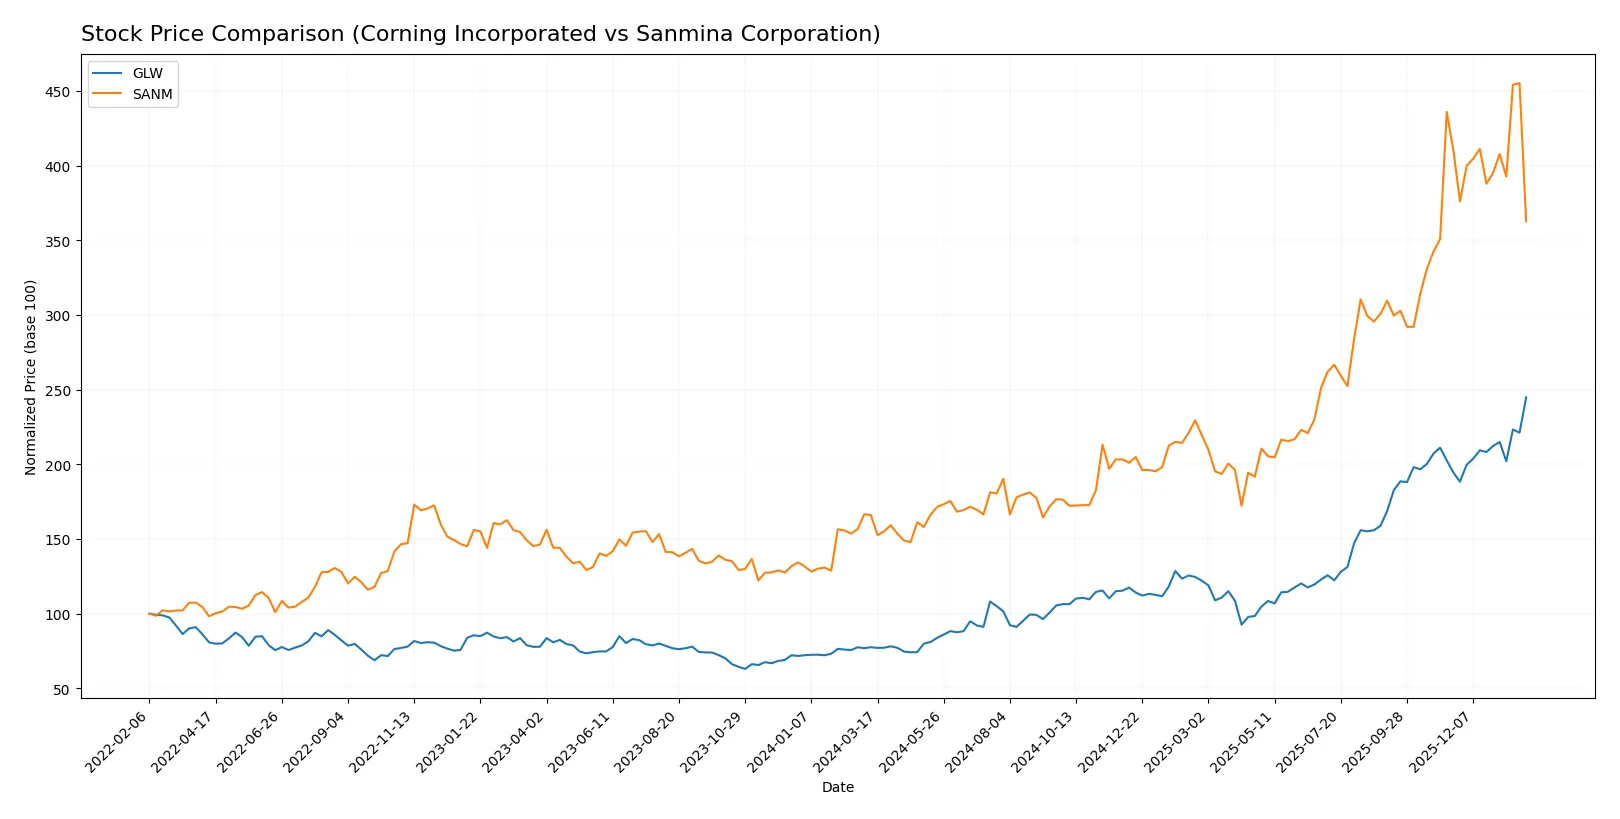
Trend Comparison
Corning Incorporated’s stock price rose 215.65% over the last 12 months, displaying a bullish trend with accelerating momentum and a high of 103.25 and low of 31.27.
Sanmina Corporation gained 118.44% over the year, also bullish but with decelerating momentum and a recent 11.65% decline, hitting a high of 177.83 and low of 57.79.
Corning outperformed Sanmina with stronger gains and accelerating price momentum, delivering the highest market return in this period.
Target Prices
Analysts present a bullish consensus on Corning Incorporated and Sanmina Corporation with strong upside potential.
| Company | Target Low | Target High | Consensus |
|---|---|---|---|
| Corning Incorporated | 100 | 130 | 116.63 |
| Sanmina Corporation | 200 | 200 | 200 |
Corning’s consensus target of 116.63 implies a 13% upside versus the current 103.25 price. Sanmina’s 200 target is 41% above its 141.68 price, signaling robust analyst confidence.

Don’t Let Luck Decide Your Entry Point
Optimize your entry points with our advanced ProRealTime indicators. You’ll get efficient buy signals with precise price targets for maximum performance. Start outperforming now!
How do institutions grade them?
The grades from reputable institutions for Corning Incorporated and Sanmina Corporation are as follows:
Corning Incorporated Grades
The following table summarizes recent grades from major financial institutions for Corning Incorporated:
| Grading Company | Action | New Grade | Date |
|---|---|---|---|
| Morgan Stanley | maintain | Equal Weight | 2026-01-29 |
| Mizuho | maintain | Outperform | 2026-01-29 |
| Citigroup | maintain | Buy | 2026-01-29 |
| Susquehanna | maintain | Positive | 2026-01-29 |
| JP Morgan | maintain | Overweight | 2026-01-28 |
| Citigroup | maintain | Buy | 2026-01-12 |
| Morgan Stanley | maintain | Equal Weight | 2025-12-17 |
| UBS | maintain | Buy | 2025-11-21 |
| Citigroup | maintain | Buy | 2025-10-29 |
| JP Morgan | maintain | Overweight | 2025-10-29 |
Sanmina Corporation Grades
The following table summarizes recent grades from major financial institutions for Sanmina Corporation:
| Grading Company | Action | New Grade | Date |
|---|---|---|---|
| Argus Research | maintain | Buy | 2026-01-28 |
| B of A Securities | maintain | Neutral | 2025-07-11 |
| B of A Securities | maintain | Neutral | 2025-06-09 |
| B of A Securities | upgrade | Neutral | 2025-01-29 |
| Craig-Hallum | maintain | Hold | 2024-11-05 |
| Craig-Hallum | downgrade | Hold | 2024-04-30 |
| Sidoti & Co. | upgrade | Buy | 2022-11-08 |
| Sidoti & Co. | upgrade | Buy | 2022-11-07 |
| Sidoti & Co. | downgrade | Neutral | 2022-10-31 |
| Sidoti & Co. | downgrade | Neutral | 2022-10-30 |
Which company has the best grades?
Corning Incorporated consistently receives stronger grades, including multiple “Buy,” “Outperform,” and “Overweight” ratings. Sanmina’s grades trend more conservatively, clustering around “Neutral” and “Hold.” This disparity suggests Corning is viewed more favorably, potentially influencing investor confidence and portfolio weighting decisions.
Risks specific to each company
The following categories identify the critical pressure points and systemic threats facing both firms in the 2026 market environment:
1. Market & Competition
Corning Incorporated
- Faces intense competition in display and optical technologies, requiring constant innovation to maintain leadership.
Sanmina Corporation
- Competes in contract manufacturing with pressure on margins from OEMs and global rivals.
2. Capital Structure & Debt
Corning Incorporated
- Moderate leverage with a debt-to-assets ratio of 27.23%, manageable interest coverage of 7.11.
Sanmina Corporation
- Low leverage and strong interest coverage at 80.01, signaling conservative capital structure.
3. Stock Volatility
Corning Incorporated
- Beta of 1.125 suggests slightly higher volatility than the market average.
Sanmina Corporation
- Beta of 1.049 indicates volatility close to the market, but recent price drop raises caution.
4. Regulatory & Legal
Corning Incorporated
- Exposure to environmental and manufacturing regulations in multiple jurisdictions.
Sanmina Corporation
- Subject to compliance risks across diverse manufacturing and defense sectors.
5. Supply Chain & Operations
Corning Incorporated
- Complex global supply chain with exposure to raw material price fluctuations.
Sanmina Corporation
- Relies heavily on timely component sourcing; any disruption impacts contract fulfillment.
6. ESG & Climate Transition
Corning Incorporated
- Increasing pressure to reduce emissions in manufacturing and product lifecycle.
Sanmina Corporation
- Faces challenges adapting ESG standards across diverse manufacturing sites.
7. Geopolitical Exposure
Corning Incorporated
- Global operations face risks from trade tensions and export controls on technology.
Sanmina Corporation
- Operations sensitive to geopolitical instability affecting supply chains and defense contracts.
Which company shows a better risk-adjusted profile?
Corning’s biggest risk lies in market competition and valuation multiples, which are stretched. Sanmina faces significant operational risk from supply chain and recent stock volatility. Corning’s strong balance sheet and Altman Z-score in the safe zone give it an edge. Sanmina’s financial distress signals and average Piotroski score raise caution. Recent sharp price decline in Sanmina reflects investor concerns over its operational risks. Overall, Corning offers a more resilient risk-adjusted profile in 2026.
Final Verdict: Which stock to choose?
Corning Incorporated’s superpower lies in its robust operational efficiency and strong income growth trajectory. Despite value creation concerns, its expanding profitability signals potential resilience. This makes Corning appealing for investors seeking Aggressive Growth with a tolerance for elevated valuation multiples.
Sanmina Corporation commands a strategic moat through its asset-light model and superior capital efficiency. Its balance sheet strength and lower leverage offer a comparatively safer profile than Corning. Sanmina fits well in a GARP portfolio, blending measured growth with reasonable financial stability.
If you prioritize rapid earnings growth and can withstand valuation premiums, Corning outshines with accelerating profitability. However, if you seek better stability and capital discipline, Sanmina offers a more conservative path with healthy returns on invested capital. Each stock suits distinct investor appetites amid current market dynamics.
Disclaimer: Investment carries a risk of loss of initial capital. The past performance is not a reliable indicator of future results. Be sure to understand risks before making an investment decision.
Go Further
I encourage you to read the complete analyses of Corning Incorporated and Sanmina Corporation to enhance your investment decisions: